Archive:SDG 5 - Gender equality (statistical annex)
This Statistics Explained article has been archived - for recent articles on sustainable development in the European Union see here.
Achieve gender equality and empower all women and girls (statistical annex)
Data extracted in May 2021.
Highlights

This article provides an overview of statistical data on SDG 5 ‘Gender equality’ in the European Union (EU). It is based on the set of EU SDG indicators for monitoring of progress towards the UN Sustainable Development Goals (SDGs) in an EU context.
This article is part of a set of statistical articles, which are based on the Eurostat publication ’Sustainable development in the European Union — Monitoring report on progress towards the SDGS in an EU context — 2021 edition’. This report is the fifth edition of Eurostat’s series of monitoring reports on sustainable development, which provide a quantitative assessment of progress of the EU towards the SDGs in an EU context.
Full article
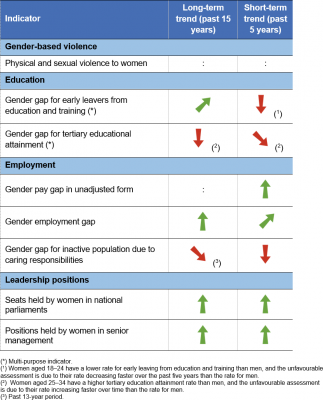
Table 1: Indicators measuring progress towards SDG 5, EU
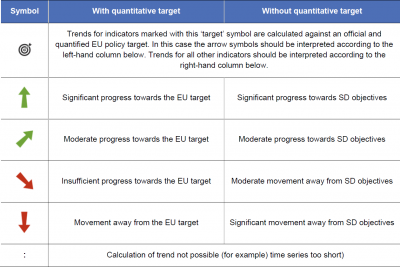
Table 2: Explanation of symbols for indicating progress towards SD objectives and targets


Physical and sexual violence to women

This indicator is based on the results of a survey by the European Union Agency for Fundamental Rights (FRA). Women were asked whether they had experienced physical and/or sexual violence within the 12 months prior to the interview.
.png)
Source: European Union Agency for Fundamental Rights (FRA), Eurostat (sdg_05_10)
.png)
Source: European Union Agency for Fundamental Rights (FRA), Eurostat (sdg_05_10)
Gender pay gap in unadjusted form

The gender pay gap in unadjusted form represents the difference between average gross hourly earnings of male paid employees and of female paid employees as a percentage of average gross hourly earnings of male paid employees. The indicator has been defined as unadjusted because it gives an overall picture of gender inequalities in terms of pay and measures a concept which is broader than the concept of equal pay for equal work. The gender pay gap is based on the methodology of the structure of earnings survey (SES), which is carried out every four years.
.png)
Compound annual growth rate (CAGR) for the total rate: -2.1 % per year in the period 2014-2019.
Source: Eurostat (sdg_05_20)
.png)
Source: Eurostat (sdg_05_20)
Gender employment gap

The gender employment gap is defined as the difference between the employment rates of men and women aged 20 to 64. The employment rate is calculated by dividing the number of people aged 20 to 64 in employment by the total population of the same age group. The indicator is based on the EU Labour Force Survey (EU-LFS).
.png)
Compound annual growth rate (CAGR) for the total rate: -2.5 % per year in the period 2005-2020; -0.5 % per year in the period 2015-2020.
Source: Eurostat (sdg_05_30)
.png)
Source: Eurostat (sdg_05_30)
Gender gap for inactive population due to caring responsibilities

The economically inactive population comprises individuals that are not working, not actively seeking work and not available to work even if they have found a job. Therefore, they are neither employed nor unemployed and considered to be outside the labour force. This definition used in the EU Labour Force Survey (EU-LFS) is based on the guidelines of the International Labour Organization.
.png)
Compound annual growth rate (CAGR) for the total rate: 0.4 % per year in the period 2006–2019; 2.4 % per year in the period 2014–2019.
Source: Eurostat (sdg_05_40)
.png)
Source: Eurostat (sdg_05_40)
Seats held by women in national parliaments

This indicator refers to the proportion of women in national parliaments in both chambers (lower house and upper house, where relevant). The data stem from the Gender Statistics Database of the European Institute for Gender Equality.
.png)
Compound annual growth rate (CAGR) for the total rate: 2.7 % per year in the period 2005–2020; 3.0 % per year in the period 2015–2020.
Source: European Institute for Gender Equality (EIGE), Eurostat (sdg_05_50)
.png)
Source: European Institute for Gender Equality (EIGE), Eurostat (sdg_05_50)
Positions held by women in senior management

This indicator measures the share of female board members in the largest publicly listed companies. The data presented in this section stem from the Gender Statistics Database of the European Institute for Gender Equality.
.png)
Compound annual growth rate (CAGR) for the total rate: 7.8 % per year in the period 2005–2020; 5.9 % per year in the period 2015–2020.
Source: European Institute for Gender Equality (EIGE), Eurostat (sdg_05_60)
.png)
Source: European Institute for Gender Equality (EIGE), Eurostat (sdg_05_60)
Direct access to