Archive:SDG 4 - Quality education (statistical annex)
This Statistics Explained article has been archived - for recent articles on sustainable development in the European Union see here.
Ensure inclusive and equitable quality education and promote lifelong learning opportunities for all (statistical annex)
Data extracted in May 2021.
Highlights

This article provides an overview of statistical data on SDG 4 ‘Quality education’ in the European Union (EU). It is based on the set of EU SDG indicators for monitoring of progress towards the UN Sustainable Development Goals (SDGs) in an EU context.
This article is part of a set of statistical articles, which are based on the Eurostat publication ’Sustainable development in the European Union — Monitoring report on progress towards the SDGS in an EU context — 2021 edition’. This report is the fifth edition of Eurostat’s series of monitoring reports on sustainable development, which provide a quantitative assessment of progress of the EU towards the SDGs in an EU context.
Full article

Table 1: Indicators measuring progress towards SDG 4, EU
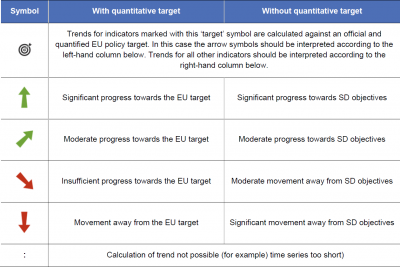
Table 2: Explanation of symbols for indicating progress towards SD objectives and targets


Underachievement in reading, maths and science

This indicator measures the share of 15-year-old students failing to reach level 2 (‘basic skills level’) on the Programme for International Student Assessment (PISA) scale for the three core school subjects of reading, mathematics and science. The data stem from the PISA study, a triennial international survey that aims to evaluate education systems by testing the skills and knowledge of 15-year-old students.
.png)
Compound annual growth rate (CAGR): Reading: –0.4 % per year (observed) and –1.9 % per year (required to meet target) in the period 2006–2018; 4.0 % per year (observed) and – 1.9 % per year (required to meet target) in the period 2015–2018. Maths: –0.6 % per year (observed) and –2.1 % per year (required to meet target) in the period 2006–2018; 1.0 % per year (observed) and –2.6 % per year (required to meet target) in the period 2015–2018. Science: 0.6 % per year (observed) and –1.4 % per year (required to meet target) in the period 2006–2018; 1.9 % per year (observed) and –2.2 % per year (required to meet target) in the period 2015–2018.
Source: OECD (Eurostat online data code (sdg_04_40))
.png)
Source: OECD (Eurostat online data code (sdg_04_40))
Participation in early childhood education

This indicator measures the share of children between the age of three and the starting age of compulsory primary education who participated in early childhood education. Data presented here stem from the joint UIS (UNESCO Institute of Statistics)/OECD/Eurostat (UOE) questionnaires on education statistics, which constitute the core database on education.
.png)
Compound annual growth rate (CAGR): 0.5 % per year (observed) and 0.3 % per year (required to meet target) in the period 2014–2019.
Source: Eurostat (sdg_04_30)
.png)
Source: Eurostat (sdg_04_30)
Early leavers from education and training

This indicator measures the share of the population aged 18 to 24 with at most lower secondary education who were not involved in any education or training during the four weeks preceding the survey. The data stem from the EU Labour Force Survey (EU-LFS).
.png)
Compound annual growth rate (CAGR) for the total share: – 2.9 % per year (observed) and – 2.2 % per year (required to meet target) in the period 2005–2020; – 1.7 % per year (observed) and – 1.3 % per year (required to meet target) in the period 2015–2020. CAGR for the gender gap: – 0.6 % per year in the period 2005–2020; 4.7 % per year in the period 2015–2020.
Source: Eurostat (sdg_04_10)
.png)
Source: Eurostat (sdg_04_10)
Tertiary educational attainment

This indicator measures the share of the population aged 25 to 34 who have successfully completed tertiary studies (for example, at university or a higher technical institution). Tertiary educational attainment refers to ISCED (International Standard Classification of Education) 2011 levels 5–8 for data from 2014 onwards and to ISCED 1997 levels 5–6 for data up to 2013. The indicator is based on the EU Labour Force Survey (EU-LFS).
.png)
Compound annual growth rate (CAGR) for the total share: 2.6 % per year (observed) and 2.0 % per year (required to meet target) in the period 2005–2020; 1.9 % per year (observed) and 1.4 % per year (required to meet target) in the period 2015–2020. CAGR for the gender gap: 3.8 % per year in the period 2005–2020; 0.4 % per year in the period 2015–2020.
Source: Eurostat (sdg_04_20)
.png)
Source: Eurostat (sdg_04_20)
Adult participation in learning

Adult participation in learning refers to people aged 25 to 64 who stated they received formal or non-formal education and training in the four weeks preceding the survey (numerator). The denominator consists of the total population of the same age group, excluding those who did not answer the question ‘participation in education and training’. Adult learning covers formal and non-formal learning activities — both general and vocational — undertaken by adults after leaving initial education and training [1]. Data stem from the EU Labour Force Survey (EU-LFS).
.png)
Compound annual growth rate (CAGR): 1.2 % per year in the period 2005–2020; – 1.8 % per year in the period 2015–2020.
Source: Eurostat (sdg_04_60)
.png)
Source: Eurostat (sdg_04_60)

This indicator measures the share of people aged 16 to 74 having at least basic digital skills. This is the second highest level of the overall digital indicator, which is a composite indicator based on selected activities performed by individuals aged 16 to 74 on the internet in the four specific areas (information, communication, problem solving and content creation). The indicator is based on the EU survey on the ICT usage in households and by individuals.
.png)
Compound annual growth rate (CAGR) for the total share: 0.9 % per year (observed) and 2.6 % per year (required to meet target) in the period 2015–2019.
Source: Eurostat (sdg_04_70)
.png)
Source: Eurostat (sdg_04_60)
Direct access to
More detailed information on EU SDG indicators for monitoring of progress towards the UN Sustainable Development Goals (SDGs), such as indicator relevance, definitions, methodological notes, background and potential linkages, can be found in the introduction of the publication ’Sustainable development in the European Union — Monitoring report on progress towards the SDGS in an EU context — 2021 edition’.
Notes
- ↑ The general definition of adult learning covers formal, non-formal and informal training but the indicator adult participation in learning only covers formal and non-formal education and training. For more information, see: Eurostat, Participation in education and training.