Archive:SDG 15 - Life on land (statistical annex)
This Statistics Explained article has been archived - for recent articles on sustainable development in the European Union see here.
Protect, restore and promote sustainable use of terrestrial ecosystems, sustainably manage forests, combat desertification, and halt and reverse land degradation and halt biodiversity loss (statistical annex)
Data extracted in May 2021.
Highlights

This article provides an overview of statistical data on SDG 15 ‘Life on land’ in the European Union (EU). It is based on the set of EU SDG indicators for monitoring of progress towards the UN Sustainable Development Goals (SDGs) in an EU context.
This article is part of a set of statistical articles, which are based on the Eurostat publication ’Sustainable development in the European Union — Monitoring report on progress towards the SDGS in an EU context — 2021 edition’. This report is the fifth edition of Eurostat’s series of monitoring reports on sustainable development, which provide a quantitative assessment of progress of the EU towards the SDGs in an EU context.
Full article
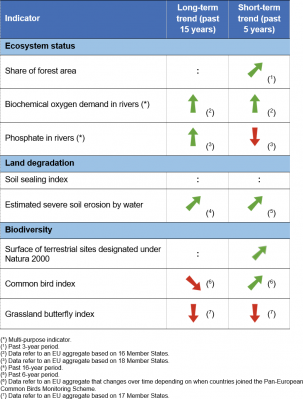
Table 1: Indicators measuring progress towards SDG 15, EU
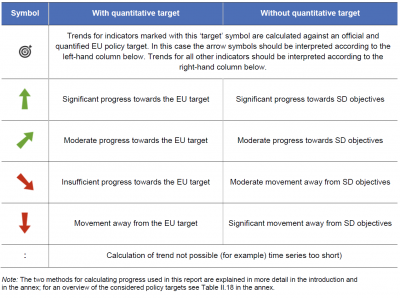
Table 2: Explanation of symbols for indicating progress towards SD objectives and targets


This indicator measures the proportion of Forest ecosystems in comparison to the total land area. Data used for this indicator is derived from the Land Use and Cover Area frame Survey (LUCAS) [1]. The LUCAS land use and land cover classification has been adapted to FAO forest definitions, distinguishing between the categories 'forests' and 'other wooded land'.
.png)
Compound annual growth rate (CAGR): 0.7 % per year in the period 2015–2018.
Source: Eurostat (sdg_15_10)
.png)
Source: Eurostat (sdg_15_10)
Soil sealing index

This indicator estimates the increase in sealed soil surfaces with impervious materials due to urban development and construction (such as buildings, constructions and laying of completely or partially impermeable artificial material, such as asphalt, metal, glass, plastic or concrete). This provides an indication of the rate of soil sealing, which occurs when there is a change in land use towards artificial and urban land use [2]. The indicator builds on data from the Imperviousness High Resolution Layer (a product of the Copernicus Land Monitoring Service).
.png)
Estimated severe soil erosion by water

This indicator estimates the amount of soil lost by water erosion, such as from rain splash, sheet-wash and rills. This provides an indication of the area affected by a certain rate of soil erosion (severe soil loss, E > 10 tonnes/hectare/year). This area is expressed in km2 and as a percentage of the total non-artificial erosive area in the country. These numbers are estimated from soil-erosion susceptibility models and should not be taken as measured values [3]. Data presented in this section stem from the JRC’s soil erosion database.
.png)
Compound annual growth rate (CAGR): – 0.9 % per year in the period 2000–2016; – 0.1 % per year in the period 2010–2016.
Source: Joint Research Centre, Eurostat (sdg_15_50)
.png)
Source: Joint Research Centre, Eurostat (sdg_15_50)
Surface of terrestrial sites designated under Natura 2000

This indicator measures the surface of terrestrial sites designated under Natura 2000. The Natura 2000 network comprises both marine and terrestrial protected areas designated under the EU Habitats and Birds Directives with the goal to maintain or restore a favourable conservation status for habitat types and species of EU interest. The area of these sites can provide an indication of the implementation of the Natura 2000 network, and the ‘completeness’ of its coverage within Member State marine waters. Data provided by the Member States to the Commission are consolidated at least yearly by the European Environment Agency and the European Topic Centre on Biological Diversity (EEA ETC/BD) and collected by European Commission Directorate-General for the Environment.
.png)
Compound annual growth rate (CAGR): 0.1 % per year in the period 2014–2019.
Source: European Commission services, EEA, Eurostat (sdg_15_20)
.png)
Source: European Commission services, EEA, Eurostat (sdg_15_20)
Common bird index

This indicator is an index and integrates the abundance and the diversity of a selection of common bird species associated with specific habitats. Rare species are excluded. Three groups of bird species are represented: common farmland species (39 species), common forest species (34 species) and all common bird species (167 species; including farmland and forest species). The indices are presented for EU-aggregates only and with smoothed values. The index draws from data produced by the European Bird Census Council and its Pan-European Common Bird Monitoring Scheme programme. Data coverage has increased from nine to 22 EU Member States over the period 1990 to 2010, with 25 countries covered as of the reference year 2011 [4].
.png)
Compound annual growth rate (CAGR): – 0.1 % per year (all common birds) and – 0.8 % per year (common farmland birds) in the period 2004–2019; 0.1 % per year (all common birds) and – 0.3 % per year (common farmland birds) in the period 2014–2019.
Source: European Bird Census Council (EBCC)/BirdLife/Statistics Netherlands, Eurostat (sdg_15_60)
Grassland butterfly index

This indicator measures the population trends of 17 butterfly species at EU-level. The index is presented as an EU-aggregate only and with smoothed values. The indicator is based on data from 17 EU Member States (Austria, Belgium, Czechia, Estonia, Finland, France, Germany, Hungary, Ireland, Latvia, Lithuania, Luxembourg, the Netherlands, Romania, Slovenia, Spain, Sweden), but with a limited number of long time-series available [5]. The data are integrated and provided by the European Environment Agency, the European Butterfly Monitoring Scheme partnership and the Assessing Butterflies in Europe (ABLE) project.
.png)
Compound annual growth rate (CAGR): – 1.5 % per year in the period 2003–2018; – 1.2 % per year in the period 2013–2018.
Source: EEA, Butterfly Conservation Europe, European Butterfly Monitoring Scheme partnership, Assessing Butterflies in Europe (ABLE) project, Eurostat (sdg_15_61)
Direct access to
More detailed information on EU SDG indicators for monitoring of progress towards the UN Sustainable Development Goals (SDGs), such as indicator relevance, definitions, methodological notes, background and potential linkages, can be found in the introduction of the publication ’Sustainable development in the European Union — Monitoring report on progress towards the SDGS in an EU context — 2021 edition’.
Notes
- ↑ Eurostat (2019), Statistics Explained, LUCAS — Land use and land cover survey.
- ↑ European Environment Agency (2020), Imperviousness and imperviousness change.
- ↑ Eurostat (2020), Statistics Explained, Agri-environmental indicator — soil erosion.
- ↑ Eurostat (2020), Metadata Biodiversity (env_biodiv).
- ↑ Van Swaay et al.(2020), Butterflies in Europe - Butterfly Indicators Revised.pdf Assessing Butterflies in Europe - Butterfly Indicators 1990-2018, Technical report. Butterfly Conservation Europe & ABLE/eBMS (www.butterfly-monitoring.net).