Archive:SDG 13 - Climate action (statistical annex)
This Statistics Explained article has been archived - for recent articles on sustainable development in the European Union see here.
Take urgent action to combat climate change and its impacts (statistical annex)
Data extracted in May 2021.
Highlights

This article provides an overview of statistical data on SDG 13 ‘Climate action’ in the European Union (EU). It is based on the set of EU SDG indicators for monitoring of progress towards the UN Sustainable Development Goals (SDGs) in an EU context.
This article is part of a set of statistical articles, which are based on the Eurostat publication ’Sustainable development in the European Union — Monitoring report on progress towards the SDGS in an EU context — 2021 edition’. This report is the fifth edition of Eurostat’s series of monitoring reports on sustainable development, which provide a quantitative assessment of progress of the EU towards the SDGs in an EU context.
Full article
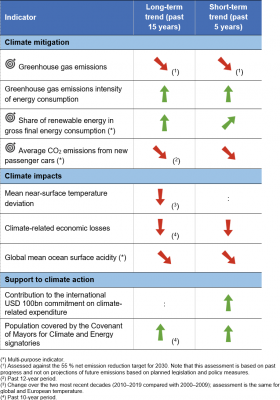
Table 1: Indicators measuring progress towards SDG 13, EU
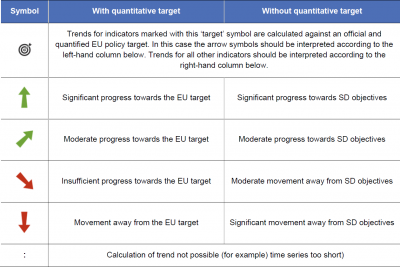
Table 2: Explanation of symbols for indicating progress towards SD objectives and targets


Greenhouse gas emissions

This indicator measures man-made greenhouse gas (GHG) emissions as well as GHG removals [1]. They are integrated into a single indicator — the net GHG emissions — expressed in units of CO2 equivalents using the global warming potential (GWP) of each gas. At present, GHG removals are realised only in the land use, land use change and forestry (LULUCF) sector. Emissions and removals data, known as GHG inventories, are submitted annually by Member States to the EU and the United Nations Framework Convention on Climate Change (UNFCCC). The European Environment Agency (EEA) compiles the EU aggregate data and publishes data for the EU and all Member States. Eurostat republishes the EEA data.
.png)
Compound annual growth rate (CAGR): – 1.5 % per year (observed) and – 2.8 per year (required to meet target) in the period 2004–2019; – 0.7 % per year (observed) and – 3.4 % per year (required to meet target) in the period 2014–2019.
Source: EEA, Eurostat (sdg_13_10)
.png)
Source: EEA, Eurostat (env_air_gge)
.png)
Source: EEA, Eurostat (sdg_13_10)
Greenhouse gas emissions intensity of energy consumption

The GHG intensity of energy consumption is the ratio between energy-related GHG emissions and gross inland consumption of energy. It expresses how many tonnes of CO2 equivalent of energy-related GHGs are emitted in a certain economy per unit of energy consumed. The data on energy emissions are sourced from the GHG emissions reported to the UNFCCC. Gross inland consumption is reported by each Member State to Eurostat and is the sum of final energy consumption, distribution losses, transformation losses and statistical differences.
.png)
Compound annual growth rate (CAGR): – 1.1 % per year in the period 2004–2019; – 1.3 % per year in the period 2014–2019.
Source: EEA, Eurostat (sdg_13_20)
.png)
Source: EEA, Eurostat (sdg_13_20)
Mean near-surface temperature deviation

This indicator tracks deviations in the average near-surface temperature worldwide and for Europe compared with the 1850 to 1899 average. These measurements have been taken for decades by stations forming a dense network across the globe. The data are monitored using standardised measurements, and quality control and homogeneity procedures are used to ensure data are compatible and comparable. The average annual temperature shown here is expressed in relation to the ‘pre-industrial’ baseline period of 1850 to 1899, when widespread temperature measurement was first established [2]. In addition to annual data, decadal averages are shown, as they form the basis for the indicator assessment. Data presented in this section stem from the EEA, based on the Met Office Hadley Centre and Climatic Research Unit (HadCRUT4).
.png)
Source: EEA, Eurostat (sdg_13_30)
.png)
Source: EEA, Eurostat (sdg_13_30)

This indicator includes the overall monetary losses from weather- and climate-related events. It is based on data from the NatCatSERVICE managed by Munich Reinsurance Company [3]. The NatCatSERVICE is a global database of natural catastrophe data around the world, collected since 1974. Due to the variability of the annual figures, the data are also presented as a 30-year moving average to facilitate the analysis of historical trends.
,_EU,_2009-2019_(billion_EUR,_current_prices).png)
Compound annual growth rate (CAGR): 1.8 % per year in the period 2009–2019; 1.9 % per year in the period 2014–2019.
Source: EEA, Eurostat (sdg_13_40)
.png)
Source: EEA, Eurostat (sdg_13_40)

The intention of the international commitment on climate finance under the UNFCCC is to enable and support enhanced action by developing countries to advance low-emission and climate-resilient development. The data presented in this section are reported under the Monitoring Mechanism Regulation (MMR) to the European Commission.
.png)
Compound annual growth rate (CAGR): 11.1 % per year in the period 2014–2019
Source: European Commission services and EIONET, Eurostat (sdg_13_50)
.png)
Source: European Commission services and EIONET, Eurostat (sdg_13_50)
Population covered by the Covenant of Mayors for Climate and Energy signatories

The Covenant of Mayors for Climate and Energy in Europe, now part of the Global Covenant of Mayors for Climate and Energy, represents a growing climate initiative at multiple levels of governance with actors all across the globe pledging to deliver comprehensive climate change mitigation and adaptation and energy action plans and establish a regular monitoring process. Here the number of citizens living within regions that act as signatories to the Covenant of Mayors in Europe is monitored as an indication of the initiative’s reach.
.png)
Compound annual growth rate (CAGR): 7.8 % per year in the period 2010–2020; 3.3 % per year in the period 2015–2020.
Source: Covenant of Mayors for Climate and Energy (sdg_13_60)
.png)
Source: Covenant of Mayors for Climate and Energy (sdg_13_60)
Direct access to
More detailed information on EU SDG indicators for monitoring of progress towards the UN Sustainable Development Goals (SDGs), such as indicator relevance, definitions, methodological notes, background and potential linkages, can be found in the introduction of the publication ’Sustainable development in the European Union — Monitoring report on progress towards the SDGS in an EU context — 2021 edition’.
Notes
- ↑ The ‘Kyoto basket’ of GHGs includes carbon dioxide (CO2), methane (CH4), nitrous oxide (N2O) and the so-called F-gases F-gases, i.e., hydrofluorocarbons, perfluorocarbons, nitrogen trifluoride (NF3) and sulphur hexafluoride (SF6).
- ↑ European Environment Agency (2020), Global and European temperature.
- ↑ Munich RE, NatCatSERVICE.