Archive:SDG 12 - Responsible consumption and production (statistical annex)
This Statistics Explained article has been archived - for recent articles on sustainable development in the European Union see here.
Ensure sustainable consumption and production patterns (statistical annex)
Data extracted in May 2021.
Highlights

This article provides an overview of statistical data on SDG 12 ‘Responsible consumption and production’ in the European Union (EU). It is based on the set of EU SDG indicators for monitoring of progress towards the UN Sustainable Development Goals (SDGs) in an EU context.
This article is part of a set of statistical articles, which are based on the Eurostat publication ’Sustainable development in the European Union — Monitoring report on progress towards the SDGS in an EU context — 2021 edition’. This report is the fifth edition of Eurostat’s series of monitoring reports on sustainable development, which provide a quantitative assessment of progress of the EU towards the SDGs in an EU context.
Full article
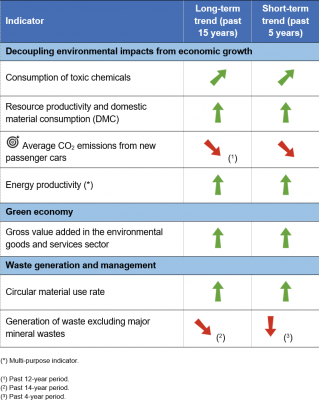
Table 1: Indicators measuring progress towards SDG 12, EU
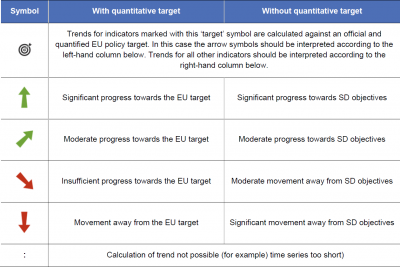
Table 2: Explanation of symbols for indicating progress towards SD objectives and targets


Consumption of toxic chemicals

This indicator measures the volume of aggregated consumption of toxic chemicals, expressed in million tonnes. The consumption of chemicals is calculated as the sum of the production volumes and the net import volumes of the chemicals according to the equation: consumption = production + imports – exports.
.png)
Compound annual growth rate (CAGR) for the total rate: – 0.7 % per year in the period 2004–2019; – 0.3 % per year in the period 2014–2019.
Source: Eurostat (sdg_12_10)
Resource productivity and domestic material consumption (DMC)

Resource productivity is defined as gross domestic product (GDP) divided by domestic material consumption (DMC). DMC measures the total amount of material directly used by an economy. It is calculated as the annual quantity of raw materials extracted from the domestic territory of the focal economy, plus all physical imports, minus all physical exports.
.png)
Compound annual growth rate (CAGR) for the total rate: 2.1 % per year in the period 2004–2019; 1.4 % per year in the period 2014–2019.
Source: Eurostat (sdg_12_20)
.png)
.png)
Average CO2 emissions from new passenger cars

This indicator is defined as the average carbon dioxide (CO2) emissions per km from new passenger cars in a given year. The reported emissions are based on type-approval and can deviate from the actual CO2 emissions of new cars. Data presented in this section are provided by the European Commission, Directorate-General for Climate Action and the European Environment Agency (EEA).
.png)
Compound annual growth rate (CAGR) for the total rate: – 2.1 % per year (observed) and – 3.8 % per year (required to meet target) in the period 2007–2019; – 0.1 % per year (observed) and – 4.2 % per year (required to meet target) in the period 2014–2019.
Source: EEA, European Commission services, Eurostat (sdg_12_30)
.png)
Source: EEA, European Commission services, Eurostat (sdg_12_30)
.png)
Source: European Alternative Fuels Observatory
Gross value added in the environmental goods and services sector

The environmental goods and services sector (EGSS) is defined as that part of a country’s economy that is engaged in producing goods and services that are used in environmental protection and resource management activities either domestically or abroad. Gross value added in EGSS represents the contribution of the environmental goods and services sector to (GDP) and is defined as the difference between the value of the sector’s output and intermediate consumption.
.png)
Compound annual growth rate (CAGR) for the total rate of the EGSS gross value added: 3.5 % per year in the period 2003–2018; 2.4 % per year in the period 2013–2018.
Source: Eurostat index based on online data codes (sdg_12_61) and (nama_10_gdp)
.png)
Source: Eurostat (sdg_12_61)
Circular material use rate

The circular material use rate (CMU) measures the share of material recovered and fed back into the economy in overall material use. The CMU is defined as the ratio of the circular use of materials to the overall material use. The overall material use is measured by summing up the aggregate domestic material consumption (DMC) and the circular use of materials. DMC is defined in economy-wide material flow accounts. The circular use of materials is approximated by the amount of waste recycled in domestic recovery plants minus imported waste destined for recovery plus exported waste destined for recovery abroad. A higher CMU rate value means more secondary materials are being substituted for primary raw materials, thus reducing the environmental impacts of extracting primary material.
.png)
Compound annual growth rate (CAGR) for the total rate: 2.4 % per year in the period 2004–2019; 1.4 % per year in the period 2014–2019.
Source: Eurostat (sdg_12_41)
.png)
Source: Eurostat (sdg_12_41)
Generation of waste excluding major mineral wastes

This indicator is defined as all waste generated in a country, excluding major mineral wastes, dredging spoils and contaminated soils. This exclusion enhances comparability across countries as mineral waste accounts for high quantities in some countries with important economic activities such as mining and construction.
.png)
Compound annual growth rate (CAGR) for the total rate: 0.1 % per year in the period 2004–2018; 1.2 % per year in the period 2014–2018.
Source: Eurostat (sdg_12_50)
.png)
Source: Eurostat (sdg_12_50)
Direct access to