Archive:SDG 10 - Reduced inequalities (statistical annex)
This Statistics Explained article has been archived - for recent articles on sustainable development in the European Union see here.
Reduce inequality within and among countries (statistical annex)
Data extracted in May 2021.
Highlights

This article provides an overview of statistical data on SDG 10 ‘Reduced inequalities’ in the European Union (EU). It is based on the set of EU SDG indicators for monitoring of progress towards the UN Sustainable Development Goals (SDGs) in an EU context.
This article is part of a set of statistical articles, which are based on the Eurostat publication ’Sustainable development in the European Union — Monitoring report on progress towards the SDGS in an EU context — 2021 edition’. This report is the fifth edition of Eurostat’s series of monitoring reports on sustainable development, which provide a quantitative assessment of progress of the EU towards the SDGs in an EU context.
Full article
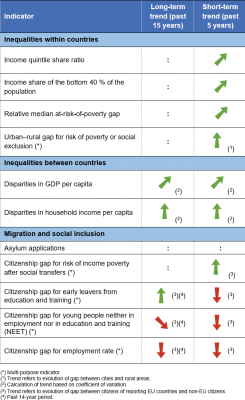
Table 1: Indicators measuring progress towards SDG 10, EU
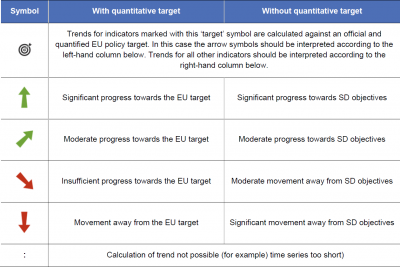
Table 2: Explanation of symbols for indicating progress towards SD objectives and targets


The distribution of income can be measured by using, among others [1], the ratio of total equivalised disposable income received by the 20 % of the population with the highest income (top quintile) to that received by the 20 % of the population with the lowest income (lowest quintile). Equivalised disposable income is the total income of a household (after taxes and other deductions) that is available for spending or saving, divided by the number of household members converted into equivalised adults. Data presented in this section stem from EU Statistics on Income and Living Conditions (EU-SILC).
.png)
Compound annual growth rate (CAGR) for the total rate: – 0.9 % per year in the period 2014–2019.
Source: Eurostat (sdg_10_41)
.png)
Source: Eurostat (sdg_10_41)

This indicator measures the income share received by the bottom 40 % of the population (in terms of income). The income concept used is the total disposable household income, which is a households’ total income (after taxes and other deductions) that is available for spending or saving. Data presented in this section stem from the EU Statistics on Income and Living Conditions (EU-SILC).
.png)
Compound annual growth rate (CAGR) for the total rate: 0.5 % per year in the period 2014–2019.
Source: Eurostat (sdg_10_50)
.png)
Source: Eurostat (sdg_10_50)
Relative median at-risk-of-poverty gap

The relative median at-risk-of-poverty gap helps to quantify how poor the poor are by showing the distance between the median income of people living below the poverty threshold and the threshold itself, expressed in relation to the poverty threshold. The poverty threshold is set at 60 % of the national median equivalised disposable income of all people in a country and not for the EU as a whole. Data presented in this section stem from the EU Statistics on Income and Living Conditions (EU-SILC).
.png)
Compound annual growth rate (CAGR) for the total rate: – 0.6 % per year in the period 2014–2019.
Source: Eurostat (sdg_10_30)
.png)
Source: Eurostat (sdg_10_30)
Disparities in GDP per capita

GDP per capita is calculated as the ratio of GDP to the average population in a specific year. Basic figures are expressed in purchasing power standards (PPS) [2], which represent a common currency that eliminates differences in price levels between countries to allow meaningful volume comparisons of GDP. The disparities indicator for the EU is calculated as the coefficient of variation of the national figures.
.png)
Compound annual growth rate (CAGR) for the total rate: – 0.8 % per year in the period 2004–2019; – 0.9 % per year in the period 2014–2019.
Source: Eurostat (sdg_10_10)
.png)
Source: Eurostat (sdg_10_10)
Disparities in household income per capita

The adjusted gross disposable income of households reflects the purchasing power of households and their ability to invest in goods and services or save for the future, by accounting for taxes and social contributions and monetary in-kind social benefits. The disparities indicator for the EU is calculated as the coefficient of variation of the national figures in PPS per capita.
.png)
Compound annual growth rate (CAGR) for the total rate: – 2.7 % per year in the period 2004–2019; – 3.8 % per year in the period 2014–2019.
Source: Eurostat (sdg_10_20)
.png)
Source: Eurostat (sdg_10_20)
Asylum applications

This indicator shows the number of first-time asylum applicants per million inhabitants and the number of positive first-instance decisions per million inhabitants. A first-time applicant for international protection is a person who lodged an application for asylum for the first time in a given Member State. First-instance decisions are decisions granted by the respective authority acting as a first instance of the administrative/judicial asylum procedure in the receiving country. The source data are supplied to Eurostat by the national ministries of interior and related official agencies.
.png)
Source: Eurostat (sdg_10_60)
.png)
Source: Eurostat (sdg_10_60)
Urban-rural gap for risk of poverty or social exclusion

Statistics on the degree of urbanisation classify local administrative units as ‘cities’, ‘towns and suburbs’ or ‘rural areas’ depending on population density and the total number of inhabitants. This classification is used to determine the difference in the shares of people at risk of poverty or social exclusion between cities and rural areas. Data presented in this section stem from the EU Statistics on Income and Living Conditions (EU-SILC).
.png)
Compound annual growth rate (CAGR) for the total rate of the gap between cities and rural areas: – 22.0 % per year in the period 2014–2019.
Source: Eurostat (sdg_01_10a)
.png)
Source: Eurostat (sdg_01_10a)
Citizenship gaps between non-EU citizens and citizens of reporting EU countries
This section provides data for different indicators by citizenship. Data are shown for non-EU citizens, referring to citizens of non-EU Member States, and for citizens of the reporting countries, referring to citizens of EU Member States that reside in their home country. Data presented in this section stem from the EU Statistics on Income and Living Conditions (EU-SILC) and from the EU Labour Force Survey (EU-LFS).

.png)
Compound annual growth rate (CAGR) for the total rate of the citizenship gap: – 1.0 % per year in the period 2014–2019.
Source: Eurostat (sdg_01_20a)

.png)
Compound annual growth rate (CAGR) for the total rate of the citizenship gap: – 1.4 % per year in the period 2006–2020; 2.9 % per year in the period 2015–2020.
Source: Eurostat (sdg_04_10a)
,_by_citizenship_evaluation_2021.png)
,_by_citizenship,_EU,_2006-2020_(%25_of_population_aged_15_to_29).png)
Compound annual growth rate (CAGR) for the total rate of the citizenship gap: 0.9 % per year in the period 2006–2020; 1.3 % per year in the period 2015–2020.
'Source: Eurostat (sdg_08_20a)

.png)
Compound annual growth rate (CAGR) for the total rate of the citizenship gap: 5.3 % per year in the period 2006–2020; 3.2 % per year in the period 2015–2020.
Source: Eurostat (sdg_08_30a)
Direct access to
Notes
- ↑ The income quintile share ratio looks at the two ends of the income distribution. Other indicators, such as the Gini index, measures total inequality along the whole income distribution.
- ↑ The purchasing power standard (PPS) is an artificial currency unit. Theoretically, one PPS can buy the same amount of goods and services in each country. However, price differences across borders mean different amounts of national currency units are needed for the same goods and services depending on the country. PPS are derived by dividing any economic aggregate of a country in national currency by its respective purchasing power parities. PPS is the technical term used by Eurostat for the common currency in which national accounts aggregates are expressed when adjusted for price level differences using PPPs. Thus, PPPs can be interpreted as the exchange rate of the PPS against the euro.