Archive:Quality of life in Europe - facts and views - economic and physical safety
This article has been archived. For updated information see Quality of life indicators - economic and physical safety.The paper format and the PDF format latest edition, ISBN 978-92-79-43616-1, doi:10.2785/59737, Cat. No KS-05-14-073-EN-N are still available.

Source: Eurostat (EU SILC)
Source: Eurostat (EU SILC)
Source: Eurostat (EU SILC)
Source: Eurostat (EU SILC)

Source: Eurostat (EU SILC)
Source: Eurostat (EU SILC)
Source: Eurostat (mddw03)
Source: Eurostat (ilc_mdes04)
Source: Eurostat (ilc_lvhl30)
Source: Eurostat (EU SILC)

Source: Eurostat (EU SILC)

Source: Eurostat (EU SILC)
Source: Eurostat (EU SILC)

Source: Eurostat (EU SILC)
Source: Eurostat (EU SILC)

Source: Eurostat (EU SILC)
Source: Eurostat (ilc_mdes05)
This article focuses on the sixth dimension of the ‘8+1’ quality of life indicators framework, economic and physical safety and is the sixth in a series of nine articles forming the publication Quality of life in Europe - facts and views.
This analysis will first focus on physical safety before describing the subjective indicator regarding feelings of security, taking also into consideration how different socio-economic groups (such as age categories, gender and income terciles) evaluate their level of physical safety. Following this, the relationship between the assessment indicator and objective measurements belonging to the same domain will be examined.
The second part focuses on economic security. As mentioned, the emphasis will be on the inability to face unexpected expenses (also analysed by socio-demographic breakdowns). However, the association of the indicators ‘inability to face unexpected expenses’ and ‘being in arrears’ with the satisfaction and financial situation of the household will also be looked into.
By analysing objective information together with subjective assessments, this article once more underlines that quality of life is influenced by both an individual’s/household’s objective security and the subjective perceptions of how safe people feel. This is particularly true for the dimension ‘economic and physical safety’ for which the subjective perception is especially relevant.
Main statistical findings
Physical and economic safety in a quality of life perspective
46.4 % of European residents reported feeling fairly safe when walking alone at night in 2013, while 28.4 % reported feeling very safe and 25.2 % very or a bit unsafe. More women than men feel unsafe and older EU residents report lower figures for physical safety than younger age groups. Europeans felt safer in less populated areas when walking alone in their neighbourhood at night.
Living in neighbourhoods that are exposed to crime, violence or vandalism generally decreases the feeling of physical safety. The perceived exposure to crime etc. in the neighbourhood is related to the subjective assessment of physical safety, both at country and individual level.
Among the EU population, 28 % felt very safe when walking home at night, while 25 % felt unsafe.
Regarding economic safety, young people aged 16–24 (46.2 %) followed by those aged 25–34 (43.8 %) recorded the highest rates of inability to face unexpected expenses. Overall, however, economic safety tends to increase with age in the EU though this varies significantly between countries. Living in single-parent or single-female households is associated with higher rates of inability to pay for unexpected expenses. Unsurprisingly, the highest shares of inability to pay for unexpected expenses were recorded amongst the unemployed population, while the lowest shares were observed for the self-employed. When looking at the relationship between the proportion of people with low financial satisfaction and the proportion of people unable to face unexpected expenses and of those in arrears, a clear positive association can be observed.
EU policies related to economic and physical safety
The subjective perception of threat and the resulting feelings of insecurity undermine quality of life, in addition to experiencing these objective adverse conditions. To address this, the European Council endorsed the EU Internal Security Strategy (‘Towards a European Security Model’) at its meeting in March 2010. The strategy sets out the challenges, principles and guidelines for dealing with security threats related to organised crime, terrorism and natural- and man-made disasters. The Commission adopted a communication with proposed actions for implementing the strategy in 2011–14 (‘The EU Internal Security Strategy in Action: Five steps towards a more secure Europe’ COM final 0673/2010).
The concept of economic safety is mainly addressed by European policies on the safety net provided by the welfare state. The Social Protection Committee (SPC) is an EU advisory policy committee established by the Treaty on the Functioning of the EU (Article 160), and monitors the development of social protection policies in Member States.
Physical safety
How safe people are — how safe people feel
Physical safety refers to being protected from situations that put a person’s physical security at risk, such as crimes, accidents or natural disasters. A perceived lack of physical safety may affect subjective well-being more than the actual effects of a physical threat. Homicide accounts only for a small percentage of all deaths, but its effect on people’s emotional lives is very different from the effect of deaths related for instance to medical conditions. Consequently, the effects of those crimes that affect a person’s physical safety are socially magnified and affect the quality of life not only of those close to the victim, but also of many others who then feel unsafe or afraid.
The quality of life framework provides indicators for both aspects (subjective and objective) of physical security. For instance the homicide rate gives an objective picture of physical integrity in society. This is the most harmonised EU indicator on crime available. However, homicide is a rare event and as such it needs to be complemented by further information concerning other types of crime which are more frequent. Since police records for other crimes have not been adequately harmonised up to now, EU-SILC is used as a source to provide information on crime, violence or vandalism in the neighbourhood. The ‘feelings of safety’ indicator adds relevant information on perceived lack of safety in the neighbourhood.
Perceived physical safety of individuals
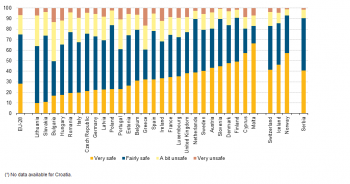
When asked how safe they felt when walking alone in their area at night, nearly half of EU residents aged 16 or more (46.4 %) replied ‘fairly safe’ in 2013. 28.4 % of them replied that they felt very safe, while 25.2 % replied that they felt a bit or very unsafe (Figure 1).
The highest proportions of people who felt very safe (Figure 2) were recorded in Malta and Cyprus (66.4 % and 57.1 % respectively) and at some distance, Finland (49.0 %), Denmark (47.7 %), Slovenia (44.7 %) and Austria (43.4 %). On the other hand, only 9.8 % of Lithuanian residents and 11.0 % of Slovak residents felt very safe in their area when walking alone at night. Bulgaria recorded the highest proportion of people rating their physical security at a low level (a bit or very unsafe) (78.5 %), followed by Greece (40.0 %) and Portugal (39.1 %).
Does perceived physical security vary among socio-demographic groups?
Self-assessed physical safety, by its very nature, is subjective. It may be influenced by personal experiences, as well as opinions from others, which are processed by an individual relative to their own beliefs and attitudes. In the context of safety, the media also plays a crucial role in shaping personal views of safety in society. This perception may of course vary depending on a set of socio-demographic characteristics such as age, sex or income, but also on their exposure to crime, violence or vandalism, which may lead to different levels of awareness regarding the existence of this problem. The analysis below details how such factors relate to how European citizens perceive their physical safety.
Physical safety was highest among young and middle aged people and lowest for people aged 75+
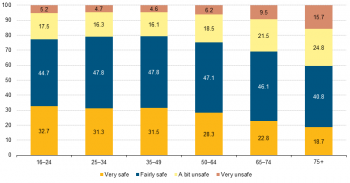
As can be seen in Figure 3 physical security is partly associated with age. The illustration shows that there were no significant differences between the younger and middle age groups (16–24/25–34/35–49). However starting from the age of 50, perceived insecurity increases per age group. For the group 50–64 the proportion of people who felt a bit or very unsafe (24.7 %) was higher than but still comparable with that of the younger age groups. For those between 65 and 74 (31 %) and particularly for the 75+ group (40.5 %) the shares were significantly higher.
Gender significantly affected the perception of physical security
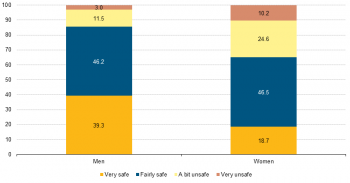
As shown in Figure 4, there were significant differences of perceived physical safety between men and women. While 85.5 % of men reported feeling very or fairly safe, the same held true for only 65.2 % of the female population. On the other hand, 34.8 % of women felt a bit or very unsafe although the same was true for only 14.5 % of men. Again, these differences were observed throughout all countries.
The biggest differences were observed in Sweden, where 35.8 % of the female population and only 5.7 % of the male population reported feeling a bit or very unsafe. The differences were lowest in Bulgaria (45.4 % versus 54.8 %), Slovakia (21.4 % versus 30.3 %) and Slovenia (5.7 % versus 14.8 %).
People living in sparsely populated areas felt safer
Figure 5 illustrates perceptions of physical safety by degree of urbanisation. It can immediately be seen that there were only slight differences in the perception of physical safety between people in cities and suburbs/towns. Moreover, people in rural areas reported by far the highest proportion of people feeling very safe (36.9 %) compared to people in cities and towns/suburbs (23.1 % and 28.2 % respectively). Of EU residents living in urban areas, 30.3 % felt a bit or very unsafe, which was nearly twice the proportion in rural areas (17.8 %). These figures illustrate that the less an area was urbanised, the safer Europeans felt when walking alone in their neighbourhood at night.
Among the EU population living in rural areas, 37 % felt very safe when walking alone at night, while this share was 23 % and 28 % in cities and suburbs/towns respectively.
People who lived in neighbourhoods that were exposed to crime, violence or vandalism had a higher probability of feeling unsafe
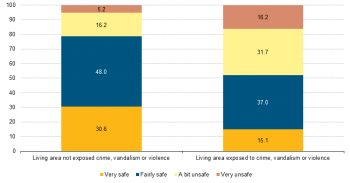
The indicator of the presence of crime, violence or vandalism in the area is meant to assess if this kind of behaviour (which violates prevailing norms, specifically, cultural standards prescribing how humans ought to behave normally) is present in the neighbourhood in which the person lives, in a way that poses problems to the household. The data in Figure 6 shows that persons who reported the existence of these kinds of problems in the area in which they lived in tended to also feel less safe when walking alone at night. Almost half (47.9 %) of the population reporting the existence of crime in their area felt either very or a bit unsafe when walking alone in the dark, while the same was true for only 21.4 % of those who did not identify these kinds of problems in the vicinity of their dwelling. Clearly, facing crime-related problems in their area can have a negative impact on safety feelings.
Homicide figures are more comparable than other crime data available in Europe and are generally reported because of their seriousness. In addition, definitions vary less between countries than those for other types of crime. Hence, homicide data can be used as a proxy indicator of physical safety. However, there are limitations in using this indicator, as the data may to some extent depend on police procedures for declaring homicides and the promptness and quality of medical interventions.
For statistical purposes, homicide is defined as the intentional killing of a person, including murder, manslaughter, euthanasia and infanticide. It excludes death by dangerous driving, abortion and assisted suicide. Attempted homicide is also excluded. In contrast to other offences, the number of victims are counted and not the number of cases.
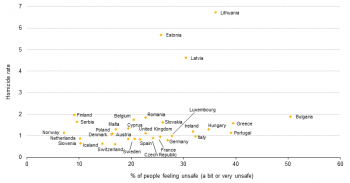
Figure 7 illustrates the association between the homicide rate and the proportion of people feeling a bit or very unsafe. Homicide rates were relatively low throughout the EU. Most country figures range between 0.6 and 2.0 homicides per 100 000, the exceptions being the Baltic Countries with homicide rates between 4.6 in Lithuania and 6.7 in Latvia. The proportion of people feeling unsafe, on the other hand, varied widely between countries (from 9.1 % in Finland to 50.6 % in Bulgaria). No real pattern emerged when examining the association of both items. The Baltic countries also recorded high proportions of people feeling unsafe, but shares were higher in Greece and Portugal, where homicide rates were comparable to the EU average. Finland, on the other hand, had the lowest proportion of perceived physical insecurity, but homicide rates were as high as in Bulgaria.
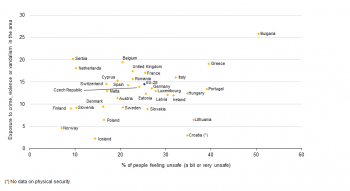
The relationship between the percentage of people reporting crime, violence or vandalism in their area and the proportion of people feeling a bit or very unsafe in the countries is shown in Figure 8. With the exception of Norway at one end (having the lowest proportion of people feeling a bit or very unsafe and one of the lowest rates of people reporting crime, vandalism or violence) and Bulgaria at the other (having the highest proportion of low perceived physical safety and of people reporting crime, vandalism or violence in their area), no association can be identified. On average in the EU-28, 25.3 % of the population reported a low level of physical safety, while 14.5 % declared being exposed to crime, violence or vandalism in the area. However, some countries showed quite a contradictory picture, such as Belgium or the Netherlands with comparatively high proportions of people reporting crime, vandalism or violence in the area, but only a small percentage of people feeling a bit or very unsafe (10.1 %). The contrary was true for Lithuania with a comparatively low percentage of people living in areas with crime, violence or vandalism (6.4 %), but a quite high proportion of people with low subjective physical security (36.2 %). Previous research suggests that a contrasting juxtaposition of crime rates from police registers and subjective perceptions of the exposure to crime has its limits, as population groups with low victimisation rates are particularly afraid of crime (the fear of victimisation paradox)[1].
Economic safety
The capacity to face economic shocks
Economic safety embraces many aspects, both subjective and objective. Economic safety is distinguished from income poverty and material deprivation (which are indicators reflecting the current situation) and indicates the future. This means that economic safety has a profound psychological dimension, which is based on the current situation of a household/individual and the expectations on how the situation will evolve in the future.
In the following section, two aspects of economic safety are discussed: first, the distribution of economic risks as described by the ability of the household to face unexpected expenses (hereafter referred to as ‘unexpected expenses’) is examined. The respective question in EU-SILC is ‘Can your household afford an unexpected required expense and pay through its own resources?’, whereby an unexpected expense can refer for instance to surgery, funeral, major repair in the house, replacement of durables like washing machine, car and others[2]. The term ‘own resources’ means that the household does not ask for financial help from others, debits its own account in the required period, and that the situation regarding potential debts is not deteriorated.
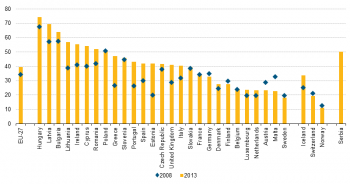
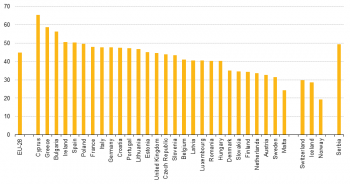
As illustrated in Figure 9, the EU’s population had higher rates of people unable to pay for unexpected expenses in 2013 (39.4 %) than in 2008 (34.3 %). The proportion drastically went up in those countries that were most struck by the economic crisis such as Estonia (+ 22.3 percentage points), Greece (+ 20.5 percentage points), Lithuania (+ 18.1 percentage points), Portugal (+ 17 percentage points) and Ireland (+ 15.4 percentage points), while it significantly decreased in Malta (– 10.0 percentage points), Austria (– 5.5 percentage points) and Finland (– 2.2 percentage points).
Almost 40 % of the EU population were unable to pay for unexpected expenses in 2013.
Another important element for the economic safety of an individual is job security. In the ‘Quality of life Framework’ this element is measured with an indicator regarding the likelihood of losing one’s job. In a flexible labour market, the probability of high fluctuation is a factor that might also increase feelings of unsafety and thus have an impact on the evaluation of economic risks. In this context, EU-SILC provides information on labour market transitions, based on the longitudinal component of the survey. The same persons are interviewed for 4 years in a row, and this allows the calculation of an indicator regarding the percentage of persons who transitioned from employment to unemployment from year N–1 to year N.
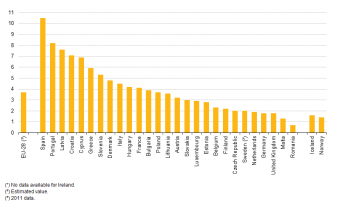
Figure 10 illustrates the percentage of the population who changed their labour market status from being employed in 2011 to being unemployed in 2012. The highest rates of people becoming unemployed were observed in Spain (10.5 %), Portugal (8.2 %), Latvia (7.6 %) and Croatia (7.1 %). At the other end of the spectrum were Romania (with a marginal change rate of about 0.7 %), Malta (1.3 %) and Germany (1.8 %).
How does economic safety vary among socio-demographic groups?
Economic safety is unequally distributed among different socio-demographic groups. People with safe jobs and regular incomes will have a more positive view than unemployed people or people who cannot participate in the labour market due to illness or other limitations. One-person households with small pensions will have a higher probability of not being able to cope with economic risks than two person households with double income. In the following, the focus will be on those groups who are particularly exposed to economic risks in the EU. The analysis is performed mainly at the EU level, but country specificities will also be discussed.
The capacity to face unexpected expenses was lowest among middle-aged people and highest for people in the young and old age groups
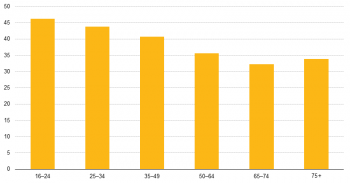
As can be seen in Figure 11 the capacity to face ‘unexpected expenses’ increases with age. In particular, the age group 16–24 reported the highest proportion of people unable to face such expenses (46.2 %), while this was the case for 32.2 % of people in the age group 65–74. The proportion of the 75+ in this situation was slightly higher than the age group 65–74, which might be associated with a high proportion of single-female households in this age group[3] living from a widow or minimum pension and thus reflects a typical cohort effect[4]. In general it can be said that economic safety (measured by the ability to face ‘unexpected expenses’) increases with age, except for the age group 75+, and is highest for those being 65–74 (though still 35.8 % within this age group are at risk when faced with unexpected expenses).
The pattern of this age-specific shape is however not the same for all EU Member States. In the Nordic EU Member States (i.e. Denmark, Finland and Sweden) the proportion of people being incapable of facing unexpected expenses decreases with age at a more pronounced rate than on average in the EU, although there is a very slight increase in the oldest age group. However, in Belgium, Germany and the Netherlands the risks are highest in the middle aged groups 25–34 and 35–49. In the southern EU Member States Greece, Italy, Spain and Portugal proportions are highest amongst the youngest and oldest age groups. In Bulgaria and to some extent Romania, the inability to face unexpected expenses increases with age. Finally, the inability to face unexpected expenses is more or less evenly distributed among the age groups in Croatia (with a slight u-tendency), Poland and Slovenia as well as in the Baltic countries.
Economic safety was highest among couples older than 65 without children and lowest for one-parent households
Household composition has an important impact on how economic risks are spread as is shown in Figure 12. Generally, one-person households had higher risks than two-person households but with some differences across sub-groups. The lack of safety was highest for single-person households with children (64.5 % as EU-28 average, varying from 38.9 % in the Netherlands to 89.9 % in Hungary). Additionally more than half of the single-female households reported being unable to face unexpected expenses (45.6 % for age group 65+ and 51.3 % for age group <65). The lowest proportions were observed for two adult households aged 65+ (27.3 %) and younger than 65 (32.6 %).
Reasons for this distribution can be seen in the precarious situation of single-adult households with children, where one person alone is responsible for both household income and care-giving responsibilities. Many single parents therefore have an even stronger economic pressure. Older 2 adult households on the other hand, who have already paid their credit liabilities and in many cases live in owned apartments or houses might be dependent on low pensions as well. The difference is, however, that they can count on a fixed income and/or wealth (which on average is highest in older ages) and are thus in a better position to cope with economic risks.
Highest proportion of persons unable to pay for unexpected expenses among unemployed people, lowest for the self-employed
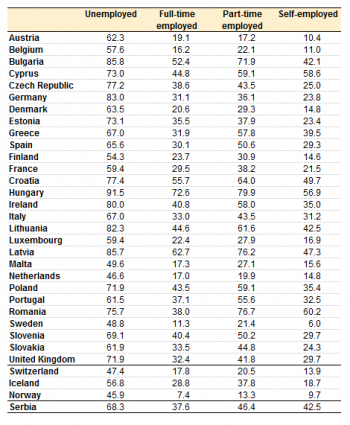
As can be seen in Figure 13, it is of interest that Europeans who are self-employed showed the lowest proportion of inability to face unexpected expenses (30.8 %) as this group is often confronted with entrepreneurial risk and uncertainty. However, it might also be that this group has generally more assets available to count on. Unsurprisingly, unemployed Europeans reported the highest risk, as 69 % of persons belonging to this group were not capable of facing unexpected expenses. As can be seen in Table 1 with the exception of the Nordic EU Member States (Denmark, Finland and Sweden) and the Netherlands, in all other EU Member States the rates of unemployed people unable to pay for unexpected expenses were clearly above 50 %.
As Figure 14a demonstrates, there is a clear relationship between the proportion of people in the lowest income terciles who were unable to pay for unexpected expenses and that of people in the highest income group. This is of interest, because it provides insights on inequality within a country. However, the figure shows that high rates for people in the low income group are associated with high rates for those with high incomes, which was particularly the case in most eastern EU Member States (Hungary, Latvia, Croatia, Bulgaria, Lithuania and Romania). On the other hand, in the Nordic EU Member States but also in Austria, Belgium, Luxembourg and Malta (as well as in Norway and Switzerland) both income groups had comparably low rates of inability to face unexpected expenses.
While this illustration does not say anything about the income distribution within the countries, it highlights the dispersion of economic risks between the two different groups. So far, one might conclude that if inability to pay for unexpected expenses is observed as a widespread problem within the country, it applies to all groups of society proportionally.
Financial satisfaction and economic insecurity
This section examines the assessment of the financial situation of the household by European residents. This is achieved by comparing the degrees of low satisfaction of the entire population to the proportion of the population which is exposed to economic risks as measured by the (in)ability to face unexpected expenses and the share of people who are in arrears, (which means they could not pay their mortgage/rent payment, utility bills or hire purchase instalments on time because of financial reasons).
The inability to face unexpected expenses tended to be associated with low financial satisfaction
In 2013, 39.7 % of persons living in EU Member States declared not being able to pay expenses which are unexpected. Virtually the same proportion, 37.6 %, declared a low level of satisfaction with the financial situation of the household (0–5 on a scale of 0–10). Compared to this, the problem of arrears is less widespread — only 14.5 % of European citizens are in such a situation.
The Nordic EU Member States but also Austria, Belgium, Luxembourg and the Netherlands generally tend to have lower proportions of people having a low satisfaction with the financial situation, while high proportions are observed in some of the eastern EU Member States (Bulgaria, Latvia, Croatia) as well as Greece and Portugal.
As Figure 15 illustrates, there is a strong positive relationship between the proportions of people with a low financial satisfaction and those who cannot pay for unexpected expenses. These relationships can be better observed with the formation of three main clusters of countries along the correlation line. In particular, the first group consists of Austria, Belgium, Luxembourg, Switzerland, the Netherlands and the Nordic EU Member States. These countries present relatively low proportions of people unable to face unexpected expenses (between 18.2 % in Sweden and 27.6 % in Denmark) and low rates of ‘low financial satisfaction’ (from 10.9 % in the Netherlands to 24.9 % in Austria).
A second group of countries which can be identified around the EU-28 average consists of the United Kingdom, Spain, Italy, Germany, the Czech Republic, Poland, Slovenia, Slovakia and Estonia, where proportions for both indicators lie roughly between 35 % and 55 %.
Finally, the third cluster consists of those countries with very high rates of ‘inability to face unexpected expenses’ and also of people with a low level of financial satisfaction such as Latvia, Croatia and Bulgaria.
Of course, there are also some outliers which do not belong in any of the groups around the correlation line. Such countries are for instance Greece and Portugal which had average rates of inability to face unexpected expenses (47.1 % and 43.2 %) but very high proportions of people with low financial satisfaction (65.9 % and 67.0 %). On the other hand, Romania had a comparatively low rate of people with ‘low financial satisfaction’ (30.2 %) but a proportion unable to face unexpected expenses clearly above the EU average (52.1 % versus 39.7 %). The opposite was true for Malta, where the rate of people with ‘low financial satisfaction’ was close to EU average at 36.9 % and the proportion of people unable to face unexpected expenses was at 22.8 %.
Clear connection between being in arrears and financial satisfaction
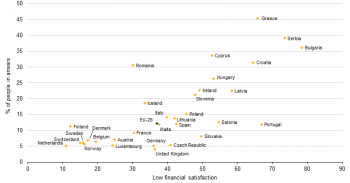
The relational pattern is quite similar for the two variables contrasted in Figure 16, namely people in arrears and the proportion of people with low financial satisfaction. The extreme points are the Netherlands on the one hand with the second lowest rate of people in arrears and a very modest rate of low satisfaction and Bulgaria and Greece on the other hand, where both rates are among the highest.
Three countries are worth mentioning because the association is quite opposite to the EU tendency. These are the United Kingdom, Romania and Portugal. In particular, the United Kingdom reported the lowest proportions of people in arrears (3.9 %), but a share of people with low financial satisfaction which is close to the EU average (36.4 % in the United Kingdom vs 37.6 % in the EU-28 respectively). However, Romania reported a very high proportion of people being in arrears (30.5 %) but a comparably moderate share of people with low financial satisfaction (30.2 %). Finally in Portugal, 67 % of residents reported a low financial satisfaction, while the proportion of those being in arrears was 11.8 %, exactly the same as the EU average.
Data sources and availability
An ad-hoc module on subjective well-being was implemented in the EU-SILC 2013. This module contains subjective questions (e.g. How satisfied are you with your life these days?) which complement the mostly objective indicators from existing data collections and social surveys.
The "GDP and beyond" communication, the SSF Commission recommendations, the Sponsorship on measuring progress, and the Sofia memorandum all underlined the importance of collecting high quality data about people's quality of life and well-being and the central role that statistics on income and living conditions (SILC) have to play in this improved measurement. The collection of micro data related to well-being therefore is a key objective. In May 2010 both the Living Conditions Working Group and the Indicators Sub-Group of the Social Protection Committee supported Eurostat's proposal to collect micro data related to well-being within the 2013 module of SILC in order to better respond to this request.
For more information please visit: Eurostat - GDP and beyond - Quality of life
The concept of economic safety covers aspects such as wealth, debt, and job insecurity. In order to measure a household’s wealth, indicators measuring the wealth accumulated by the household should be used. However, comparable data does not exist for all EU Member States. The ability to face unexpected expenses, complemented by having (or not having) arrears[5] (as an indicator of debt) is therefore used as a proxy variable.
Physical insecurity includes all the external factors that could potentially put the individual’s physical integrity in danger. Criminal actions and accidents are only the most obvious examples and a significant proportion of people are confronted with violence in everyday life. Regarding the topic of ‘physical personal safety’, crime is measured using both administrative data on national homicide rates based on police records and EU-SILC survey data on the percentage of persons reporting crime, violence or vandalism in their neighbourhood. These are complemented by an indicator measuring feelings of safety. Both aspects — the subjective perception of insecurity and the objective lack of safety as measured by crime statistics — play an important role.
Context
Security is a crucial aspect of citizens’ lives. Being able to plan ahead and overcome a sudden deterioration in their economic and wider environment has an impact on their quality of life. Insecurity of any kind is a source of fear and worry which can have a negative impact on the general quality of life. It implies uncertainty regarding the future which may have a negative impact on the present. The economic crisis has shown how important economic safety is for the quality of life of Europeans, as the feeling of vulnerability can drastically reduce the sense of personal freedom.
For statistical purposes, it is useful to distinguish between two major categories: economic and physical safety. Statistics on economic safety measure the risks that could potentially cause material living conditions to suddenly deteriorate, and a household’s capacity to be protected from this. Statistics on physical safety focus on risks that might threaten physical safety. Both aspects will therefore be discussed separately in this article.
What do economic and physical safety entail?
There are different risks that may unexpectedly and adversely affect a household’s material conditions or a person’s physical safety. For the purposes of statistical measurement, two categories of safety were distinguished: economic and physical safety. Economic safety and vulnerability refer to economic aspects as expressed through wealth, debt, and income/job insecurity. Physical and personal safety covers the following aspects:
- the homicide rate;
- the self-reported existence of crime, violence or vandalism in one’s area; and
- the perception of physical security.
See also
- All articles on living conditions and social protection
- Quality of life indicators (online publication)
Further Eurostat information
Main tables
- Income distribution and monetary poverty (t_ilc_ip)
- Monetary poverty (t_ilc_li)
- Monetary poverty for elderly people (t_ilc_pn)
- In-work poverty (t_ilc_iw)
- Distribution of income (t_ilc_di)
- Material deprivation (ilc_md)
- Material deprivation by dimension (t_ilc_mddd)
- Housing deprivation (t_ilc_mdho)
- Environment of the dwelling (t_ilc_mddw)
Database
- Income distribution and monetary poverty (ilc_ip)
- Monetary poverty (ilc_li)
- Monetary poverty for elderly people (ilc_pn)
- In-work poverty (ilc_iw)
- Distribution of income (ilc_di)
- Material deprivation (ilc_md)
- Material deprivation by dimension (ilc_mddd)
- Economic strain (ilc_mdes)
- Economic strain linked to dwelling (ilc_mded)
- Durables (ilc_mddu)
- Housing deprivation (ilc_mdho)
- Environment of the dwelling (ilc_mddw)
- EU-SILC ad hoc module (ilc_ahm)
Dedicated section
Methodology / Metadata
- Income and living conditions (ESMS metadata file — ilc_esms)
Source data for tables and figures and maps (MS Excel)
Notes
- ↑ e.g. Schwind, H.-D., Kriminologie — eine praxisorientierte Einführung mit Beispielen, (2009), Heidelberg: Kriminalistik Verlag or Herbst, S., Untersuchungen zum Viktimisierungs-Furcht-Paradoxo, (2011), Baden-Baden: Nomos.
- ↑ Eurostat 2013, EU-SILC 065 (2013 operation).
- ↑ 22.3 % of people aged 65+ or older are female single-households (for the group 75+ the proportion is even higher), as compared to x in the total population.
- ↑ It is a cohort or generation effect because many women of this age groups lived in a male bread-winning household with one income and are now widows who live on minimum pensions.
- ↑ People who are in arrears may not be able to pay their mortgage/rent payment, utility bills or hire purchase instalments on time because of financial reasons.
