Archive:First and second-generation immigrants - statistics on labour market indicators
Data extracted in September 2016.
No planned article update.
This Statistics Explained article has been archived. For updated data on migration and asylum see Migration and asylum.
Highlights
This article provides an overview of the labour market situation of immigrants and their descendants, within the European Union (EU). It is part of an online publication First and second-generation immigrants - a statistical overview containing data collected by Eurostat from the 2014 Labour Force Survey (LFS) ad-hoc module on the ‘Labour market situation of immigrants and their immediate descendants’.
- Authors: Georgiana Ivan, Mihaela Agafiţei
Full article
General overview
The analysis includes the main characteristics of the population by migration status (see Figure 1) and their distribution within the following labour force indicators:
- Activity rates among ‘first’ and ‘second-generation immigrants’;
- Employment rates among ‘first’ and ‘second-generation immigrants’;
- Unemployment rates among ‘first’ and ‘second-generation immigrants’.
The analysis focuses (with one exception) on the 25–54 age group, with the aim of excluding migration related to non-economic reasons, such as study and retirement. This also reduces the effect of different age structures on the three main migration status groups. In 2014, around 9 150 000 ‘second-generation immigrants’ and 20 850 000 ‘first-generation immigrants’ were employed in the EU, which made up 5.6 % and 12.7 %, respectively of the EU employed population aged 25–54. See ‘Methodology/Metadata’ for further details. The three main labour indicators are analysed in this article: activity, employment and unemployment rates.
In general, an overall deterioration of the labour market situation was noted between 2008 and 2014, as for most groups there was a decrease in activity and employment rates and an increase in unemployment rates. The ‘first-generation immigrants’ with ‘non-EU origins’ and native born were in most cases more strongly affected by this trend, registering the highest relative increase in unemployment rates (which reached more than 17 % for the first group in 2014).
In 2014, ‘second-generation immigrants’ of ‘EU origins’ were generally the group with the best labour market outcomes. 87.4 % of them were active on the labour market as compared with 77.8 % for the ‘first-generation immigrants’ with ‘non-EU origins’, who registered the lowest activity rate. Also, the difference between male and female activity rates was smallest among the ‘second-generation immigrants’ with ‘EU origins’ (7.5 percentage points (pp), while for other groups it was over 11 pp, reaching 23.4 pp for the first generation born outside of the EU).
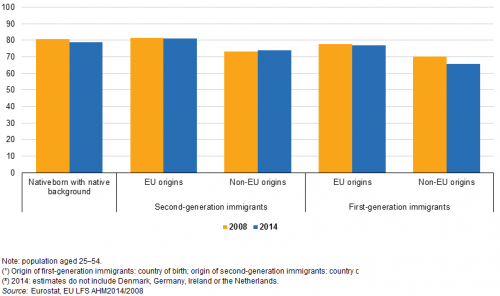
Also in the case of employment rates, it was the ‘second-generation immigrants’ with ‘EU origins’ that presented the highest values in 2014 (81.1 %, as compared with 65.5 % for ‘first-generation of immigrants’ with ‘non-EU origins’). When comparing with previous data from 2008 the decrease of employment rates was highest among first-generation ‘non-EU’ immigrants (70.2 % to 65.5 %), in particular for men (from 81.7 % to 75.1 %) and the low skilled (62.0 % to 54.6 %) in this group.
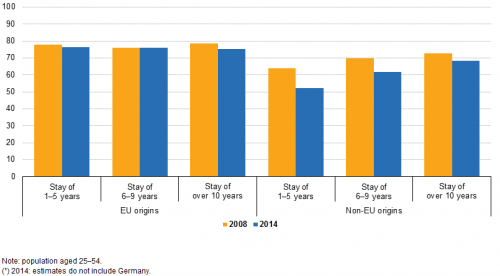
In 2014, the employment rates of those with ‘non-EU origins’ increased with the length of their duration of stay, from 51.1 % for those having been in the country for less than 5 years to 68.3 % for those that already resided for more than 10 years. This was not the case for immigrants born in another EU country, as their employment rates varied very little (around 76 %) when analysed based on duration of stay.
From 2008 to 2014, the unemployment rates increased for all the migration statuses analysed, and for both 15–29 and 25–54 age groups. The intensity of the increase was generally stronger for the youth category (for which the unemployment rates almost doubled for some categories) and for those immigrants born outside the EU. Consequently, in 2014 the unemployment rate of first-generation immigrants with non-EU origins reached over 28 % for those aged 15–29 and 17.2 % for the 25–54 age group.
Looking at the evolution of unemployment rates over time for specific groups, it appears that, except for second-generation immigrants, women tended to have slightly higher unemployment rates in 2014 as well. Also, the unemployment rates of those with a low level of education also rose more steeply (from 6.3 to 10.7 pp, compared with 4.2 pp at most for the high skilled). On the other hand, regardless of the level of education it was the immigrants born outside of the EU who registered the highest absolute increases in their unemployment rates, while natives born with native background were also hit quite hard.
Activity rates
Activity rates of immigrants of ‘non-EU origins’ slightly decreasing, while slightly increasing for the rest of the population
The activity rate of a given population represents the percentage of the active population (employed or unemployed) in relation to the comparable total population in the same age group. For the population aged 25–54, the activity rate in 2014 was 86.2 % for the ‘native-born with a native background’ or 0.7 pp higher than in 2008 (see Figure 2). Similar activity rates were found amongst ‘second-generation immigrants’ with ‘EU origins’ (recording a slightly higher activity rate of 87.4 %) and ‘first-generation immigrants’ with ‘EU origins’ (85.6 %). For both, increases were recorded from 2008 to 2014 (of + 0.4 and + 1.8 pp respectively).
On the other hand, activity rates of the ‘non-EU’ migrant groups were significantly below the figures for the ‘native-born with a native background’ (8.4 pp lower for the immigrants born in a non-EU country and 2.9 pp for ‘second-generation immigrants’ with ‘non-EU origins’). But, while foreign-born residents of non-EU origin registered a decrease between 2008 and 2014 (– 0.8 ), the native-born residents of non-EU origin registered an increase (+  1.7 pp).
Gender gap in activity rates smallest for ‘second-generation immigrants’ with ‘EU origins’
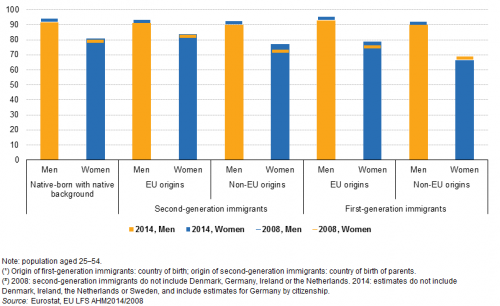
When analysing the two genders separately, in 2014 the activity rates of males aged 25–54 stood at more than 90 % for all the groups analysed, ranging from 90 % for both ‘first’ and ‘second-generation immigrants’ with ‘non-EU origins’ to 93 % for ‘first-generation immigrants’ with ‘EU origins’. The activity rate of those ‘native-born with a native background’ was in between, at 91.7 %. Overall for males there was a slight decrease compared to 2008, which impacted ‘second-generation immigrants’ the strongest in absolute terms (– 0.9 pp).
The labour market participation of women, on the other hand, although higher than in 2008 for all categories except first-generation immigrants born outside the EU, was still much lower than that of men in 2014 for all the migration statuses analysed. Specifically in 2014 this gap ranged from 7.5 pp for ‘second-generation immigrants’ with ‘EU origins’ to 23.4 pp for ‘first-generation immigrants’ with ‘non-EU origins’. The percentage of women in the latter category active on the labour market stood at 66.5 % in 2014 (down from 67.2 % in 2008), compared with 79 % for the women born in another EU country and 80.7 % of the ‘native-born with a native background’.
Another interesting feature when analysing the activity rates by migration status and gender is that activity rates slightly decreased for men across all the migration statuses, while in the case of women significant increases (above 1.9 pp) were recorded in all statuses except the ‘first-generation’ with non-EU background.
The activity rates were the lowest amongst low skilled immigrants with ‘non-EU origins’
Education is another factor that can influence labour status. Figure 4 presents a comparison between those with lower secondary education at most which is considered ‘low’ [1] (corresponding to levels 0–2 of the International standard classification of education — ISCED) and those with tertiary education (ISCED 5–8), which is deemed ‘high’ [2]. These two categories are crossed with migration status and the subsequent activity rates analysed.
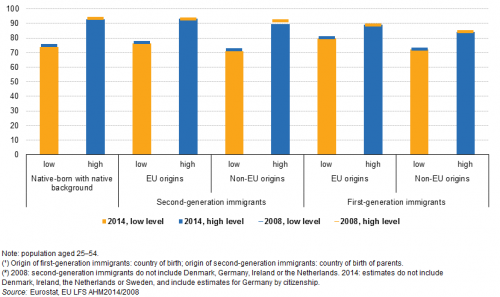
In 2014, the activity rates of those with tertiary education stood at around 90 %, while they were lower for ‘first-generation immigrants’ with ‘non-EU origins’ (84.2 %). As the previous analysis shows, this was mostly due to the extremely low labour market participation of females born in a country outside of the EU.
On the other hand, the activity rate of those with a ‘low’ level of education was lower overall than of those with a ‘high’ level of education, with gaps that varied from 18.9 pp (for ‘native-born with a native background’) to 9.4 pp (for ‘first-generation immigrants’ with ‘EU origins’). In 2014, the participation in the labour market of those having lower secondary education at most was highest for the immigrants with ‘EU origins’ (79.8 % for ‘first-generation’ and 76.5 % for ‘second-generation’) and lowest for the immigrants with ‘non-EU origins’ (72.1 % for the ‘first generation’ and 71.1 % for the ‘second generation’).
Compared with 2008, there was an overall slight increase in activity rates for all groups except ‘second-generation immigrants’ with ‘non-EU origins’ (– 1.8 pp in the ‘high’ group and – 0.6 pp in the ‘low’ group) and ‘native-born with native background’ (– 0.4 pp), regardless of level of education. For the other migration statuses, the strongest increases of the activity rates were recorded in two groups with ‘high’ educational attainment: ‘second-generation immigrants’ with ‘EU origins’ (+ 0.9 pp) and ‘first-generation immigrants’ with ‘EU origins’ (+ 0.8 pp).
Activity rate gap between ‘second-generation immigrants’ and ‘native-born with native background’ very small in half of the EU countries and the EU as a whole
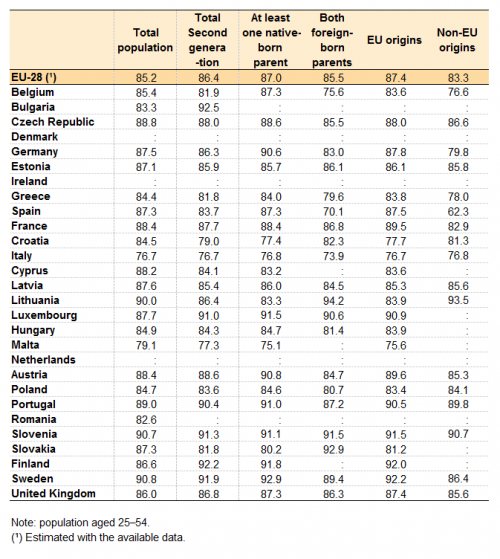
As comparative information regarding the activity rates of ‘native-born with native background’ and of residents born abroad (‘first-generation immigrants’) already exists, albeit for the age group 20–64, Table 1 presents complementary statistics by Member State of the activity rates for ‘second-generation immigrants’. The statistics are broken down by country of origin of the parents (‘at least one native-born parent’ and ‘both foreign-born parents’) and separately by identifying those with ‘EU origins’ from those with ‘non-EU origins’. However, it must be kept in mind when analysing this data that the total size of the population who have at least one parent born abroad varies at country level, ranging from 23.3 % in Estonia to 0.1 % in Romania, as the migratory phenomenon is not relevant for all the EU countries.
(%)
Source: Eurostat (lfso_14lactr) and (lfso_08cobsp)
In 2014, the highest activity rates for ‘second-generation immigrants’ aged 25–54 were found in Bulgaria (92.5 %), Finland (92.2 %) and Sweden (91.9 %) (see Table 1) while the lowest shares of active population within ‘second-generation immigrants’ were found in Italy (76.7 %) and Malta (77.3 %). In most cases, those with a mixed background (one parent born in the respondent country) recorded a higher activity rate compared with those with both parents born abroad. The exceptions to this are Croatia, Slovakia, Slovenia, Estonia and Lithuania, for which being foreign-born may have a different meaning, as their country borders were different at the time the parents of the respondents were born compared with current borders [3]. The activity rate of ‘second-generation immigrants’ with ‘at least one parent born in the EU’ was in most cases higher than for those with both parents born outside of the EU, with the exception of Croatia, Latvia and Lithuania (which are special cases as noted above), Italy and Poland. In eight of the countries for which data was available (Bulgaria, Luxembourg, Austria, Portugal, Slovenia, Finland, Sweden, and the United Kingdom) the activity rates for ‘second-generation immigrants’ was higher than for the total population aged 25–54. The differences ranged from 9.2 pp in Bulgaria, 5.6 pp in Finland and 3.3 pp in Luxembourg to 0.2 pp in Austria and 0.6 pp in Slovenia. In 2014, activity rates were at least 4.0 pp higher in the total population than in the ‘second-generation of immigrants’ in Slovakia, Croatia and Cyprus. In roughly half of the countries and the EU as a whole, the difference between the activity rates of the total population and ‘second-generation immigrants’ stood at 1.2 pp or lower.
Employment
Immigrants with ‘non-EU origins’ mostly affected by decrease in employment rates
In 2014, an estimated 81.1 % of the active population aged 25–54 belonging to ‘second-generation immigrants’ with ‘at least one parent born in the EU’ was employed (see Figure 5). This employment rate was 2.5 pp above the rate presented by the ‘native-born with a native background’ and 15.6 % higher than the employment rate of ‘first-generation immigrants’ with ‘non-EU origins’. Immigrants with ‘EU origins’ presented higher employment rates than immigrants with ‘non-EU origins’ in both the first (11.6 pp difference) and second-generation (7.1 pp more) groups.
Between 2008 and 2014, the ranking did not change among the various migration statuses and origins, and the overall EU employment rate decreased in all groups, except for second generation of non-EU origin with an increase of +0.7 pp. The decrease magnitudes were specific to ‘first-generation immigrants’ of 'non-EU' origin (– 4.7 pp). The decrease in employment rates was less apparent within the migrant groups with ‘EU origins’ (less than 1.0 pp), while the ‘native-born with native background’ experienced a 2.2 pp drop between 2008 and 2014.
‘First-generation immigrants’ with ‘EU origins’ registered the highest employment rate in 2014
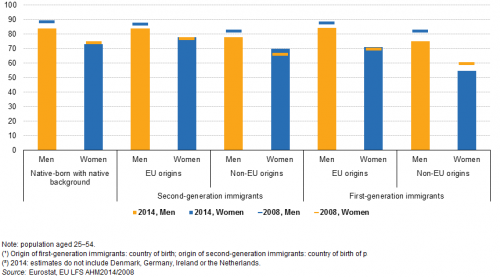
Looking at the gender breakdown of EU-level employment rates by migration status, in 2014 among the male population the highest employments rates were found in the ‘first-generation immigrants’ with ‘EU origins’ (84.2 %), slightly above the rate for the ‘native men with native background’ (83.9 %). The ‘first-generation immigrants’ with ‘non-EU origins’ had the lowest employment rate (75.1 %, which represents a 9.1 pp difference compared to the ‘first-generation immigrants with ‘EU origins’).
Overall, the employment rates for women were significantly lower than that of males. Especially females with ‘non-EU’ migration background were much less likely to be employed, as only 54.5 % of those in the ‘first generation’ and 69.8 % of those in the ‘second generation’ held this labour status in 2014. On the other hand, ‘second-generation immigrants’ with ‘EU origins’ had a higher employment rate than the female population with native background (77.8 % compared with 73.3 %), while the migrant women born in another EU country were not lagging too far behind (71.1 %).
Regarding the gender gap, the male employment rate of ‘second-generation immigrants’ with ‘EU origins’ was only 6.0 pp higher than that for women of the same migration status. This gender gap was lower than the one for the ‘native-born with native background’ (10.7 pp) and was less than one third of the gap presented by ‘first-generation immigrants’ with ‘non-EU origins’ (20.5 pp).
From 2008 to 2014 there was a decrease in the gender gap within the employment rates of all the migration statuses, which resulted in most cases from steeper reductions of the male employment rates. The highest relative reductions of the gender gap were found amongst both groups of ‘second-generation immigrants’: the gender gap was reduced from 9.9 pp to 6.0 pp for ‘second-generation immigrants’ with ‘EU origins’ and from 16.0 pp to 7.9 pp for ‘second-generation immigrants’ with ‘non-EU origins’.
As in the case of the activity rates, the employment rates decreased significantly for all male migration statuses between 2008 and 2014 (ranging from 3.8 pp for both ‘first’ and ‘second-generation immigrants’ with ‘non-EU origins’ to 2.7 pp for ‘second-generation immigrants’ with ‘EU origins’). Amongst women this was generally not the case, except for foreign-born females with ‘non-EU origins’, where there was a 4.7 pp decrease. On contrary, for native-born females with 'non-EU' origin an increases was noted, namely of 4.2 pp.
A decrease in employment rates was observed across most migration statuses and educational levels groups
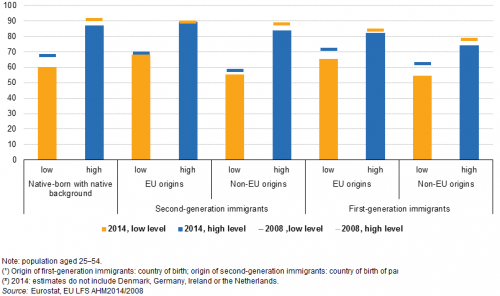
When looking at trends in the employment rates of those 25–54 by educational attainment (see Figure 7), all groups experienced decreases in employment rates between 2008 and 2014, with the exception of ‘second-generation immigrants’ with ‘EU origins’ with a ‘high’ level of educational attainment (for which there was an increase of 0.5 pp). Those with a non-EU migration background and a ‘low’ level of education registered sharp decreases in their already low employment rates (of 7.4 pp for the ‘first generation’ and 7.1 for the ‘native-born’ with 'native background'). The decreases were more moderate for those with a higher level of education, ranging from 3.8 pp in the case of ‘second-generation immigrants’ with ‘non-EU origins’ to 1.5 pp for ‘first-generation immigrants’ with ‘EU origins’. The impact of the global financial and economic crisis was strongest on the immigrants with ‘non-EU origins’ and lowest on those with ‘EU origins’.
These findings can be translated into increases in the gap between those with ‘low’ and ‘high’ educational attainment levels in most migration statuses (except the ‘second-generation immigrants’ with ‘EU origins’), confirming the main tendency of greater employability within the population pursuing higher academic education.
In 2014, the employment rates of the population 25–54 with ‘low’ educational attainment varied from 54.6 % to 55.5 % in ‘first’ and ‘second-generation immigrants’ of ‘non-EU origins’ to 65.5 % to 68.2 % in ‘first’ and ‘second-generation immigrants with ‘EU origins’. The employment rate of ‘native-born with native background’ with at most lower secondary education completed stood between that of immigrants with ‘EU origins’ and ‘non-EU origins’ (60.1 %). In the case of the highly qualified, employment rates were higher than 85 % for ‘second-generation immigrants’ with ‘EU origins’ and ‘native-born with native background’ (89.4 % and 87.1 % respectively) and lower than 75 % for those born in a non-EU country (namely 74.3 %).
The highest employment rate within ‘second-generation immigrants’ was observed in Luxembourg
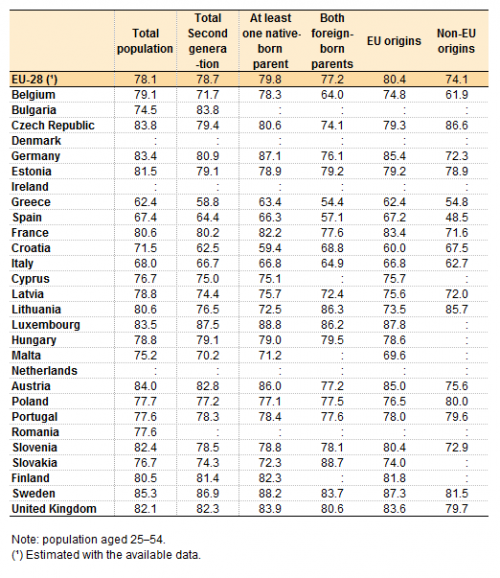
Table 2 presents employment rates of ‘second-generation immigrants’ by Member State, broken down by broad categories of country of birth and origin of their parents, following the same classification used in Table 1. Taking into account the data availability, Luxembourg (87.5 %) and Sweden (86.9 %) presented the highest overall employment rates for ‘second-generation immigrants’ in 2014, while Greece and Croatia presented the lowest employment rates among this group (58.8 % and 62.5 %, respectively).
(%)
Source: Eurostat (lfso_14lempr) and (lfso_08cobsp)
As was the case for activity rates, in the EU-28 as a whole, employment rates were higher for ‘second-generation immigrants’ (78.7 %) than for the total population (77.3 %), but this situation differed among the EU Member States. In seven Member States the general EU trend was followed, with Bulgaria, Luxembourg, Sweden, Finland, Portugal Hungary, and the United Kingdom presenting higher ‘second-generation immigrant’ employment rates than in the total population.
The differences mentioned above varied from 9.3 pp in Bulgaria and 4.0 pp in Luxembourg to 0.3 pp in Hungary and 0.2 pp in the United Kingdom. In all other Member States where data is available the contrary occurred: Croatia (– 9.0 pp) and Belgium (– 7.4 pp) presented the biggest differences with higher national employment rates in this age group than the employment rates of their ‘second-generation immigrants’.
For the majority of Member States (17 out of 23) for which data are available, the group of ‘second-generation immigrants’ with ‘at least one native-born parent’ had higher employment rates than in the case of ‘second-generation immigrants’ with ‘both foreign-born parents’. The exceptions were Estonia, Croatia, Lithuania, Hungary and Slovakia and, as mentioned for Table 1, being foreign-born may have a different meaning, as country borders were changing in their case. If we look into the difference by breakdown of immigrants by ‘EU origins’ and ‘non-EU origins’, there were four outliers: the Czech Republic, Lithuania, Poland and Portugal which presented higher employment rates among the group of ‘second-generation immigrants’ with ‘non-EU origins’.
The employment rates of ‘first-generation immigrants’ with ‘non-EU origins’ increased substantially with their duration of stay
Figure 8 presents the employment rates of first-generation immigrants by the duration of their stay in the resident country and also their ‘EU’ or ‘non-EU origins’. In 2014, the employment rates of ‘first-generation immigrants’ with ‘non-EU origins’ increased substantially with their duration of stay, from 52.1 % for those having been in the country for less than 5 years to 68.3 % for those that already resided for more than 10 years. This was not the case for immigrants born in another EU country, as their employment rates were relatively stable (from 75.6 % to 76.3 %) and did not vary much based on their duration of stay. The same patterns can also be observed for the year 2008. In terms of trends, an overall decrease in the employment rates between 2008 and 2014 can be noted for all the groups analysed, but it was particularly steep for immigrants with ‘non-EU origins’. The magnitude of the decrease lowers with the time spent in the resident country, as it ranges from – 12.0 pp for the most recently settled (less than 5 years) to – 4.6 pp for the ones that have spent more than 10 years in the host country. Comparatively, for the intra-EU immigrants the impact varied between – 3.1 pp for the most settled immigrants (more than 10 years) to only 0.2 pp for those having spent between 6 and 9 years in the host country.
Employment rates were highest among economic immigrants
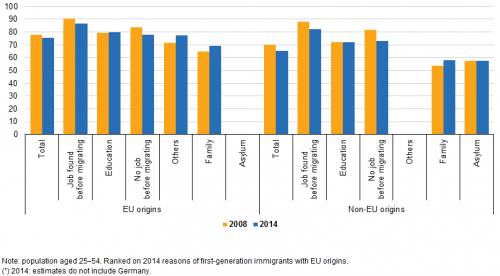
When addressing the employment rates of ‘first-generation immigrants’ by reason for migration, the trends seem similar between those with ‘EU origins’ and ‘non-EU origins’ (see Figure 9), although the rates were always higher for those with ‘EU origins’, regardless of the reason for migration. The ranking of the various reasons was similar, with the highest employment rates pertaining to the groups of immigrants having ‘found a job prior to migrating’ (90.3 % for those with ‘EU origins’ and, 87.8 % for those with ‘non-EU origins’). Of course, the gap was smaller for those who migrated for work-related reasons than for those who migrated for ‘family’ reunification (around 4.0 pp compared with 11.3 pp). In terms of trends, an overall decrease in employment rates was apparent, regardless of the reason for migration (ranging from 8.8 pp for immigrants with ‘non-EU origins’ who came for work, but had ‘no job before migrating’ to stable figures for those who initially arrived for completing their ‘education’), with the exception of those migrating for the purpose of ‘family’ reunification. Immigrants with both ‘EU origins’ and ‘non-EU origins’ arriving for ‘family’ reasons registered an increase in employment rates of about 4.1 to 4.5 pp from 2008 to 2014. Also in the case of those who migrated for international protection and ‘asylum’ seeking, the employment rate did not change between 2008 and 2014, remaining at around 57.6 %.
Highest employment rates for ‘first-generation immigrants’ in Luxembourg and Lithuania
Zooming in further to Member State level, the employment rates of ‘first-generation immigrants’ aged 25–54 were above 80 % in Luxembourg, Lithuania and Latvia, and 60.5 % or lower in the case of Croatia, Spain and Greece (see Table 3). In terms of gaps when compared with the total population, in roughly half of the countries for which data are available the difference was smaller than 4 pp, being even smaller than 1 pp for Hungary and Cyprus and even positive in the special cases of Lithuania and Latvia. On the other hand, the gap was larger than 10 pp in 2014 in most countries with a significant population of immigrants (Belgium, France, Austria, Finland, Sweden and Croatia). In most countries the pattern identified at EU level was followed, as the ‘first-generation immigrants’ with ‘EU origins’ had significantly higher employment rates than those with ‘non-EU origins’. Also, the employment rate of those with ‘EU origins’ does not generally depend on their duration of stay, while for the immigrants with ‘non-EU origins’ the likelihood of being employed grows steadily and fast, together with the number of years spent in the host country.
There were also exceptions. For example, in the case of Finland, immigrants with ‘EU origins’ that had spent more time in the country had a significantly higher employment rate than those who had arrived less than 5 years before 2014. Likewise, in the case of immigrants with ‘non-EU origins’ in Cyprus, a reverse pattern can be observed, as those having spent less time in the country had a higher probability of being employed than long-time residents, while in Luxembourg and the United Kingdom relatively high employment rates were to be noted for all immigrant categories. However, extra care must be taken when analysing this data, as in some cases they refer to a relatively small percentage of the population in the respective countries, especially when the total share of immigrants in a country is rather low (e.g. 5 % or below).
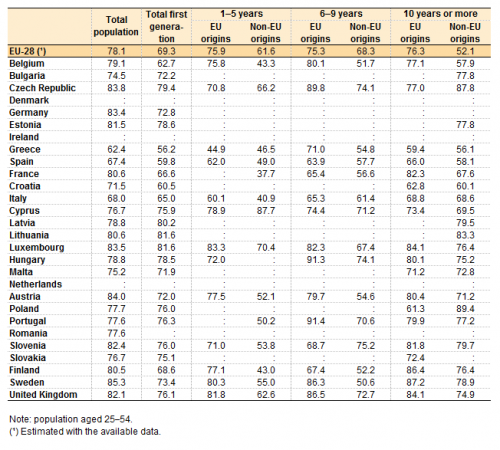
(%)
Source: Eurostat (lfso_14lempr) and (lfso_08cobsp)
Unemployment
Immigrants with non-EU origins most affected by the increase in unemployment rates
In 2014, the unemployment rates of the EU population aged 25–54 ranged from 17.2 % in the case of ‘first-generation immigrants’ with ‘non-EU origins’ to 7.6 % for ‘second-generation immigrants’ with ‘EU origins’ (see Figure 10). Unemployment rates were higher among both groups with ‘non-EU origins’ while the immigrants with ‘EU origins’ and the ‘native-born with native background’ presented unemployment rates below 10 %. Between 2008 and 2014, the unemployment rates increased for all categories. The steepest increase was observed for ‘first-generation immigrants’ with ‘non-EU origins’ (+ 6.6 pp), while ‘second-generation immigrants’ with ‘EU and non-EU origin’ taken separately only registered a 1.3 pp increase, the lowest among the migration statuses analysed. This small increase meant that in 2014 ‘second-generation immigrants’ with ‘EU origins’ had the smallest unemployment rate (7.6 %) while in 2008 the lowest rate belonged to the ‘native-born with a native background’ (5.5 %), indicating a stronger resilience of the first group in facing the global financial and economic crisis.
Unemployment rates of ‘second-generation immigrants’ were higher among men
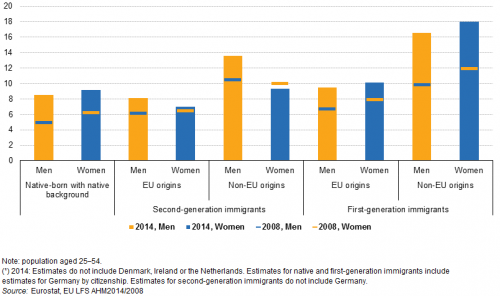
When analysing the unemployment rates by gender, the patterns match the general tendency of the total population aged 25–54, but the gender gaps tend to vary considerably among the several migration statuses. In 2014, the unemployment rates were higher among the female population aged 25–54 when compared with those of the male population in the case of the ‘native-born with a native background’ and of the two groups of ‘first-generation immigrants’ (with ‘EU origins’ and ‘non-EU origins’) (see Figure 11). Amongst ‘second-generation immigrants’, a smaller percentage of women were unemployed when compared to men in 2014. In the case of ‘second-generation immigrants’ with ‘non-EU origins’ the gender gap was the biggest (9.3 % for women compared with 13.5 % for men). In the case of ‘first-generation immigrants’ with ‘non-EU origins’ the difference between female and male unemployment was the opposite, with women having a higher rate (18.0 %) than men (16.6 %). The gap was also much smaller.
From 2008 to 2014, the increase in unemployment affected every category, but the intensity of the increase varied. The largest increases in female and male unemployment rates were among ‘first-generation immigrants’ with ‘non-EU origins’. In the case of men, the second largest increase (5.6 pp) was observed for ‘second-generation immigrants’ with ‘non-EU origins’. This group also presented the lowest increase in female unemployment (0.9 pp) which explains the large increase in the gender gap in this category. On the other hand, ‘second-generation immigrants’ with ‘EU origins’ was the group with the lowest increase in the share of male unemployed (1.9 pp), and the second lowest increase in the share of female unemployed (1.0 pp).
One in every four ‘first-generation immigrant’ with ‘non-EU origins’ with ‘low’ educational attainment was unemployed in 2014
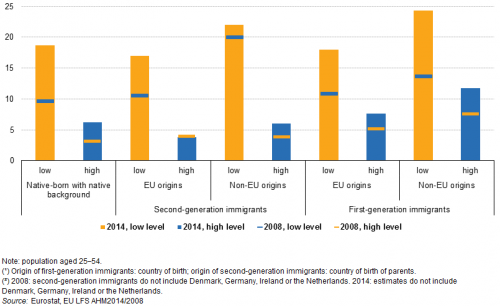
The level of educational attainment of the population has a large impact on unemployment rates, as can be seen from Figure 12. Regardless of migration status, the general trend was of higher unemployment rates within the population with ‘low’ educational attainment compared with those with tertiary education. In particular in 2014 the groups with ‘low’ educational qualifications had much higher unemployment rates compared with those having graduated from tertiary education, reaching as high as 24.3 % for the ‘low’-skilled ‘first-generation immigrants’ with ‘non-EU origins’ and as low as 3.8 % for the ‘high’-skilled ‘second-generation immigrants’ with ‘EU origins’. The size of the gap between the two categories (‘high’ and ‘low’) presented small variations among the various migration groups in 2014, ranging from 15.9 pp for ‘second-generation immigrants’ with ‘non-EU origins’ to 10.4 pp for ‘first-generation immigrants’ with ‘EU origins’.
In terms of trends, the impact of the global financial and economic crisis was stronger for the low-skilled population. Their already high unemployment rates rose even further, between 6.5 pp and 10.7 pp, compared with a maximum of 4.2 pp for the ‘high’-skilled and reaching values of over 17 % for all the migration groups with a ‘low’ level of education. Also, ‘first-generation immigrants’ with ‘non-EU origins’ were the category most strongly impacted, as they registered the highest increases in unemployment rates for both the ‘low’- and the ‘high’-skilled (10.7 pp and 4.2 pp respectively).
Youth unemployment highest among non-EU immigrants
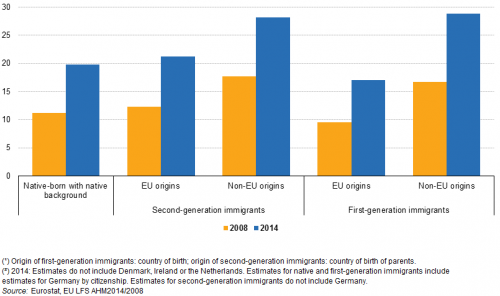
Looking at the unemployment rates of the population aged 15–29, the patterns were very similar to the ones of the older age group (25–54), and the discrepancy was strongest among the young cohort. In fact the unemployment rate in the 15–29 age class was more than double the rate of the 25–54 age group for the ‘native-born with a native background’ (19.8 % compared with 8.8 %) and also for ‘second-generation immigrants’ in 2014. It was higher than 17 % for all migration statuses, reaching as high as 28.9 % for immigrants with ‘non-EU origins’. Another general characteristic of youth unemployment, observed in all migration statuses, was the steeper increase of the unemployment rates between 2008 and 2014, as the unemployment rate almost doubled for this age group, while it was slightly more moderated for those aged 25–54. On the other hand, a similar trend as for those aged 25–54 was observed, as the highest increases in the unemployment rates were noted for immigrants with ‘non-EU origins’, regardless of the generation (of around 10.5 pp to 1.2 pp).
Highest unemployment rates for ‘second-generation immigrants’ in Greece, Spain and Croatia
Table 4 compares the unemployment rates of ‘second-generation immigrants’ aged 25–54 by Member State, categorised by their parents’ country of birth and origins (as in Tables 1 and 2). Overall in 2014, the unemployment rate of ‘second-generation immigrants’ was 3.9 pp lower than that of the total population at EU level (12.8 %) estimated with the available data. At Member State level, in a quarter of the countries for which data is available, ‘second-generation immigrants’ had lower unemployment rates compared with the total population (Germany, Slovakia, Cyprus, Poland and Sweden), while in the other countries it was the opposite (with the biggest differences observed in Croatia, Belgium and Slovenia). Greece, Spain and Croatia presented unemployment rates above 20 % among ‘second-generation immigrants’ (28.1 %, 23.1 % and 20.8 % respectively). Comparing the different groups of ‘second-generation immigrants’, at EU level the unemployment rates of those with both ‘foreign-born parents’ were higher than for those with mixed origins (9.7 % as opposed to 8.3 %), while the ‘non-EU origins’ group registered shares of unemployed above those of the ‘EU origins’ group (11.4 % and 8 % respectively). These patterns were also repeated at Member State level, with a few exceptions (mostly Spain and Croatia, for which the opposite patterns can be noted).
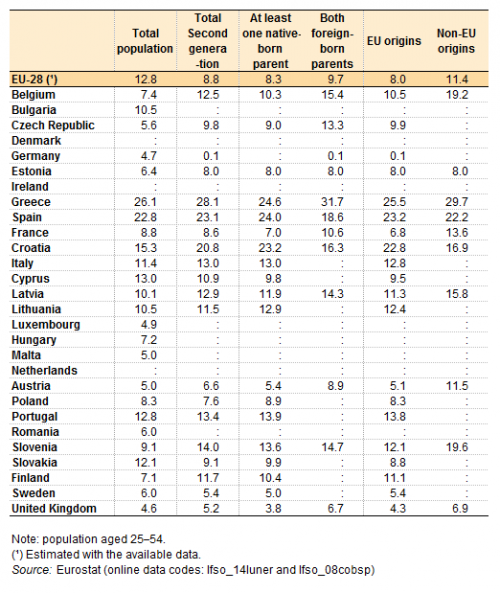
(%)
Source: Eurostat (lfso_14luner) and (lfso_08cobsp)
Source data for tables and graphs
Data sources
The Labour Force Survey (LFS) is the largest household sample survey carried out in the EU-28 which provides detailed quarterly and annual data on employment, unemployment and economic inactivity of persons aged 15 and over. Within the set of core variables (collected at least once a year), the LFS includes every year a set of different supplementary variables that constitute an ad hoc module (AHM) on a specific labour market issue.
2008 LFS Ad-hoc module
In the 2008 the topic of the LFS Ad-hoc module was the ‘Labour market situation of immigrants and their immediate descendants’, and it contained a list of 11 variables defined in Regulation (EC) No 102/2007. It was carried out by all EU Member States as well as Norway and Switzerland. The data that were collected within this module included the country of birth of the father and of the mother, allowing second-generation immigrants to be identified. In addition, information was collected on the main reason for migration, legal barriers on access to the labour market, qualifications and language issues.
The module consists of 11 variables. However since there were several Member States with small populations of immigrants (see Migration and migrant population statistics) it was decided that for 13 Member States the last seven variables were optional. This concerned the following countries: Bulgaria, the Czech Republic, Denmark, Estonia, Latvia, Lithuania, Hungary, Malta, Poland, Romania, Slovenia, Slovakia and Finland.
The target population of the AHM were all persons aged 15 to 74 (although in the present article the analysis was centred on the 25–54 age group). Data for France did not include the overseas departments (DOM). The data on educational attainment used the ISCED 1997 classification.
2014 LFS Ad-hoc module
Seven years later a second ad hoc module on the ‘Labour market situation of immigrants and their immediate descendants’ was carried out. It aimed at comparing the situation on the labour market for ‘first-generation immigrants’, ‘second-generation immigrants’ and ‘native-born’, and further analysed the factors affecting the integration in and adaptation to the labour market.
The target population changed from 15–74 in 2008 to 15–64 in 2014, as there was a lot of missing information for the older respondents in 2008. The module was not collected by Denmark, Ireland, the Netherlands and Germany (although some aggregate estimations are available for the latter based on a different data source). ‘Country of birth of father’, ‘country of birth of mother’ and also ‘main reason for migration’ were variables present in both years, allowing some comparisons within both data sets, taking into account the limitations caused by the difference in coverage and methodologies mentioned above.
For the purpose of this publication, in some cases, variables from the core LFS were used to obtain comparable data. Aggregate figures for the EU level are calculated by averaging the available national figures, without imputing the missing countries (Denmark, Ireland, the Netherlands and in some cases Germany).
Activity, employment and unemployment rates
Please see the methodology page of the LFS for full definitions of the rates.
For more information on each of the ad hoc modules please see section methodology/metadata.
Context
There is high political and scientific interest in comparative information on the labour market situation of immigrants. This set of comprehensive and comparable data on the labour market situation of immigrants and their immediate descendants is aimed at monitoring progress on the labour market situation of immigrants, to analyse the factors affecting their integration and adaptation to the labour market. The policy background for the AHM 2014 can be traced on the following EU documents:
- The Zaragoza Declaration, adopted in April 2010 by EU Ministers responsible for immigrant integration issues, and approved at the Justice and Home Affairs Council on 3–4 June 2010. It calls upon the Commission (Eurostat and DG HOME) to do a pilot study in order to study common integration indicators, from harmonised data sources.
- ‘EUROPE 2020: A strategy for smart, sustainable and inclusive growth’, outlining three mutually reinforcing objectives of smart, sustainable, and inclusive growth. It has a strong focus on employment, stressing the need for increasing labour market participation, with more and better jobs as essential elements of Europe’s socio economic model.
- The Commission Communication of 20 July 2011Commission Communication of 20 July 2011 on the ‘European Agenda for the Integration of Third Country Nationals’, which focuses on enhancing the economic, social and cultural benefits of migration in Europe and on achieving immigrants’ full participation in all aspects of collective life.
- The Commission Communication of 18 November 2011 on ‘The Global Approach to Migration and Mobility’, which sets out the Commission’s adapted policy framework on migration as part of a renewed Global Approach to Migration and Mobility (GAMM).
Direct access to
- Migrant integration statistics – labour market indicators
- Migration and migrant population statistics
- Acquisition of citizenship statistics
- Annual asylum statistics
- Migrant integration statistics introduced
- Population and population change statistics
- Residence permits - statistics on first permits issued during the year
- Statistics for European policies and high-priority initiatives
- Labour market (labour)
- Employment and unemployment (Labour Force Survey) (employ)
- LFS ad-hoc modules (lfso)
- 2014. Migration and labour market (lfso_14)
- 2008. Labour market situation of immigrants (lfso_08)
- LFS ad-hoc modules (lfso)
- Employment and unemployment (Labour Force Survey) (employ)
- Immigrants in Europe — A statistical portrait of the first and second-generation
- Foreign citizens accounted for fewer than 7 % of persons living in the EU Member States in 2014 — News release 12/2015
- EU Member states granted citizenship to more than 800 000 persons in 2010 — Statistics in focus 45/2012
- Nearly two-thirds of the foreigners living in EU Member States are citizens of countries outside the EU-27 — Statistics in focus 31/2012
- 6.5 % of the EU population are foreigners and 9.4 % are born abroad — Statistics in focus 34/2011
- Acquisitions of citizenship on the rise in 2009 — Statistics in focus 24/2011
- Demographic Outlook — 2010 edition
- Immigration to EU Member States down by 6 % and emigration up by 13 % in 2008 — Statistics in focus 1/2011
- Population grows in twenty EU Member States — Statistics in focus 38/2011
The data collected by Eurostat comes from the 2014 Labour Force Survey (LFS) ad-hoc module on the ‘Labour market situation of immigrants and their immediate descendants’. The previous 2008 LFS Ad-hoc module on the ‘Labour market situation of immigrants’ was also used to compare the data overtime. All EU averages for 2014 do not include data for Denmark, Ireland and the Netherlands, as these countries did not collect the Ad-hoc module, while some of the figures also exclude data for Germany. This difference in coverage, but also other methodological dissimilarities between the two data collections are to be taken into account when comparing 2008 and 2014 data.
The population is divided into three main ‘migration status’ groups, based on country of birth of the respondent and of their parents:
- ‘Native-born with native background’;
- ‘Second-generation immigrants’ (native-born population with at least one foreign-born parent);
- ‘First-generation immigrants’ (foreign-born population).
In the case of the ‘second-generation immigrant’ population a further breakdown by whether both parents are born abroad (‘second-generation foreigners’) or only one of them (‘mixed second-generation’) is provided.
For migrant population we further looked into their ‘EU’ or ‘non-EU origins’. Thus, the population of ‘first-generation immigrants’ is divided according to country of birth of respondent into ‘first-generation immigrants’ born in another EU country (i.e. ‘EU origins’) and ‘first-generation immigrants’ born outside the EU (i.e. ‘non-EU origins’). For the population of ‘second-generation immigrants’, as they all are born in the reporting country that automatically belongs to the EU, their origins are based on country of birth of their parents. Thus, the group has been split into ‘second-generation immigrants’ with ‘EU origins’ (at least one parent is born in the EU, including in the reporting country) and ‘second-generation immigrants’ of ‘non-EU origins’ (both parents are born outside the EU) (see Figure 1).
The main focus of the article is to compare labour market outcomes for the five sub-groups resulting from these divisions (see Figure 1):
- native-born with native background;
- second-generation immigrants of EU origins;
- second-generation immigrants of non-EU origins;
- first-generation immigrants born in another EU country;
- first-generation immigrants born outside of the EU.
The analysis focuses on the 25–54 age group, with the aim of excluding migration related to non-economic reasons such as study and retirement. This also reduces the effect of different age structures of the three main migration status groups. In the particular case of unemployment, the age group 15–29 is also taken into account given the significance of this indicator for the young active population. The analysis includes the three main labour market indicators (employment rate, activity rate and unemployment rate) and also contains breakdowns by gender and educational attainment.
- Detailed information on the Ad-hoc modules area available in the following links:
- 2008 LFS Ad-hoc Module (ESMS metadata file — lfso_08_esms)
- 2014 LFS Ad-hoc Module (ESMS metadata file — lfso_14_esms)
- COM (2004) 811 Green Paper on an EU approach to managing economic migration
- COM (2005) 669 Communication from the Commission — Policy Plan on Legal Migration
- Summaries of EU Legislation: Policy plan on legal migration
- COM (2006) 402 Communication from the Commission on Policy priorities in the fight against illegal immigration of third-country nationals
- Summaries of EU Legislation: Policy priorities in the fight against illegal immigration
- COM (2007) 512 Communication from the Commission — Third Annual Report on Migration and Integration
- COM (2008) 611 Communication from the Commission — Strengthening the global approach to migration: increasing coordination, coherence and synergies
- Summaries of EU Legislation: Strengthening the Global Approach to Migration
- COM (2010) 171 Communication from the Commission — Delivering an area of freedom, security and justice for Europe's citizens — Action Plan Implementing the Stockholm Programme
- Summaries of EU Legislation: Action plan on the Stockholm Programme
Notes
- ↑ ISCED levels 0 (early childhood education), level 1 (primary education) or level 2 (lower secondary education).
- ↑ ISCED level 5 (short-cycle tertiary education), level 6 (Bachelor’s or equivalent level), level 7 (Master’s or equivalent level) or level 8 (Doctoral or equivalent level).
- ↑ Information on the country of birth should be obtained according to the current national boundaries and not according to the boundaries in place at the time of birth. Therefore, a person currently residing in Slovakia being born in the Czech Republic at the time the two were forming a single country is still considered as born abroad.
