Applying the degree of urbanisation manual - Which spatial units to use and adjustments to address geographic issues
8. Which spatial units to use and adjustments to address geographic issues
This article forms part of an online methodological manual, Applying the Degree of Urbanisation – A methodological manual to define cities, towns and rural areas for international comparisons: 2021 edition.
Full article
8.1 Which small spatial units to use?
The population grid helps to address what is referred to as the modifiable areal unit problem [1]. However, when these grid concepts are used to classify small spatial units, the problem that different shapes and sizes of spatial units will lead to different results reappears.
The general recommendation is to use the smallest spatial unit for which regular data can be produced to compile statistics by degree of urbanisation. It is not necessary to be able to produce reliable data for each individual small spatial unit, rather the goal is to compile statistics for the aggregation of these spatial units by degree of urbanisation. Household sample surveys, for example, cannot produce data for all small administrative or statistical spatial units, but if respondents are coded by these spatial units, the results of the survey can subsequently be aggregated to compile statistics by degree of urbanisation.
Many countries have more than one local administrative level and more than one potential type of statistical area that might be chosen as the small spatial units to delineate cities and functional urban areas. Smaller spatial units will normally lead to a closer match between an urban centre and a city. However, national statistical authorities may not be able to provide annual data for many indicators at such a detailed level. Furthermore, smaller spatial units, such as wards or districts, may not have as strong a political role as larger spatial units (such as municipalities).
This section describes some of the issues a national statistical authority may encounter when classifying spatial units by degree of urbanisation and proposes a range of options for how they may be addressed.
8.1.1 Large spatial units may lead to the over-, under- or non-representation of an urban centre by a city
The population of an urban centre and that of a city can differ by a considerable amount if a country has relatively large spatial units. Below are three types of issues that may potentially arise when using relatively large spatial units to define a city.
Overrepresentation
A city can have almost double the population of an urban centre. For example, an urban centre of 50 001 inhabitants in a spatial unit of 100 000 would mean that this spatial unit will be defined as a city (see Subchapter 7.1.4). This is a tricky problem to solve as the only alternative to the overrepresentation is non-representation, in other words, by not defining this spatial unit as a city.
Underrepresentation
A city can also have a much smaller population than the urban centre it represents. Take for example, an urban centre of 200 000 inhabitants that is split across four spatial units. One spatial unit (A) has a population of 50 000 and all of its inhabitants live in the urban centre. The other three spatial units (B, C, D) each have a population of 150 000 inhabitants of which respectively 60 000, 50 000 and 40 000 live in that urban centre. As a result, the city will consist of just the one spatial unit (A) with a population of 50 000 inhabitants and not the other three spatial units (B, C or D).
This underrepresentation can be reduced by adding the spatial unit with the highest share of its population in that urban centre to the city (spatial unit B with 60 000 of its 150 000 inhabitants in the urban centre). This would bring the population of the city up to 200 000 inhabitants, of which 110 000 would be living in the urban centre.
Non-representation
The most extreme form of under-representation is non-representation. For example, a spatial unit with a population of 200 000 inhabitants with a single urban centre of 75 000 inhabitants will not be classified as city. As a result, this urban centre will not be represented by a city, in other words, non-representation, something which is more likely to happen for small urban centres.
In a country where all the spatial units are relatively large, it is likely that not all of the small urban centres will be represented by cities. This would create a quite skewed representation of urban centres as all small urban centres would be missing. One option to address this problem is that for half of the small urban centres without a city, their spatial unit is classified as a city even though their share of population in an urban centre is less than 50 %.
8.1.2 Small spatial units may lead to a loss of the link to local government or to less statistical data
In a country with relatively large spatial units, most cities will consist of a single spatial unit. As a result, each city will have a single local government. This makes it easier to communicate indicators to local politicians/representative groups and helps to ensure good inputs for policymaking.
In countries with relatively small spatial units, most cities will consist of multiple spatial units. These small spatial units will ensure that there is a close match between the population in the urban centre and the population in the city. The trade-off is that the city will not match a single local government, which makes it more complicated to communicate data to local politicians/representative groups.
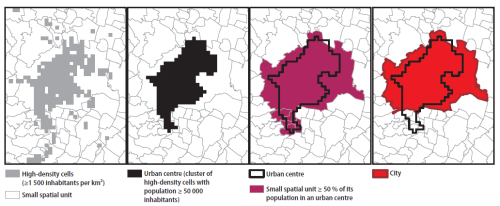
This effect can be shown in Portugal, which has both municipalities (municipio or concelho) and parishes (freguesia). If the urban centre of Braga in Figure 8.1 is used to define the municipal level (left panel), there is a simple one-to-one relationship; the local government of Braga is organised at the municipal level. If the urban centre is used to define a city at the parish level (right panel), the relationship becomes a more complicated one-to-many relationship; the simple link with the local government of Braga is also lost.
When statistical areas are used as building blocks to define a city and/or a functional urban area, the latter can be adapted ex post to the closest local administrative units. For example, cities and their commuting zones in the United States have been delineated using census tracts as building block units, but subsequently adapted to the closest county boundaries, by including the counties where the share of population living in cities and functional urban areas was higher than 50 %.
The imperfect match between the cities and functional urban areas and their respective urban centres can be informative for policymakers. Administrative boundaries of cities often remain unchanged for decades, while cities can expand or shrink. Many OECD countries, following the urban expansion that occurred in the last few decades, have created new levels of government for large cities encompassing multiple spatial units. For example, France has created métropoles to help govern its 21 biggest cities.
8.1.3 Adjusting the city to ensure a better representation of the urban centre or a better link to local government
If a national statistical authority wishes to adjust the delineation of its cities to get a better link between a city and its urban centre or a city and its local government, it can add or drop a spatial unit as long as the two following rules are respected:
- Rule 1 – a spatial unit with less than 50 % of its population in an urban centre can be added to a city if at least 50 % of the population of this expanded city lives in an urban centre.
- Rule 2 – a spatial unit with at least 50 % of its population in an urban centre can be excluded from a city as long as at least 75 % of the population of that urban centre lives in a city after excluding the spatial unit.
These two rules were designed to provide statistical limits to these optional changes that can be made. Furthermore, national statistical authorities are encouraged to limit the number of adjustments that they make, as these may weaken the international comparability of results compiled according to the degree of urbanisation classification.
City adds a few spatial units
Returning to the example of Braga in Portugal: if the urban centre is used to define the city at the parish level, this city would only contain some of the parishes in the municipality of Braga. Defining Braga at the municipal level amounts to adding these surrounding parishes to the city. As still more than 50 % of the population of the municipality of Braga lives in the urban centre, this complies with rule 1; it also ensures a direct link to Braga’s local government.
City drops a few spatial units
An example of the application of rule 2 is presented for Vienna in Austria. A number of small spatial units just south of the city of Vienna have 50 % or more of their population in the urban centre of Vienna. As more than 75 % of the population of the urban centre lives in the city of Vienna, these smaller spatial units can be excluded without significantly compromising the comparability of the results (see Figure 8.2).
Cities without an urban centre
The definition that has been developed provides an estimate of the population of an urban centre. Two elements may reduce the accuracy of this estimate: (i) geographic features and (ii) the source of the population grid data.
The definition does not take into account the specific geography of a city. Some geographic features, such as steep slopes, cliffs or bodies of water may lead to an underestimation of the population of an urban centre. This affects in particular cities with a small centre.
The definition works best when a bottom-up grid (based on point data) or a high-resolution, hybrid grid (based on a mixture of points and smaller statistical areas) is available, which ensures that the density of the population (per km2) is very accurate. In countries where such a grid is not yet available, the population of a small spatial unit has to be disaggregated based on a given criterion, such as land use data in the case of the GHS-POP grid produced by the European Commission’s Joint Research Centre (JRC). This is called a top-down approach, which is generally less accurate. It tends to underestimate the population cells with a moderate to high-density and overestimate population in those grid cells with a low population density. Due to this imprecision, there remains a margin of error, especially for smaller centres.
Therefore, a national statistical authority may opt to classify a small spatial unit as a city when it lacks an urban centre of at least 50 000 inhabitants, but fulfils the following two conditions:
- the presence of an urban centre of at least 50 000 inhabitants, which the definition does not capture due to geographic features or population grid estimation techniques;
- the small spatial unit has a population of at least 50 000 inhabitants.
For example, a small spatial unit which has two clusters of high-density cells separated by a river or a bay which together have a collective population of at least 50 000 inhabitants can be argued to have an undetected urban centre. A small spatial unit with a high-density cluster of 49 000 inhabitants based on a top-down population grid can be argued to have an undetected urban centre (see Subchapter 8.2.1 for more details).
8.2 Adjustments to address specific geographic issues for the degree of urbanisation and functional urban area classifications
This section describes how the degree of urbanisation classification can be adjusted in the presence of certain geographic issues that may skew the results. These adjustments are optional. In most countries, the original classification without these adjustments will produce robust results.
8.2.1 Railways, highways, malls, office parks and factories
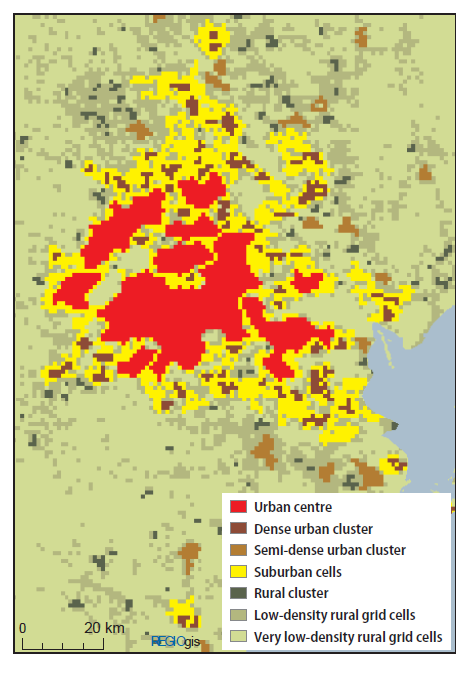
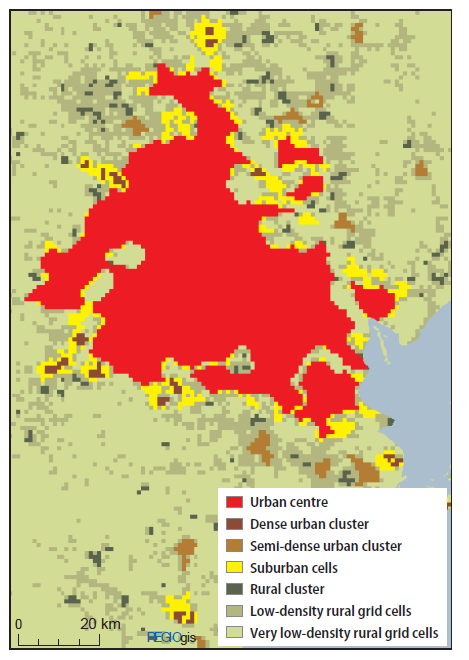
In countries with a strong separation of land use functions and relatively low-density urban developments, the methodology may generate multiple urban centres for a single city. For example, Houston in the United States has nine urban centres if the methodology is applied without considering cells that have a high share of their land classified as built-up areas (see Map 8.1). This is often because highways, railways, shopping centres, office parks and factories typically have little or no residential population and can occupy enough of a single grid cell that it does not reach the population density threshold of at least 1 500 inhabitants per km2. Although many people may use these areas during the daytime, the methodology is designed to be applied to the residential population, broadly speaking the night-time population. As a consequence, areas which are intensively used by city residents during the day but which have few, if any, residents might not be considered to be part of a city.
The threshold used to determine what constitutes a ‘high share of built-up area’ to reduce fragmentation depends on the data source used. Datasets that capture buildings and road infrastructure and have a coarse spatial resolution will typically show higher shares of built-up area in an urban setting as compared to datasets that only capture building footprints and have a fine spatial resolution. If multiple data sources for built-up area are available, the sources that include transport infrastructure as part of built-up area and have a fine spatial resolution are to be preferred.
The average share of built-up area in urban centre cells (before applying the iterative majority rule) and dense urban clusters can used to distinguish cells with a high share of built-up area from other cells. The cells with a high share of built-up area are added to the cells above to the population density threshold (1 500 inhabitants per km2) before applying the total density population size threshold both for urban centres and dense urban clusters[2].
The example below uses a 50 % threshold because this is the average for the urban centre and dense urban cluster cells for this data source.
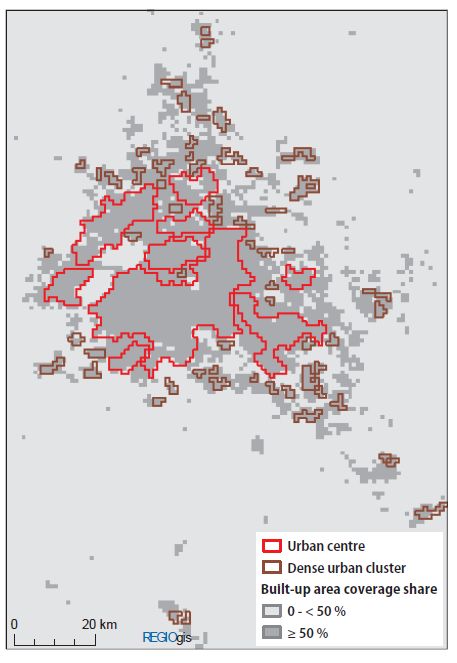
Creating urban centres using both criteria – cells with a density of at least 1 500 inhabitants per km2 and cells that are at least 50 % built-up – resolves this issue. For example, in Houston the nine separate urban centres are all connected by cells that are at least 50 % built-up (see Map 8.2).
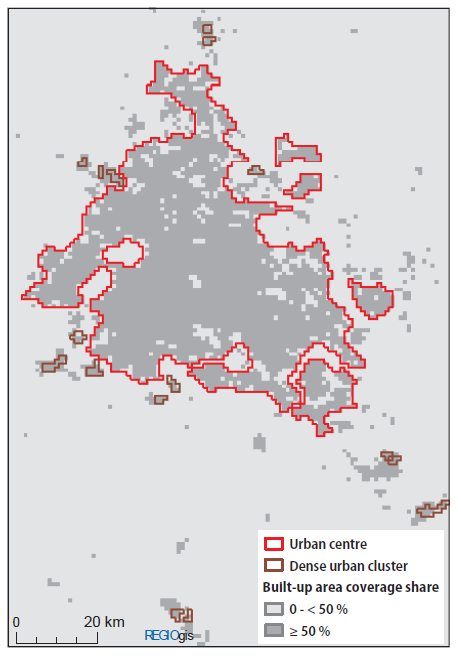
When the urban centre is defined using both of these criteria, the nine separate urban centres become one (see Map 8.3). In addition, a few separate dense urban clusters are also combined such that they reach the 50 000 population threshold and become an urban centre (see Map 8.4).
As official, up-to-date, high-resolution data on built-up areas are generally not available for many countries, this adjustment is optional. If high-quality data on built-up areas are available, however, adding the cells that are at least 50 % built-up to the urban centres is encouraged.
8.2.2 Water bodies, steep slopes and parks in a city
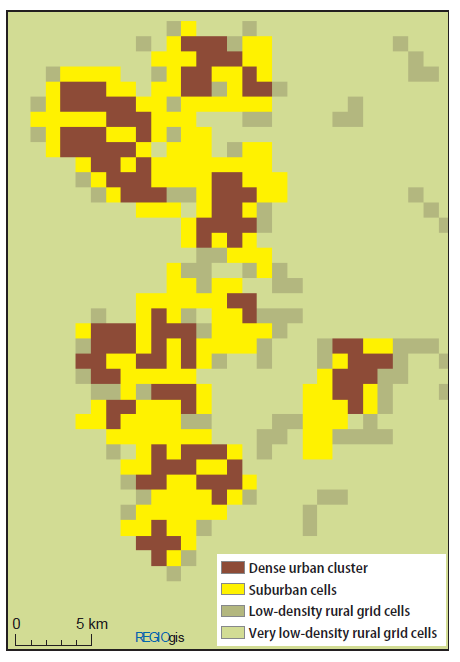
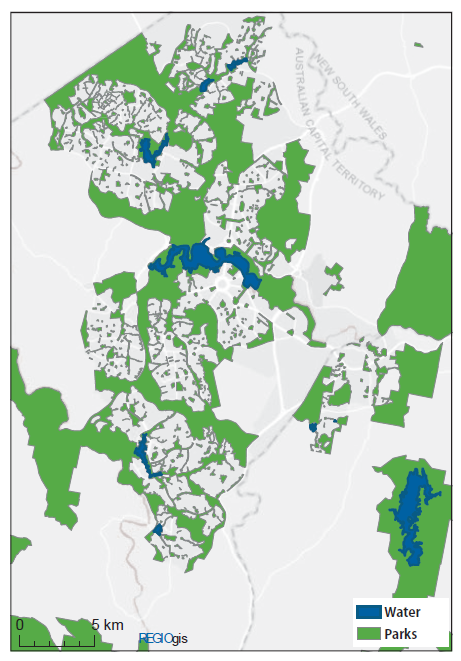
The presence of water bodies, steep slopes and parks may have an impact on the capacity of the methodology to identify a city. These elements can lead to gaps or separations which result in a single urban centre being fragmented into multiple centres or – when these fail to reach the minimum population threshold of 50 000 inhabitants – multiple dense urban clusters.
To overcome these problems, the methodology can be adapted to address gaps or separations that are due to the presence of waterways, parks and/or areas with steep slopes. This optional process should be applied to clusters of high-density grid cells before evaluating the minimum population of urban centres. Hence, the initial input of the workflow are clusters of contiguous grid cells characterised by a population density threshold of at least 1 500 inhabitants per km2, without any criterion for the total population of the cluster.
For the purpose of this process description, they are called sHDCs (small high-density clusters), as no minimum population threshold was applied. Each of these sHDCs is stored as a polygon and receives its unique number, which is required in further steps of the workflow. Additional spatial data are needed to represent the areas that will be taken into account in a special exercise to fill gaps in or separations between sHDCs:
- Waterways should ideally be portrayed as polygon features. If these are not available, waterway line features should be buffered to model the actual width of the waterway. Furthermore, waterway polygons can (optionally) be buffered by a limited width (for instance, a maximum of 50 m) to portray adjacent zones which are assumed not to be suitable for the construction of buildings.
- Zones with steep slopes should be retrieved from a layer with appropriate spatial detail. Usually this will be a selection of raster cells, with resolution equal to or higher than 1 km2. The selection of steep areas should be converted to polygons.
- Parks will also be represented by polygons; these should be retrieved from dedicated thematic layers.
The polygons representing waterways, steep slopes and parks are merged into a common polygon layer. Next, only the areas in the close neighbourhood of sHDCs should be taken into account for this special potential gap or separation filling.
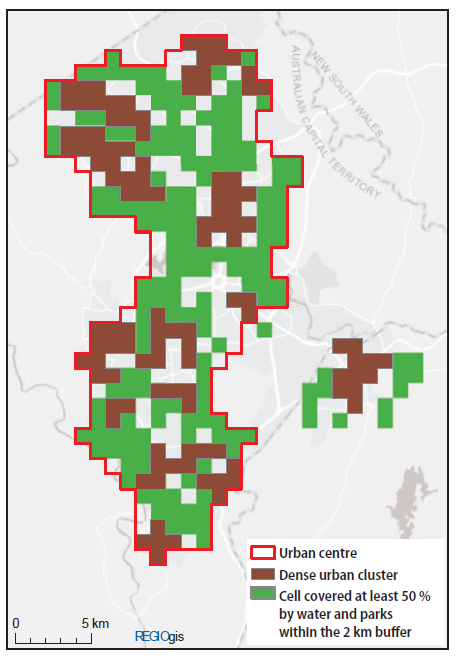
To assess this spatial relationship, each of the sHDCs is expanded by applying a buffer. The size of this buffer should be between 500 m and 2 000 m depending on the local circumstances (in other words, depending on the size of the water bodies, areas with steep slopes and parks). Then the common polygon layer for waterways, steep slopes and parks is intersected with the expanded sHDCs. Hence, the aim is to keep only those parts of waterways, steep slopes and parks that are located close to a sHDC. The selected waterways, steep slopes and parks are converted to 1 km2 grid cells by selecting those cells that are at least 50 % covered by the common polygon layer for waterways, steep slopes and parks.
In the next step, the grid cells of selected waterways, steep slopes and parks are merged with the sHDC grid cells. If this results in changes to the boundaries of the sHDCs, the result can be twofold:
- two or more sHDCs are linked by the grid cells added for waterways, steep slopes and parks;
- the coverage of a single sHDC has been expanded by adding adjacent grid cells for waterways, steep slopes and parks.
The goal of this adapted methodology is to capture only the first case when overlaying the adjusted sHDCs with the original ones. If an adjusted sHDC contains more than one original sHDC then the adjustment should be kept; a new sHDC has been created, covering two or more original sHDCs. If the adjusted sHDC only contains a single original sHDC then the adjustment should be discarded, reverting to the original classification of grid cells (as there is no need to expand the sHDC by adding nearby waterways, steep slopes or parks).
Only those new sHDC which reach a minimum population threshold of 50 000 inhabitants are kept. Thereafter, the normal smoothing and gap-filling process is applied to turn them into an urban centre.
Adjusting the results for cities
As the degree of urbanisation classification and the functional urban area classification share a common definition of cities, any changes that are made to the delineation of cities should be adopted for both of these classifications (using the same rules). More information on adjustments that might be made when delineating cities is provided in Subchapter 7.2.4.
Direct access to
- Gehlke, C. E. and K. Biehl (1934), ‘Certain Effects of Grouping upon the Size of the Correlation Coefficient in Census Tract Material’, Journal of the American Statistical Association Supplement, Volume 29, Issue 185A, pp. 169-170.
- Openshaw, S. (1984), The Modifiable Areal Unit Problem, CATMOG 38, Geo Books, Norwich.
Notes
- ↑ The modifiable areal unit problem (or MAUP) highlights that using different boundaries can produce different results. For example, altering the boundaries of electoral districts can change the outcome in first-past-the-post systems. When using larger spatial units, the degree of urbanisation classification tends to categorise fewer people as living in rural areas and cities and more people as living in towns and semi-dense areas. The MAUP was originally identified by Gehlke and Biehl (1934) and further developed by Openshaw (1984).
- ↑ The GHS-DUG tool makes it easy to apply this rule by using the reduce fragmentation option. The tool then automatically calculates the share of the selected built-up area layer for the urban centre and dense urban cluster cells.

