Applying the degree of urbanisation manual - Extensions to level 1 of the classification
7. Extensions to level 1 of the classification
This article forms part of an online methodological manual, Applying the Degree of Urbanisation – A methodological manual to define cities, towns and rural areas for international comparisons: 2021 edition.
The first two sections of this chapter describe possible extensions to level 1 of the degree of urbanisation classification: how to compile statistics for level 2 of the degree of urbanisation classification and how to compile statistics for functional urban areas (otherwise referred to as metropolitan areas). Both of these extensions have the potential to provide additional useful insight into the spatial structure of a territory/country. The final section details how specific geographic issues should be addressed from a methodological standpoint and provides information on further possible extensions.
Full article
7.1 Level 2 of the degree of urbanisation
The three classes assigned under level 1 of the degree of urbanisation provide an important first step to assess the urban-rural continuum. Cities are clearly defined settlements which can be organised by population size. The other two classes, however, are quite heterogeneous and do not identify specific types of settlement. The level 1 class of towns and semi-dense areas includes towns, but it does not separate them from semi-dense areas. Equally, rural areas may contain villages, but the degree of urbanisation level 1 does not separate them from other thinly populated areas. Therefore, a second level or sub-classification has been introduced to capture the full settlement hierarchy of large, medium and small settlements or, in simpler terms, cities, towns and villages.
7.1.1 Terminology
Two sets of terms have been developed to describe level 2 of the degree of urbanisation classification. The first set uses simple and short terms such as city, town and village. The second set uses more neutral and technical language. The second set can be helpful to avoid overlaps with the terms used in national definitions.
Small spatial units can be administrative units – such as municipalities – or statistical areas – such as census units (enumeration areas).
Semi-dense areas in low- and middle-income countries are often described as peri-urban areas. In high-income countries, they are usually described as suburbs. In both cases, these areas have a moderate density and are at the transition between a rural area and a city or town.
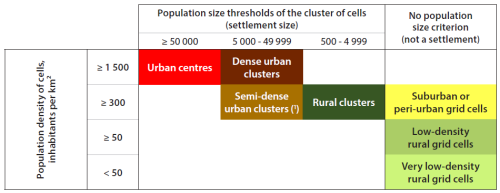
The technical terms that are used for level 2 of the degree of urbanisation classification follow a specific logic. The population density thresholds each have a specific term: dense means at least 1 500 inhabitants per km2, semi-dense means at least 300 inhabitants per km2, low-density means at least 50 inhabitants per km2 and very low-density means a density of less than 50 inhabitants per km2. The terms large, medium and small each refer to a specific population size threshold: large means a population of at least 50 000 inhabitants, medium means a population of at least 5 000 inhabitants and small means a population between 500 and 4 999 inhabitants. The technical terms for small spatial units that refer to a city, town or village include the word ‘settlement’, while the others use the word ‘area’. The technical terms for the grid cells follow the same approach: the word ‘cluster’ is used if linked to a settlement, while the word ‘cell’ is used for those cells that are not linked to a settlement.
7.1.2 Short description
Level 2 of the degree of urbanisation classification is a hierarchical sub-classification of level 1. It was created to identify medium and small settlements, in other words, towns and villages. Practically, it splits two classes into six sub-classes.
- Towns and semi-dense areas are split into three subclasses:
- dense towns;
- semi-dense towns;
- suburban or peri-urban cells; and
- Rural areas are split into three subclasses:
- villages;
- dispersed rural areas;
- mostly uninhabited areas or very dispersed rural area.
Level 2 of the degree of urbanisation classification is implemented with the same two-stage approach as level 1 of the classification. Firstly, grid cells are classified based on population density, population size and contiguity. Subsequently, small spatial units are classified according to the type of grid cells in which their population resides.
7.1.3 Grid cell classification
Stage 1: classifying grid cells
An urban centre is identified in the same manner as for the degree of urbanisation level 1.
- An urban centre consists of contiguous (using four-point contiguity) grid cells with a density of at least 1 500 inhabitants per km2. An urban centre has a collective population of at least 50 000. Gaps in this cluster are filled and edges are smoothed. To reduce urban centre fragmentation, cells that are highly built-up can be added (see Subchapter 8.2.1).
The urban cluster cells that are not part of an urban centre can be subdivided into three types.
- A dense urban cluster consists of contiguous (using four-point contiguity) grid cells with a density of at least 1 500 inhabitants per km2, with a collective population of at least 5 000 and less than 50 000 in the cluster; if highly-built-up cells are added to urban centres to reduce fragmentation, then highly built-up cells are also added to dense urban clusters.
- A semi-dense urban cluster consists of contiguous (using eight-point contiguity) grid cells with a density of at least 300 inhabitants per km2 and has a collective population of at least 5 000 (in other words, an urban cluster) and this cluster is neither contiguous with nor within 2 km of a dense urban cluster or an urban centre [1].
- Suburban or peri-urban cells are the remaining urban cluster cells, in other words those not part of a dense or semi-dense urban cluster. These grid cells are part of an urban cluster that is contiguous (using eight-point contiguity) or within 2 km of a dense urban cluster or an urban centre.
Rural grid cells can be categorised into three types.
- A rural cluster consists of contiguous (using eight-point contiguity) grid cells with a density of at least 300 inhabitants per km2 and a collective population between 500 and 4 999 in the cluster.
- Low-density rural grid cells are rural grid cells with a density of at least 50 inhabitants per km2 and are not part of a rural cluster.
- Very low-density rural grid cells are rural grid cells with a density of less than 50 inhabitants per km2.
7.1.4 Classifying small spatial units
Stage 2: classifying small spatial units
For level 2 of the degree of urbanisation classification, small spatial units are classified as cities in the same manner as in level 1.
- A city consists of one or more small spatial units that have at least 50 % of their population in an urban centre.
Within level 2 of the classification, small spatial units classified as towns and semi-dense areas can be divided into three subclasses.
- Dense towns have a larger share of their population in dense urban clusters than in semi-dense urban clusters (in other words, they are dense) and have a larger share of their population in dense plus semi-dense urban clusters than in suburban or peri-urban cells (in other words, they are towns).
- Semi-dense towns have a larger share of their population in semi-dense urban clusters than in dense urban clusters (in other words, they are semi-dense) and have a larger share of their population in dense plus semi-dense urban clusters than in suburban or peri-urban cells (in other words, they are towns).
- Suburban or peri-urban areas have a larger share of their population in suburban or peri-urban cells than in dense plus semi-dense urban clusters.
Dense and semi-dense towns can be combined into towns. This reduces the number of classes that are identified for level 2 of the classification and may be useful especially if the population share in semi-dense towns is low.
In a similar vein to towns and semi-dense areas, within level 2 of the classification small spatial units classified as rural areas can be divided into three subclasses.
- Villages have the largest share of their rural grid cell population living in a rural cluster.
- Dispersed rural areas have the largest share of their rural grid cell population living in low-density rural grid cells.
- Mostly uninhabited areas or very dispersed rural area have the largest share of their rural grid cell population living in very low-density rural grid cells.
In some countries, not all the small spatial units contain inhabitants. To classify the spatial units without any population, the same rules should be applied to their area instead of to their population.
Estimates indicate that, for most countries, a considerable share of the population is classified to each of the three classes of the degree of urbanisation level 1. For level 2 of the degree of urbanisation classification, in one or more of the seven classes some countries may only have a relatively small share of their population.
Map 7.1 and Map 7.2 show the application of the methodology to Toulouse and its surroundings.
Figure 7.1 provides a simplified and schematic overview of level 2 of the degree of urbanisation classification.
7.2 Defining functional urban areas
The degree of urbanisation classification may be complemented by a classification of functional urban areas (FUAs) [2]. A functional urban area (or metropolitan area) is composed of a city plus its surrounding, less densely populated spatial units that make up the city’s labour market, its commuting zone. This commuting zone generates a daily flow of people into a city and back (home to their dwelling). Such areas are often referred to as ‘functional’ because they capture the full economic function of a city. A functional urban area classification is particularly useful to inform policymaking in a number of domains, including transport, economic development and planning. Several national statistical authorities, including those of Brazil, Italy, Japan and the United States, complement their urban and rural area classifications with a classification of metropolitan areas.
The functional urban area classification and the degree of urbanisation classification are linked because they use exactly the same concept of a city. The functional urban area classification is exhaustive, in other words it covers all of the small spatial units in a territory, as those areas that are not classified as functional urban areas (metropolitan areas) are classified as areas outside a functional urban area (non-metropolitan areas).
It should be noted that not all of the areas within a functional urban area need to be classified as urban areas (in other words, cities plus towns and semi-dense areas) and that, as such, a functional urban area may contain rural areas if these belong to the commuting zone of a city. In a similar vein, it is possible for an urban area (in other words, cities plus towns and semi-dense areas) to be located outside a functional urban area, but only if the particular urban area is only composed of towns and semi-dense areas and therefore does not have a city. In other words, because cities are systematically included as part of a functional urban area, only towns and semi-dense areas (as well as rural areas of course) can be located outside a functional urban area.
7.2.1 Terminology
This section summarises the terms that are necessary to distinguish the different concepts that are used to define functional urban areas.
7.2.2 Short description
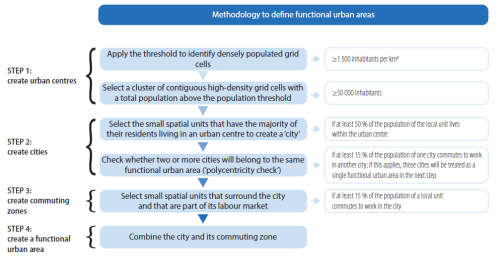
A functional urban area (metropolitan area) can be defined in four steps:
- Identify an urban centre – a set of contiguous grid cells with a density of at least 1 500 inhabitants per km2 and with a collective population of at least 50 000.
- Identify a city – one or more small spatial units that have at least 50 % of their population in an urban centre.
- Identify a commuting zone – a set of contiguous small spatial units that have at least 15 % of their employed residents working in a city.
- A functional urban area (metropolitan area) is a city plus its commuting zone.
Consequently, within the functional urban area classification, all the areas of a territory outside of cities and their commuting zones may be considered as areas outside a functional urban area (non-metropolitan areas).
Figure 7.2 shows visually the different concepts that are used in the classification of functional urban areas, notably the urban centre, the city, and the commuting zone.
The following data sources are required to compile statistics for functional urban areas:
- a residential population grid with the number of inhabitants per km2 of land area (in other words, excluding water bodies);
- digital boundaries for small spatial units;
- commuting flows between the small spatial units and the number of employed residents per small spatial unit.
7.2.2.1 Definition of an urban centre
The first step focuses on the concentration of population in space, which is the simplest and most uncontroverted feature of a city – the starting point for this definition. The idea of a city as a place with a relatively high concentration of population in space is common to many disciplines that describe a city including economic, social, cultural and geographical ones.
How to estimate commuting flows?
Several countries do not collect commuting data as part of their census. Other sources such as linked population and employment registers or mobile phone data could be used to estimate such flows.
Estonia offers an illustrative example where – as reported in two studies commissioned by the Ministry of the Interior and conducted by the Mobility Lab of the University of Tartu (Ahas et al. (2010); Ahas and Silm (2013)) – mobile positioning data made it possible to delineate functional urban areas (metropolitan areas). The movements between individuals’ anchor points (in other words, residence, work, and so on) are aggregated at the level of small spatial units (in other words, municipalities) in order to produce a matrix of flows. Such a matrix has the benefit of providing an estimation of mobility patterns for the entire population, rather than for employees only, at a highly disaggregated spatial scale.
The Netherlands has also produced a flow matrix between all small spatial units within its territory using mobile phone data (Van der Valk et al. (2019)).
Many national definitions of a city rely on the population size and density of a small spatial unit. This causes two types of problems. A big city in a relatively large spatial unit may have a very low or rural population density. For example, Ulaanbaatar, the capital city of Mongolia, has a population of 1.4 million but a density of only 270 inhabitants per km2. The population of a city is difficult to determine when it is spread out over multiple small spatial units. For example, how many people live in Paris?
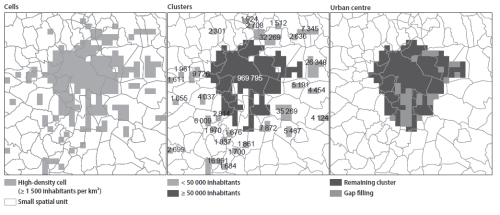
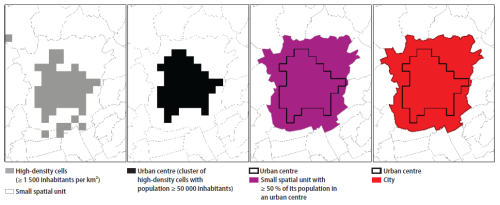
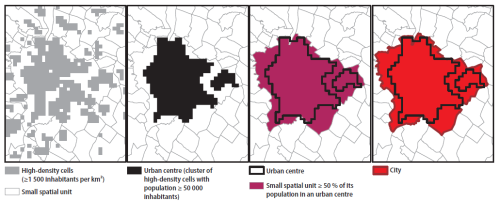
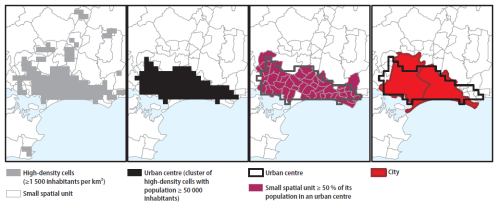
An urban centre, as defined in this methodological manual, relies on a population grid which can identify spatial concentrations of population independently from political or administrative boundaries, using spatial units of the same shape and size. An urban centre or high-density cluster is a spatial concept based on grid cells of 1 km2. It is defined in three steps, as indicated below and represented in Figure 7.3.
- Step 1: all grid cells with a density of at least 1 500 inhabitants per km2 of land are selected. If needed, cells that are at least 50 % built-up may be added (see Subchapter 8.2.1).
- Step 2: contiguous high-density cells are then clustered. Only those clusters with at least 50 000 inhabitants are kept. To avoid over-aggregation, four-point contiguity is used (in other words, cells with only the corners touching are not considered).
- Step 3: gaps in each cluster are filled separately and its edges smoothed.
7.2.2.2 Definition of a city
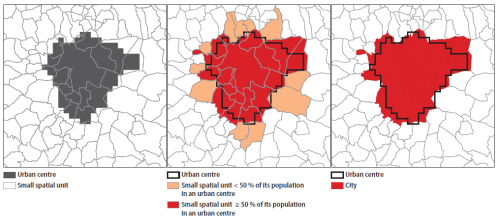
A city consists of one or more small spatial units with at least 50 % of their population in an urban centre. A small spatial unit can be either an administrative unit or a statistical area. Examples of administrative units include a municipality, a district, a neighbourhood or a metropolitan area. Some of these administrative units also have a political role as electoral districts or in terms of local government. Statistical areas can be census units/enumeration areas, census blocks, census tracts, wards, super output areas, named places or small areas. Examples of small spatial units used in OECD countries include communes in France, municipalities in Italy, sigungu in South Korea and census subdivisions in Canada.
The best small spatial unit for this definition is the smallest unit for which commuting data are available [3]. Figure 7.4 shows the process through which a city is identified by intersecting the grid-based urban centre with small spatial units.
7.2.2.3 Definition of a commuting zone
Once all cities have been defined, commuting zones can be identified using the following steps:
- if 15 % of employed persons living in one city work in another city, these cities are treated as a single city – this step is referred to as a ‘polycentricity check’;
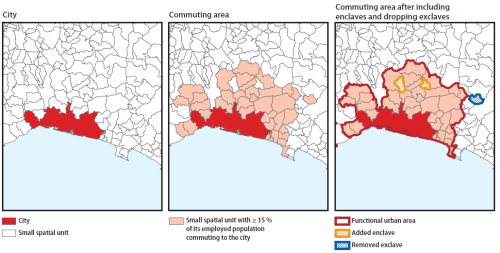
- all small spatial units with at least 15 % of their employed residents working in a particular city are identified as part of the commuting zone for that city (see Figure 7.5, second panel);
- enclaves, in other words, small spatial units entirely surrounded by other small spatial units that belong to a commuting zone or a city are included and exclaves or non-contiguous small spatial units are excluded (see Figure 7.5, third panel).
It can happen that, due to a low intensity of commuting flows, there is no commuting zone for a specific city. In this case, there is a perfect correspondence between the functional urban area and the city. The delineation of functional urban areas is summarised in Figure 7.5.
7.2.3 Defining an urban centre
The approach to identify an urban centre as part of the functional urban area classification is identical to that described for level 1 of the degree of urbanisation classification (see Subchapter 6.3.1). To identify an urban centre (high-density cluster):
- Select all 1 km2 grid cells with a density of at least 1 500 inhabitants per km2 of land area (in other words, for each cell the density should be calculated by excluding bodies of water); if needed, cells that are at least 50 % built-up may be added (see Subchapter 8.2.1).
- Cluster all contiguous cells above this density threshold using only four points of contiguity and keep those clusters with at least 50 000 inhabitants (high-density clusters); remove any clusters that have less than 50 000 inhabitants.
- Fill any gaps and smooth borders using the ‘majority rule’ iteratively until no more cells may be added.
The identification of an urban centre is based on a population grid. Several statistical authorities already produce their own population grids. For example, the 2011 GEOSTAT grid covers all EU Member States. Australia, Brazil, Colombia and Egypt either have their own grid or are developing one. Other national statistical authorities plan to produce an official population grid by geo-coding their next census. Because these grids are based on points, they are called ‘bottom-up’ grids. In other words, the grid is created from the bottom-up using data with a higher spatial resolution. Various institutions provide modelled global population grids that are publicly available (see Chapter 5).
In countries with relatively low-density urban development, a very accurate population grid and a strong separation of land uses, this approach may lead to an excessive fragmentation of urban centres. In such places, grid cells with shopping centres, transport infrastructure or business parks will not reach the residential density threshold to be included in the urban centre and this has the potential to create breaks between adjacent areas. The quality of the population grid also plays a role. In a disaggregation grid, some population would still be attributed to commercial or industrial areas, whereas in a bottom-up grid this would not be the case. Therefore, fragmentation is less likely to occur when using a disaggregation grid. To resolve this issue, grid cells that are at least 50 % built-up may be added to the urban centre. This resolves the problem in this specific type of city and has little to no impact on higher-density cities, as virtually all the cells that are at least 50 % built-up have a high enough population density or are added as part of the gap-filling process.
7.2.4 Defining a city
In most cases, defining a city is simple. There is a single urban centre located in a single small spatial unit. This means that all of the urban centre population is located in that small spatial unit and the share of its population in that urban centre is very high (see Figure 7.7).
However, in some cases the relationship is more complex. Two cases are discussed below: (i) if a city contains more than one urban centre; and (ii) if an urban centre covers two distinct cities.
7.2.4.1 A city contains more than one urban centre
It may be that a wide river, a steep slope or an industrial area has led to a split in the urban centre. In this case, the small spatial unit simply represents both urban centres. For example, Budapest has two separate urban centres (Buda on the west bank of the Danube and Pest on the east bank). They both fall within the same small spatial unit (see Figure 7.8).
7.2.4.2 An urban centre covers two distinct cities
Some urban centres cover two (or more) distinct cities, in the sense of two distinct urban settlements with their own centre and their own name. This can happen because these cities have grown towards each other but remain functionally distinct. If the population grid is estimated, this situation might occur because the estimated population is often more evenly distributed than the actual population.
In some cases, an urban centre can become too big to be plausible as the centre of a daily urban system, meaning that it is too large to be considered as a space encompassed by the daily movements of people between residence and place of work.
When a single urban centre covers two or more distinct cities, a national statistical authority can choose to create multiple cities. For example, Poole and Bournemouth in the United Kingdom share a single urban centre (see Figure 7.9) but are two separate cities. However, each of these cities should have a population of at least 50 000 inhabitants. If there is at least a one-way commuting flow of more than 15 % between these two cities, they should have a joint commuting zone and therefore be part of the same functional urban area. If, instead, the flow of commuting between the two cities is less than 15 %, then each city should have its own commuting zone and its own functional urban area. In addition, the urban centre can also be split into two parts along the border between the two cities.
7.2.4.3 What is a greater city?
In some situations, an urban centre may stretch far beyond the boundaries of the small central spatial unit that gives it its name. This is often the case for (large) capital cities that have outgrown their central spatial unit, such as Athens, Copenhagen, Paris or Valletta. To avoid confusion, the pre-fix ‘greater’ is often added to their name. This is already common practice in several countries, for example Greater London, Greater Dublin, Grand Paris and so on.
The functional urban area classification ensures that the most comparable boundaries are selected. It does this by first defining an urban centre independently from administrative boundaries and only in a second step identifying the administrative boundaries that correspond best to this urban centre. In this way, it is possible to ensure that comparisons are not made between, for example central Paris (within the confines of the périphérique) and the full urban sprawl of Berlin or London. Countries with relatively small spatial units, such as France and Switzerland, are more prone to this problem of ‘underbounding’ (see also Chapter 8).
In short, a greater city is a city. The addition of the term ‘greater’ functions only as a warning to the data users that this definition of the city contains more small spatial units than the central spatial unit which gives this city its name.
7.2.5 Defining a commuting zone
7.2.5.1 Checking for connected cities: the polycentricity check
The delineation and definition of a commuting zone starts with the polycentricity check, in other words, a check to see if two or more cities are linked by strong commuting flows. If city A has 15 % of its employed residents commuting to city B, then these two cities will share a single commuting zone. Note: it is sufficient that the flow of commuters reaches 15 % in a single direction. For example, if city B has a commuting flow of less 15 % to city A, it will still share the same commuting zone.
The polycentricity check is applied only once; it is not an iterative rule. For example: City C has a commuting flow of 20 % to city D. City E has a commuting flow of 10 % to city C and 10 % to city D. Then cities C and D will have a shared commuting zone, but city E will have its own commuting zone because the commuting flow to each individual city is too small. If city H and city I both have a commuting flow over 15 % to city J, then all three cities will share a single commuting zone.
7.2.5.2 Creating the commuting zone
The next step is to identify all small spatial units with at least 15 % of their employed residents working in a single city (or both cities in the case of cities linked by commuting flows). If a small spatial unit has a commuting flow of more than 15 % to two different cities, it will become part of the commuting zone of the city to which the flow is biggest. If a small spatial unit has a commuting flow of 20 % to city K and 17 % to city L, it will be classified as part of the commuting zone of city K.
Enclaves, in other words, small spatial units surrounded by a single functional urban area, are included and exclaves (or non-contiguous small spatial unit) are excluded. An enclave is defined as a small spatial unit that shares 100 % of its land border with the functional urban area (city or commuting zone); water borders are not considered. An exclave is defined as a small spatial unit that does not share any border with the functional urban area (city or commuting zone); in other words, it is a non-contiguous spatial unit.
The city destination for commuting flows should be the best approximation of the urban centre, in other words, all the units with at least 50 % of their population in the urban centre. If the city boundary is adjusted by adding or dropping a few small spatial units or shifted to a higher administrative level (see next section), this adjusted city should not be used for the commuting analysis; the only exception is where a single urban centre covers multiple cities.
7.3 Other possible extensions to the methodology: remoteness and land cover
Global Strategy’s, Guidelines on defining rural areas and compiling indicators for development policy, published in 2018 identifies three dimensions of ’rurality’: (i) sparse settlement; (ii) remoteness (from urban areas); and (iii) land cover. While consideration of all three dimensions is potentially useful for policy design and analysis, it is the dimension of sparse settlement (population size and density) that is captured by the degree of urbanisation classification.
Sparse settlement reflects the idea that at one end of a continuum (as measured by population size or density) there are rural areas that are more sparsely populated and settled, while at the other there are urban areas that are the most populous and densely populated parts of a country. Remoteness affects the opportunities people have to gain access to markets (for goods, services and labour) and to public services. It is most often represented by the difficulty of physical travel to places where markets and services are more (widely) available. Land cover is the physical cover on the land including vegetation (either planted or naturally occurring) and any buildings, other structures or features constructed by humans. Land cover reflects and determines land use, which is related to the human activities that take place there.
Remoteness
In general, remoteness (or distance from urban areas) is considered an important dimension of rurality. In combination with low population density, remoteness characterises rural areas that face particular challenges concerning their development. Remote areas are generally those where population densities are low, markets of all kinds are thin, and the unit costs of delivering most social services and many types of infrastructure are high. Additionally, in these areas that are distant from urban centres, farm-gate (or factory-gate) prices of outputs are often low and prices of inputs are often high, while it is usually difficult to recruit skilled personnel to work in public services or private enterprises. In contrast to remote areas, urban areas are characterised by agglomeration economies, in other words benefits that come when firms and people locate near to one another in cities and industrial clusters, effectively lowering the costs of transporting goods and sharing knowledge. More specifically, remoteness signifies the extent of opportunity people have to gain access to markets.
The dimension of remoteness can be included in the methodology for analytical purposes, though the identification of an empirical measure of remoteness to be used depends on the context in each country. Instinctively, a remote area is far from a city in terms of distance or the time it takes to travel physically from one place to another. The mode and speed of transportation, however, would be expected to vary depending on terrain and on the presence or absence of infrastructure. Travel by road or train might be the most common means of transport in one place, but travel by water or foot may be more common in another. While the variables chosen might be different across countries, or even within countries, the underlying supposition is that physical access to a city is key, however it is achieved.
Physical distance is not a perfect proxy, however, as distance may not restrict access to one service (for example, access to online education) but it may be a significant barrier to another (for example, access to a surgery at a regional hospital). Some disadvantages of remoteness may be overcome by telecommunication or internet services, as for example with the provision of health care services through satellite video. However, remoteness in terms of travel time is likely to be the most expedient approach when selecting a variable.
Concept of remoteness: an example for small regions
The OECD has used the concept of remoteness in a classification of small regions based on their access to functional urban areas (Fadic et al. (2019)). Based on this, a small subnational region (or territorial level 3 region, TL3) is classified as either a ‘metropolitan region’ – if at least half of its population lives in a functional urban area of at least 250 000 inhabitants – or as a ‘non-metropolitan region’. The concept of remoteness is thereafter used to further characterise non-metropolitan regions, more specifically:
- if at least half of the population in a non-metropolitan region cannot reach a functional urban area within a one hour drive, then that region is sub-classified as ‘remote’;
- if at least half of the population in a non-metropolitan region can reach a functional urban area within a one hour drive, then that region is sub-classified depending on the size of the functional urban area, as a non-metropolitan region:
- ‘with access to a metropolitan region’ (for functional urban areas of at least 250 000 inhabitants); or
- ‘with access to a small functional urban area’ (for functional urban areas with less than 250 000 inhabitants).
In short, though the concept of remoteness seems straightforward, it is not always clear how to represent it with data. For example, is remoteness always a function of physical distance? Or might this barrier be reduced/removed, for example by access to telecommunications that allow commercial transactions to take place virtually or social services like health care to be delivered remotely? Furthermore, data on road networks and their use are hard to come by on a global scale, although there have been recent attempts at improvement. The use of mass/public transportation might also be complicated to measure. In any case, remoteness might be considered less a permanent aspect of rurality and more a condition to be addressed by taking steps to improve access to markets and services in rural areas themselves. If that is the case, then a definition of remoteness should not include any elements that themselves are policy targets.
Land cover
Land cover consists of vegetation (occurring naturally or cultivated), buildings, roads and other man-made features and describes cover by forest, grassland, impervious surfaces, cropland and other land and water types (such as wetlands and open water). This is in contrast to land use that defines what people do on the landscape (for example, work in factories, live in houses, use parks and gardens for recreation, graze cattle on agricultural land) with the intention of getting benefit from its use. A given type of land cover, say tree cover, may support multiple land uses: for example, recreation, logging and/or conservation. For rural development policies and analytical purposes, countries may use land cover as an additional dimension to further enrich their understanding of rural areas and augment rural development policies (FAO (2018)).
Direct access to
- Ahas, R. and S. Silm (2013), ‘Regionaalse Pendelrände Kordusuuring’ (Re-study of regional commuting), Regionaalministri Valitsemisala.
- Ahas, R., S. Silm, O. Järv, E. Saluveer, and M. Tiru (2010), ‘Using Mobile Positioning Data to Model Locations Meaningful to Users of Mobile Phones’, Journal of Urban Technology, Volume 17, Issue 1, pp. 3-27.
- Fadic, M., J. E. Garcilazo, A. I. Moreno-Monroy and P. Veneri (2019), ’Classifying small (TL3) regions based on metropolitan population, low density and remoteness’, OECD Regional Development Working Papers, No. 2019/06, OECD Publishing, Paris.
- FAO (2018), Guidelines on defining rural areas and compiling indicators for development policy, Food and Agriculture Organization of the United Nations (FAO), Rome.
- Van der Valk, J., M. Souren, M. Tennekes, S. Shah, M. Offermans, E. De Jonge, J. Van der Laan, Y. Gootzen, S. Scholtus, A. Mitriaieva, B. Sakarovitch, S. Hadam, M. Zwick, M. Rengers, A. Kowarik, M. Weinauer, J. Gussenbauer, M. Debusschere and A. Termote (2019), 'City data from LFS and Big Data', Publications Office of the European Union, Luxembourg.
Notes
- ↑ Measured as outside a buffer of three grid cells of 1 km2 around dense urban clusters and urban centres; this ensures that adjacent, but not contiguous suburbs are taken into account.
- ↑ This subchapter is adapted from Dijkstra et al. (2019).
- ↑ In principle, commuting data at grid level would be another usable option, if available.


