Applying the degree of urbanisation manual - Methodology for applying level 1 of the degree of urbanisation classification
6. Methodology for applying level 1 of the degree of urbanisation classification
This article forms part of an online methodological manual, Applying the Degree of Urbanisation – A methodological manual to define cities, towns and rural areas for international comparisons: 2021 edition.
This chapter presents the key methodological recommendations on how to apply level 1 of the degree of urbanisation classification, which is the recommended level for a territorial classification of indicators on sustainable development goals.
Full article
6.1 Terminology
Two sets of terms have been developed to describe level 1 of the degree of urbanisation classification. The first set uses short and simple terms such as cities and rural areas. The second set uses more technical and neutral language. The second set can be helpful to avoid overlaps with the terms used in national definitions.
Small spatial units can be administrative units – such as municipalities – or statistical areas – such as census units (enumeration areas).
6.2 Short description
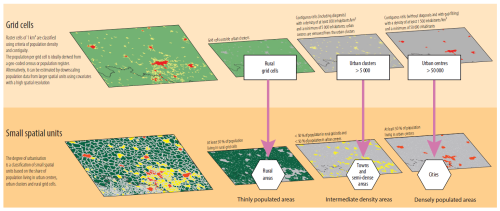
Level 1 of the degree of urbanisation classifies small spatial units as (i) cities or densely populated areas, (ii) towns and semi-dense areas or intermediate density areas and (iii) rural areas or thinly populated areas. This is done using 1 km2 grid cells, classified according to their population density, population size and contiguity (neighbouring cells). Each small spatial unit belongs exclusively to one of these three classes.
Urban areas consist of cities plus towns and semi-dense areas. Because level 1 of the degree of urbanisation classification was developed to capture the urban-rural continuum, it is recommended to report indicators for all three classes instead of only for the urban-rural dichotomy. This is important because towns and semi-dense areas may differ significantly both from cities and from rural areas. Semi-dense areas in low- and middle-income countries are often described as peri-urban areas. In high-income countries, they are usually described as suburbs. In both cases, these areas have a moderate density and are at the transition between a rural area and a city or town.
Within national statistical systems, there is generally a high level of agreement concerning the two outermost classes: cities are typically classified as being urban, while villages and sparsely-populated areas are typically classified as being rural. By contrast, the classification of intermediate areas is less clear-cut: some countries prefer to classify them as urban, others as rural, with a third group of countries choosing to create an intermediate class between these two extremes. The degree of urbanisation classification tries to accommodate these intermediate areas and different points of view to emphasise that towns and semi-dense areas are partway between a city and a rural area. This is important because policymaking that is uniformly applied across the three classes may not be suitable and could benefit from being tailored to the specific requirements of cities, towns and semi-dense areas or rural areas.
6.3 Grid cell classification
The basis for the degree of urbanisation classification is a 1 km2 population grid (for more details on how to construct a population grid, see Chapter 5). Each grid cell has the same shape and surface area, thereby avoiding distortions caused by using units varying in shape and size. This is a considerable advantage when compared with alternative approaches such as those based on the use of population data for local administrative units (for example municipalities).
The use of relatively small (1 km2) and uniform grid cells means that the basic concept underlying the methodology is to look inside larger local administrative units to detect the presence of individual cities, towns and semi-dense areas as well as rural areas. This makes it possible to create a more accurate classification. Grid cells of 1 km2 were selected instead of smaller cells for two reasons. They strike a balance between spatial detail, availability of official data, concerns about confidentiality and computational complexity. For example, grid cells of 1 km2 have been used by many national statistical authorities with few or no confidentiality concerns and can be processed by a regular desktop computer. Although a grid composed of cells that are 100 m by 100 m would provide more spatial detail, this would also increase the number of cells one hundred-fold. In addition, the method would have to be modified for two reasons. First, smaller cells would follow a different, more skewed population density distribution. Second, using a higher resolution grid could lead to the fragmentation of single settlements. A small linear park could be enough to split a settlement into two parts, which could also result in it falling below the population size threshold.
Understanding contiguous cells
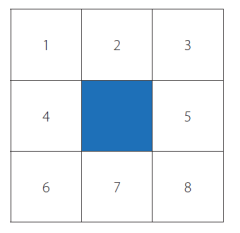
Before looking at the identification of the three different cluster types, it is necessary to understand the concept of contiguous cells. Figure 6.1 shows an array of nine grid cells, with the focus on the central cell which is surrounded by eight others, numbered 1 to 8.
Two types of contiguous grid cells can be identified:
- four-point contiguity, which is a narrower definition excluding diagonals – all cells that touch each other excluding those cells that only touch each other on a diagonal; only cells numbered 2, 4, 5 and 7 are contiguous to the central cell in Figure 6.1 according to this narrower definition.
- eight-point contiguity, which is a broad definition including diagonals – all cells that touch each other in any way, including cells that are linked only on a diagonal; all cells numbered 1 to 8 are contiguous to the central cell in Figure 6.1 according to this broader definition.
Stage 1: classifying grid cells Each cluster type is identified by classifying 1 km2 population grid cells according to characteristics that are based on their total population and population density[1].
Groups of 1 km2 population grid cells are plotted in relation to their neighbouring cells to identify:
- An urban centre (high-density cluster) – a cluster of contiguous grid cells of 1 km2 (using four-point contiguity, in other words, excluding diagonals) with a population density of at least 1 500 inhabitants per km2 and collectively a minimum population of 50 000 inhabitants before gap-filling; to reduce urban centre fragmentation, cells that are highly built-up can be added (see Subchapter 8.2.1).
- An urban cluster (moderate-density cluster) – a cluster of contiguous grid cells of 1 km2 (using eight-point contiguity, in other words, including diagonals) with a population density of at least 300 inhabitants per km2 and a minimum population of 5 000 inhabitants. In a final step, the grid cells identified as an urban centre are removed from the urban cluster.
- Rural grid cells (or mostly low-density cells) – grid cells that are not identified as urban centres or as urban clusters.
Note that in Eurostat’s Methodological manual on territorial typologies – 2018 edition (Eurostat (2019)), a grid cell can belong to an urban centre and an urban cluster. Applying the Degree of Urbanisation proposes a different approach, whereby every cell is allocated to one and only one class, by excluding those cells that belong to urban centres from urban clusters. This difference has no impact on the classification of small spatial units. Rather, the benefit of this mutually exclusive grid layer is that it will closely match the classification of spatial units and also adheres to the guidelines for an international reference classification.
6.3.1 Urban centres (high-density clusters)
The identification of urban centres (high-density clusters) is done in three steps. The first step involves identifying groups of contiguous cells:
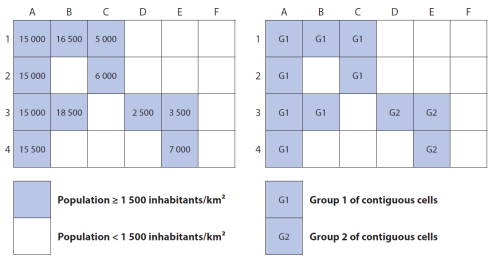
- all cells with a population density of at least 1 500 inhabitants per km2 are selected (light blue shading in Figure 6.2);
- groups of contiguous grid cells are identified (groups G1 and G2 in Figure 6.2). If available, cells that are highly built-up can be added (see Subchapter 8.2.1).
Contiguous cells are grouped together, however, when identifying urban centres diagonal contiguity is excluded. As such, in the example of Figure 6.2, cells C2 and D3 are not considered as contiguous; rather, they are each part of different groups (G1 and G2).
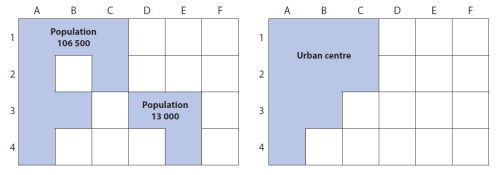
In a second step, each group of contiguous grid cells is analysed in relation to its total number of inhabitants and only those groups of contiguous cells with collectively at least 50 000 inhabitants are selected (see Figure 6.3). Continuing with the same example, Group G1 is considered an urban centre as it has a population of 106 500 inhabitants, as shown in Figure 6.3, while G2 is not an urban centre as its population is only 13 000 inhabitants.
The third step for identifying urban centres is taken to fill gaps and smooth borders. This is done by applying an iterative majority rule. This rule is applied to individual urban centres [2]: in other words, only cells for a particular urban centre and not the cells of other nearby urban centres are taken into account. In some cases, urban centres can become contiguous due to the majority rule, but they should not be combined and should remain as two separate entities. The majority rule can only add cells to an urban centre that are not already part of a different urban centre or a dense urban cluster (see Subchapter 7.1.3).
The majority rule was introduced to address several issues. It adds areas that have a lower population density (but are surrounded by densely populated neighbourhoods) and are likely to be heavily used during the day-time by city residents. These areas include industrial and commercial areas, transport hubs, parks and urban forests. The majority rule generates areas that are more suitable for monitoring the sustainable development goal indicators. For example, to measure the share of urban green areas, these areas should (ideally) be included within the urban centre or to measure the total area that needs to be served (or crossed) by public transport lines, industrial and commercial areas, parks and urban forests should also be included. The majority rule fills such gaps in urban centres [3] and produces a shape that is more rounded / lacks sharp angles. As a result, urban centres that have been modified to fill gaps and smooth borders are more likely to include transport lines that connect different parts of the urban centre.
The iterative ‘majority rule’
If five or more of the (eight) cells surrounding a particular cell belong to the same unique urban centre, then that cell is also considered to belong to the same urban centre; this process is repeated (iteratively) until no more cells may be added.
Note that the criterion for gap-filling following the majority rule includes cells that are linked only on a diagonal. For example, cell B2 on the left-hand side of Figure 6.3 has seven of its eight surrounding cells that belong to the same urban centre. This cell should therefore subsequently be added to the urban centre to smooth borders (as shown on the right-hand side of Figure 6.3). Following suggestions from several countries applying the degree of urbanisation, the majority rule should be applied only considering cells that are not covered by water. Therefore, the majority rule excludes water cells both from the potential gap filling cells and from the count of surrounding cells. For example, if cell C3 on the left-hand side of Figure 6.3 is classified as water, the majority rule will count seven of its seven suitable surrounding cells belonging to the same urban centre.
This leads to a more realistic extent of the urban centre along the shores of rivers, lakes and seas.
6.3.2 Urban clusters (or moderate-density clusters)
The technique used to identify urban clusters (moderate-density clusters) is similar to that used for urban centres (high-density clusters). Rather than using a threshold of at least 1 500 inhabitants per km2, the identification of urban clusters is based on grid cells with a population density of at least 300 inhabitants per km2 (see Figure 6.4).
The initial identification of urban clusters is done in two steps:
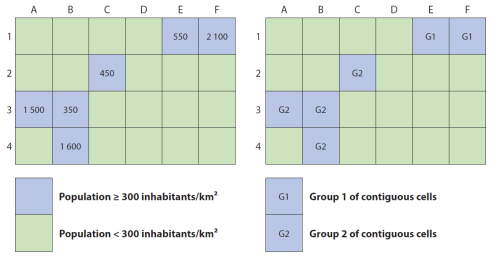
- all cells with a population density of at least 300 inhabitants per km2 are plotted (light blue shading in Figure 6.4);
- groups of contiguous grid cells are identified (groups G1 and G2 in Figure 6.4); note that contiguous grid cells may include cells that are linked only on a diagonal (eight-point contiguity) – as shown, for example, by cell C2.
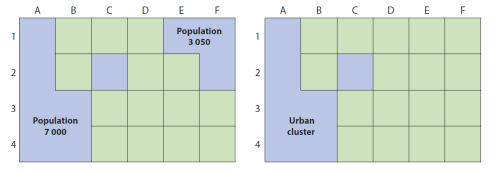
Thereafter, each group of contiguous grid cells is analysed in relation to its number of inhabitants and those groups of contiguous cells with collectively at least 5 000 inhabitants are selected; these are urban clusters. Note that if there are cells that are also part of an urban centre they are removed. Continuing with the same example, Group G1 is considered an urban cluster as it has a population of 7 000 inhabitants, as shown in Figure 6.5, while G2 is not an urban cluster as its population is only 3 050 inhabitants.
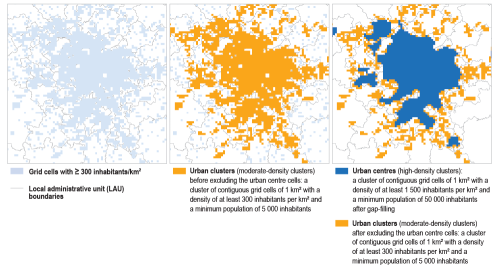
Figure 6.6 shows a schematic overview from grid cell classification through to the identification of urban centres. In the first image, grid cells with a population density of at least 300 inhabitants per km2 are identified. The second image overlays these grid cells showing urban clusters (moderate-density clusters) that are composed of contiguous grid cells linked by eight-point contiguity and at least 5 000 inhabitants before removing any cells that are also part of an urban centre. The final image shows the urban cluster cells after the removal of the urban centre cells and the urban centre – a set of contiguous grid cells that have a population density of at least 1 500 inhabitants per km2 and at least 50 000 inhabitants (before applying the iterative ‘majority rule’).
6.3.3 Rural grid cells
Rural grid cells are those cells that are not identified as urban centres or as urban clusters. The majority of rural grid cells have a population density that is less than 300 inhabitants per km2, although this is not necessarily the case. Some rural grid cells may have a higher number of inhabitants if they do not form part of a cluster that meets the criteria for an urban centre or an urban cluster.
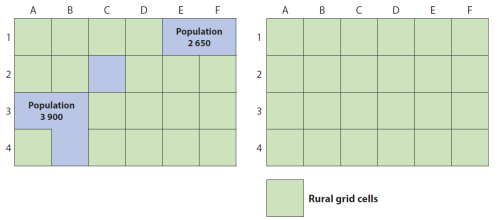
In Figure 6.7, cells A3, B4 and F1 each meet the population criterion for an urban centre (at least 1 500 inhabitants per km2), while cells B3, C2 and E1 each meet the population criterion for an urban cluster (at least 300 inhabitants per km2).
Each group of contiguous grid cells (groups G1 and G2 in the right-hand side of Figure 6.7) may be analysed in relation to their total number of inhabitants and those groups of contiguous cells with collectively at least 5 000 inhabitants are selected. In Figure 6.8, it can be seen that neither group G1 with a total population of 3 900 inhabitants nor group G2 with a total population of 2 650 inhabitants reaches the population threshold for an urban cluster. As such, each cell in these two groups is classified as a rural grid cell, as shown on the right-hand side of Figure 6.8.
Note also, as mentioned above, that it is possible for grid cells with a population density of less than 300 inhabitants per km2 to be classified as part of an urban centre, due to gap-filling or as a result of adding cells that are highly built-up (see Subchapter 8.2.1).
6.4 Classifying small spatial units
Stage 2: classifying small spatial units by degree of urbanisation
Once all grid cells have been classified and urban centres, urban clusters and rural grid cells identified, the next step concerns overlaying these results onto small spatial units, as follows:
- cities (or densely populated areas) – small spatial units that have at least 50 % of their population in urban centres;
- towns and semi-dense areas (or intermediate density areas) – small spatial units that have less than 50 % of their population in urban centres and no more than 50 % of their population in rural grid cells;
- rural areas (or thinly populated areas) – small spatial units that have more than 50 % of their population in rural grid cells.
Cities (or densely populated areas) consist of one or more small spatial units with at least 50 % of their population in an urban centre. A small spatial unit can be either an administrative unit or a statistical area. Examples of administrative units include a municipality, a district, a neighbourhood or a metropolitan area. Some of these administrative units also have a political role as electoral districts or in terms of local government. Statistical areas can be census units/enumeration areas, census blocks, census tracts, wards, super output areas, named places or small areas.
In some countries, not all the small spatial units contain inhabitants. To classify the spatial units without any population, the same rules should be applied to their area instead of to their population. For example, a small spatial unit without any population that has more than 50 % of its area in rural grid cells should be classified as a rural area.
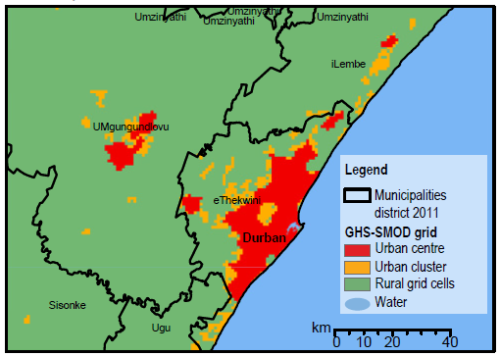
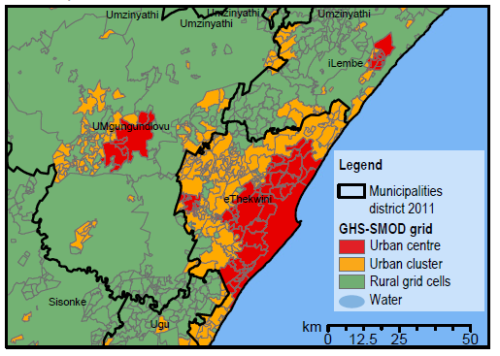
Map 6.1 shows the grid cell classification for Durban in South Africa and Map 6.2 shows the classification of small spatial units.
Note that each small spatial unit should be classified to one and only one of the three classes within level 1 of the degree of urbanisation classification. However, in order to classify small spatial units based on the population grid, these units have to be transformed into a raster as well, which can lead to some situations which require case-by-case solutions (see Subchapter 7.2.4 and Chapter 8 for more information on different types of adjustments that may be made).
Note: for more information, see http://ec.europa.eu/regional_policy/sources/docgener/work/2014_01_new_urban.pdf.
Source: Directorate-General Regional and Urban Policy, based on data from Eurostat, JRC, national statistical authorities
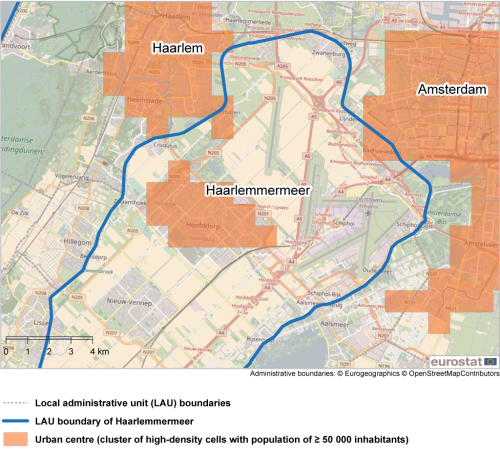
Map 6.3 shows that, when classifying small spatial units as cities, it may be necessary to consider more than one urban centre. In this example, there were 65 593 people living in the urban centre of Haarlemmermeer in the Netherlands, which equated to just 46 % of the total population of the small spatial unit for Haarlemmermeer (below the threshold of 50 % that is required to identify a city). Nevertheless, as shown in the example, there were two adjacent small spatial units – Amsterdam and Haarlem – and their urban centres spill over into Haarlemmermeer. Aggregating the total population of the three urban centres that are located within the boundaries of Haarlemmermeer results in the share of those living in urban centres rising to some 54 % of the total population; as such, Haarlemmermeer is classified as a city.
Note: GEOSTAT population grid from 2011 and small spatial units for 2016.
Source: Eurostat, JRC and European Commission, Directorate-General Regional and Urban Policy and Directorate-General Agriculture and Regional Development
Small spatial units with no population in the raster equivalent
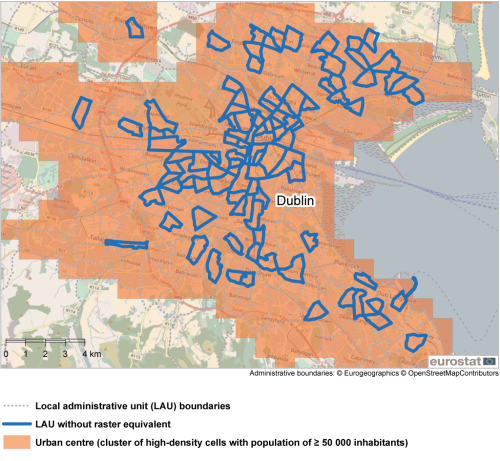
Some small spatial units will be too small to have a 1 km2 grid cell equivalent. When determining their class within level 1 of the degree of urbanisation, these small spatial units are not assigned any population as they are physically too small (smaller than one grid cell); as such, they are given no initial classification.
After the initial classification, these remaining small spatial units can be selected. For each small spatial unit a centroid falling within its boundaries should be determined. These centroids can be used to classify the remaining small spatial units. They should be spatially joined to the grid-based typology, whereby the small spatial unit gets the classification of the grid type in which its centroid falls. In the EU, such small spatial units were found to be exclusively in urban centres. An example is provided for Dublin in Ireland (see Map 6.4).
Note: GEOSTAT population grid from 2011 and small spatial units for 2016.
Source: Eurostat, JRC and European Commission, Directorate-General Regional and Urban Policy and Directorate-General Agriculture and Regional Development
This issue can also be resolved by using a raster with a higher spatial resolution, for example using cells that are 50 by 50 m. At this scale, virtually all small spatial units should have a raster equivalent. If a population grid is available or can be estimated at this scale, these small spatial units without raster equivalent in a 1 km2 grid can still be classified based on their population distribution between the three types of grid cells. The type of grid cells would still be defined at 1 km2, but the population distribution would be determined using the 50 by 50 m cells. Subchapter 10.1.3 describes the degree of urbanisation territorial unit classifier tool (GHS-DU-TUC) which facilitates the process of using smaller grid cells to classify spatial units.
6.5 Changes over time that impact on the classification given to each small spatial unit
The classification given to each small spatial unit according to level 1 of the degree of urbanisation classification should be updated to reflect any changes to the underlying sources of information that are used to determine their class. As such, the classes may be updated to reflect: changes to small spatial unit boundaries or changes to population distributions for 1 km2 grid cells. The frequency of such updates varies according to the source of information.
Changes to the classification given to each small spatial unit resulting from a revision of population distributions for 1 km2 grid cells are less common and these may be expected every 5 or 10 years, when new census data become available.
Annual updates of the degree of urbanisation classes assigned to small spatial units should be made to reflect changes to small spatial unit boundaries. These modifications can be implemented in two ways: applying the methodology for the degree of urbanisation classification as described above for the new layer of small spatial units; or estimating the degree of urbanisation based on changes to small spatial unit boundaries. The first approach is more labour intensive, while the second is particularly suitable if boundary changes for small spatial units are relatively minor or consist principally of merging small spatial units, especially if these have the same class at level 1 of the degree of urbanisation classification.
Updating to reflect changes in small spatial unit boundaries
Small spatial unit boundaries may change over time in three different ways: small spatial units may merge, they may undergo a boundary shift, or they may be split. The most common change for small spatial units within the EU in recent years has been for two or more small spatial units to be merged; boundary shifts have been less common, while splitting small spatial units has been rare.
Case 1: small spatial unit mergers
Merging two small spatial units with different degrees of urbanisation may be resolved by giving precedence to the more densely populated spatial unit:
- when merging small spatial units composed of a city and a town or semi-dense area, reclassify the new small spatial unit as a city;
- when merging small spatial units composed of a town or semi-dense area and a rural area, reclassify the new small spatial unit as a town or semi-dense area.
Such a process may be further refined by taking into account the relative population sizes of the two small spatial units.
Case 1a: small spatial unit mergers involving the same degree of urbanisation
The degree of urbanisation classification is additive, meaning that if two small spatial units classified as rural areas are subsequently merged into a single small spatial unit then they will remain a rural area; this is also true for the other classes in the classification.
Case 1b: small spatial unit mergers involving rural areas and towns and semi-dense areas
These mergers can be addressed in two simple ways: using the population of the urban cluster or using the population of the small spatial units.
In the first case, if the population of the relevant urban cluster(s) is available then add the population inhabiting the urban cluster for each of the small spatial units and divide this by the total population of the new small spatial unit to determine the new degree of urbanisation class. If more than 50 % of the population of the new small spatial unit lives in an urban cluster, the new small spatial unit should be classified under towns and semi-dense areas. If the population share is less than 50 %, then the new small spatial unit should be classified under rural areas.
In the second case, if the population living in the urban cluster cannot be identified, then the degree of urbanisation class may be determined based on the population distribution between the small spatial units. If more than 50 % of the population of the new small spatial unit comes from rural areas, the new small spatial unit should be classified under rural areas. If more than 50 % of the population of the new small spatial unit comes from towns and semi-dense areas, the new small spatial unit should be classified under towns and semi-dense areas.
Case 2: small spatial unit boundary shifts
Whereas mergers can be dealt with using simple techniques, boundary shifts cannot always be as reliably addressed. Indeed, in some rare cases, boundary shifts between small spatial units that have the same degree of urbanisation class can lead to a change in the classification given to the small spatial units. Such complexity means that a simple rule of thumb is often the preferred and most efficient approach.
A simple rule may be established whereby if a small spatial unit loses less than 25 % of its previous population or gains less than 50 % of its population due to boundary shifts, then the degree of urbanisation class does not change. This rule of thumb is likely to cover 90 % of all boundary shifts and ensures continuity. If this is not the case, then further investigation is required, as described below.
Case 2a: changes in the degree of urbanisation classification due to boundary shifts are excluded
For each small spatial unit, the share of population in the three different types of population grids cells is known. For example, if as the result of a boundary shift the population of a small spatial unit that has 100 % of its population in rural grid cells shrinks, then it will remain classified under rural areas. Equally, if a boundary shift for a small spatial unit that has 100 % of its population in rural grid cells rises, then the new small spatial unit would need to more than double its population before it could (potentially) be classified under towns and semi-dense areas. As a result, if a boundary shift leads to a change in population that is too small to tip the population share of the revised small spatial unit below 50 % of the relevant grid cells, it remains in the same degree of urbanisation class.
Case 2b: changes in the degree of urbanisation classification due to boundary shifts are unlikely (but cannot be excluded)
If the boundary shift leads to a change in population that is theoretically sufficient to tip the population share of the revised small spatial unit below or above 50 %, but the shift is between small spatial units with the same classification by degree of urbanisation, then the same class should be maintained.
Case 2c: changes in the degree of urbanisation classification due to boundary shifts are likely
In some cases, changes in the degree of urbanisation class are likely. As an example, if a city were to gain part of a suburb (classified under towns and semi-dense areas) as a result of a boundary shift. The city gains a small number of additional inhabitants (which does not have an impact on its classification by degree of urbanisation). The suburb loses some of its population (that is reclassified to the city). As a result, the population in the revised small spatial unit covered by the suburb may have less than 50 % of its population living in an urban cluster in which case it should subsequently be reclassified under rural areas.
Case 3: splitting small spatial units
This type of change is relatively rare. Therefore, the main recommendation is one of continuity; in other words, maintain the same degree of urbanisation class. If a small spatial unit is split, the new small spatial units should have the same degree of urbanisation class as the old small spatial unit. If there are concerns that the new small spatial units may have a different degree of urbanisation class, the same approaches as described for boundary shifts may be used.
Direct access to
- Eurostat (2019), Methodological manual on territorial typologies – 2018 edition, Publications Office of the European Union, Luxembourg.
- Florczyk, A., C. Corbane, D. Ehrlich, S. Freire, T. Kemper, L. Maffenini, M. Melchiorri, M. Pesaresi, P. Politis, M. Schiavina, F. Sabo, and L. Zanchetta (2019), GHSL Data Package 2019, JRC 117104, EUR 29788 EN, Publications Office of the European Union, Luxembourg.
Notes
- ↑ Population density should be calculated by dividing the residential population by total amount of permanent land. This ensures a better measure of population density in cells partially covered by water, such as cells that cover the shores of rivers, lakes and seas.
- ↑ When two or more urban centres are located close together, the outcome of the majority rule may lead to different results depending on which urban centre is treated first. The DUG tool (see Chapter 10) identifies all cells that could be allocated to more than one urban centre. It attributes the cells to one urban centre if the majority rule considering all urban centres leads to a single allocation. The remaining cells are not attributed to any urban centre. This ensures consistency in terms of how cells are allocated.
- ↑ In some cases, a large rectangular gap will not be filled by the majority rule. Note that the DUG tool (Chapter 10) fills all gaps that are smaller than 15 km2.
