Gallery of new files
This special page shows the last uploaded files.
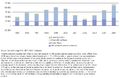
 Volume of sales index, selected retail trade activities, EU-27 (1)(2000=100).PNG Maintenance script
11:59, 30 April 2009
621 × 294; 21 KB
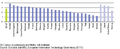
 Total high-tech patent applications to the EPO per million inhabitants, EU-25, by NUTS 2 regions, 2002.PNG Maintenance script
11:59, 30 April 2009
989 × 967; 1.03 MB
 Production of cereals (including rice), EU-27, 2007 (%) (1).PNG Maintenance script
11:59, 30 April 2009
395 × 160; 3 KB
 Price of fixed telecommunications, 2006.PNG Maintenance script
11:59, 30 April 2009
915 × 540; 49 KB
 Freshwater resources per capita – long-term average (1) (1 000 m³ per inhabitant).PNG Maintenance script
11:59, 30 April 2009
1,082 × 560; 38 KB
 Resources-uses balance for compensation of employees.PNG Maintenance script
11:59, 30 April 2009
904 × 336; 27 KB
 Public procurement (value of public procurement which is openly advertised, as % of GDP).PNG Maintenance script
11:59, 30 April 2009
665 × 321; 21 KB
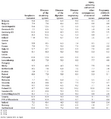
 Public and private expenditure on educational institutions per pupil, student, 2004 (1).PNG Maintenance script
11:59, 30 April 2009
937 × 461; 43 KB

 Individuals regularly using the Internet by type of connection, 2006.PNG Maintenance script
11:59, 30 April 2009
913 × 513; 41 KB
 20090304151336!GDP per capita at current market prices, 2007.PNG Maintenance script
11:59, 30 April 2009
679 × 341; 28 KB
 20090304131644!Government revenue and expenditure, 2007 (1) (% of GDP).PNG Maintenance script
11:59, 30 April 2009
556 × 226; 9 KB
 20090303101401!Waste treatment (non-hazardous), recovery, 2006.PNG Maintenance script
11:59, 30 April 2009
1,023 × 1,023; 68 KB
 20090205140359!Total financing for developing countries, EU-15.PNG Maintenance script
11:59, 30 April 2009
904 × 588; 66 KB
 Information technology expenditure, 2006 (1) (% of GDP).PNG Maintenance script
11:59, 30 April 2009
556 × 226; 8 KB
 Individuals using the Internet for interacting with public authorities, 2007 (% of all individuals aged 16 to 74).PNG Maintenance script
11:59, 30 April 2009
669 × 684; 42 KB
 Hospital discharges of in-patients by diagnosis, average length of stay, 2005.PNG Maintenance script
11:59, 30 April 2009
933 × 1,004; 90 KB
 General government expenditure by COFOG function, 2006 (1) (% of GDP).PNG Maintenance script
11:59, 30 April 2009
679 × 369; 26 KB
 Environmental protection expenditure by the public sector, EU-25, 2002 (1).PNG Maintenance script
11:59, 30 April 2009
754 × 446; 25 KB

 Breakdown of production of vegetables, EU, 2007 (1)(% of total, based on tonnes).PNG Maintenance script
11:59, 30 April 2009
662 × 316; 17 KB
 Number of sites having implemented an eco-management and audit scheme (EMAS), 2007 (1) (per million inhabitants).PNG Maintenance script
11:59, 30 April 2009
661 × 293; 14 KB
 Net migration (including corrections)(1 000).PNG Maintenance script
11:59, 30 April 2009
677 × 659; 65 KB
 Index of underperforming regions (UPR) in terms of unemployment, at NUTS level 2.PNG Maintenance script
11:59, 30 April 2009
694 × 700; 55 KB
 Guarantees provided by Central Government (as % of total debt), 2007.PNG Maintenance script
11:59, 30 April 2009
764 × 295; 14 KB
 20090304153653!GDP per capita at current market prices, 2007.PNG Maintenance script
11:59, 30 April 2009
673 × 307; 24 KB
 Volume of inland passenger transport, 2004.PNG Maintenance script
11:59, 30 April 2009
914 × 412; 20 KB
 Production sold in value terms, selected products, EU-27, 2007.PNG Maintenance script
11:59, 30 April 2009
690 × 862; 106 KB
 Price indices of agricultural output (nominal), EU-27 (2000=100).PNG Maintenance script
11:59, 30 April 2009
447 × 278; 14 KB
 Positive impacts of International Sourcing.PNG Maintenance script
11:59, 30 April 2009
976 × 512; 23 KB

 International trade for services, EU-27 (1).PNG Maintenance script
11:59, 30 April 2009
914 × 430; 24 KB
 International Sourcing of ICT services broken down by business partner.PNG Maintenance script
11:59, 30 April 2009
988 × 615; 33 KB
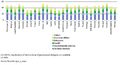
 Individuals' level of computer skills, 2007 (% of all individuals aged 16 to 74).PNG Maintenance script
11:59, 30 April 2009
556 × 238; 9 KB

 20090210125945!Daily smokers, 2003 (1) (% of male female population).PNG Maintenance script
11:59, 30 April 2009
556 × 250; 10 KB
 Total population change, by NUTS 2 regions, average 2001 to 2005.PNG Maintenance script
11:59, 30 April 2009
755 × 871; 519 KB
 Proportion of enterprises that have remote employed persons who connect to IT systems from home, 2006 (1) (% of enterprises).PNG Maintenance script
11:59, 30 April 2009
668 × 627; 36 KB
 Minimum wage and proportion of employees earning the minimum wage.PNG Maintenance script
11:59, 30 April 2009
928 × 814; 102 KB
 Main trading partners for exports, EU-27, 2007 (% share of extra EU-27 exports).PNG Maintenance script
11:59, 30 April 2009
360 × 273; 12 KB
 Hospital beds (per 100 000 inhabitants).PNG Maintenance script
11:59, 30 April 2009
572 × 623; 35 KB

 Acquisition of citizenship and asylum applications(persons).PNG Maintenance script
11:59, 30 April 2009
682 × 695; 90 KB
 20090304093232!Real GDP growth, EU-27 (% change compared with the previous year).PNG Maintenance script
11:59, 30 April 2009
469 × 180; 4 KB
(2000%3D100).PNG)


_(1_000_m%C2%B3_per_inhabitant).PNG)
.PNG)
.PNG)
.PNG)


,_recovery,_2006.PNG)

.PNG)

_(%25_of_GDP).PNG)
.PNG)
,_2006_(1)_son.PNG)
(%25_of_total,_based_on_tonnes).PNG)
,_2007_(1)_(per_million_inhabitants).PNG)
(1_000).PNG)
_in_terms_of_unemployment,_at_NUTS_level_2.PNG)
.PNG)


,_EU-27_(2000%3D100).PNG)


.PNG)

.PNG)
.PNG)
_(%25_of_male_female_population).PNG)

_(%25_of_enterprises).PNG)

.PNG)
.PNG)
.PNG)

.PNG)
,_EU-27,_2007_(%25)_(1).PNG)
_(%25_of_GDP).PNG)
_(%25_of_GDP).PNG)
,_2007.PNG)
.PNG)