Young people - family and society
Data extracted in July 2020.
Planned article update: 10 July 2024.
Highlights
In 2019, 29 % of all households in the EU-27 had children, 20 % were composed of couples with children, while single adults with children accounted for 4 % and other types of household with children for 5 %.
In 2019, on average young people in the EU-27 did not leave the parental home until the age of 27.1 years for men and 25.2 years for women.
In 2018, the average age for women to get married for the first time ranged from 26.5 years in Slovakia up to 34.0 years in Sweden. For men the range was from 29.2 years to 36.7 years, with Slovakia and Sweden again recording the lowest and highest average ages.
This article presents the situation of children and young people in families and society across the European Union (EU).
Family structures in the EU Member States vary, reflecting cultural and normative differences. The general postponement of financial and social independence by young people indicates a delayed transition to adulthood. This article also depicts the subjective well-being of young people and of households with children as well as the social and political participation of young people in EU society.
The vast majority of the data used in this article is derived from Eurostat’s demography indicators, the EU labour force survey (LFS) and EU statistics on income and living conditions (EU-SILC). However, in order to provide a global view of the main issues such as family composition, other data sources, for example, data from the United Nations, were also used.
Full article
Family composition and household structure
The share of households with children is decreasing in the EU-27
Less than three tenths (28.8 %) of all households in the EU-27 had (dependent) children in 2019 according to data from the EU labour force survey. One in five (19.7 %) households were composed of couples with children, while single adults with children accounted for 4.0 % of the total. Other types of households with children, for example, households where grandparents, parents and their children lived together, made up 5.1 % of all households.
Looking at developments since 2009, the share of EU-27 households with children decreased by 3.0 percentage points in only a decade (from 31.7 % in 2009 to 28.8 % in 2019), although the share of single adults with children was higher in 2019 than in 2009 (rising from 3.7 % in 2009 to 4.0 % in 2019); couples with children became somewhat less frequent (down from 21.5 % to 19.7 %) and other types of households with children also became less frequent (down from 6.5 % to 5.1 %). Over the same period, the proportion of couples without children increased marginally from 24.5 % to 24.7 %, while the proportion of single adults without children increased more substantially from 30.6 % to 34.6 %; the proportion of other types of households without children fell from 13.2 % to 11.9 %.
Large variations in household composition between EU Member States
Figure 2 extends the comparison of household composition to the EU Member States, presenting data for 2019. Ireland recorded the highest share of any type of household with children, at 38.7 %. Poland, Romania, Cyprus, Slovakia and Portugal were the only other Member States to report that more than one third of all households included children.
Ireland had the highest share of households composed of couples with children (25.5 %), followed by Poland (24.2 %) and Cyprus (23.9 %). Ireland also registered a relatively high proportion of single-adult households with children, 7.0 %, compared with a 4.0 % proportion for the EU-27. There were three Member States that had higher shares of households composed of a single adult with children, namely Lithuania (7.1 %), Denmark (8.4 %) and Estonia (9.4 %). Other types of households with children, for example multigenerational households, were particularly common in Croatia (12.4 %) and Romania (11.9 %), with none of the remaining EU Member States recording a double-digit share.
By contrast, the share of households with children was at its lowest levels in Finland (21.0 %) and Germany (22.1 %); as such, the share of households with children in Ireland was 1.8 times as high as in Finland. The next lowest share was in Sweden (22.9 %), while Austria and Bulgaria both reported that around one quarter (25.0 % and 25.8 % respectively) of their households had children. Looking only at couples with children, Latvia, Lithuania and Germany each reported that couples with children accounted for 15.3-15.7 % of all households, although the lowest share among the EU Member States was recorded in Bulgaria (14.2 %). Croatia and Finland recorded the lowest proportions of single-adult households with children (both 1.8 %), followed by Greece (2.2 %) and Romania (2.4 %).
Single adults and couples without children constitute over 50 % of all households in the developed world
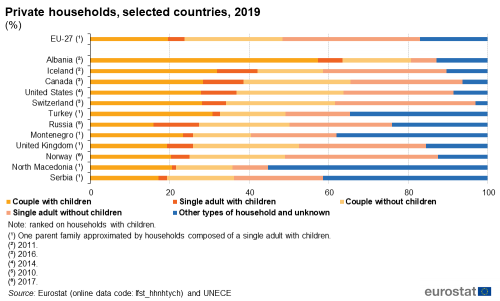
Couples with children are becoming less common in many parts of the world, including the EU. They represented, in 2019, less than 20 % of the total number of households in the EU-27 (19.7 %), the United Kingdom (19.4 %), Serbia (17.3 %) and Russia (15.9 %; 2010 data) — see Figure 3. The traditional ‘nuclear family’, composed of a couple with children, was seen to be in decline in the EU-27 as a higher proportion of people lived alone (34.6 %). Equally, a higher proportion lived as couples without children (24.7 %); this includes couples that have never had children as well as couples that have not yet had children (whose share may be influenced by changes in the average age at which women give birth to their first child) and couples whose children have left home (whose share may be influenced by increased longevity). Note that some of the households for which information is presented in Figure 3 under the heading of ‘Other types of household and unknown’ may contain children, for example, those households where children live in multi-generational households.
Compared with the non-member countries presented in Figure 3, the EU-27 had one of the lowest shares of single-adult households with children (4.0 % in 2019), with the share of single-adult households with children being more than twice the EU-27 share in Russia (11.5 %; 2010 data), Canada (10.2 %; 2016 data), Iceland (also 10.2 %; 2011 data) and the United States (8.9 %; 2014 data).
By contrast, households composed of couples with children still constituted the most common type of household composition in some countries. For example, couples with children made up 57.3 % of households in Albania (2011 data). In Iceland (2011 data), Canada (2016 data) and the United States (2014 data), households composed of couples with children also recorded the highest share of any type of private households.
Transition to adulthood: on average, young men leave the family home later than young women
The transition from childhood to adulthood is characterised by a number of crucial steps, such as leaving the parental home to study or work, being materially independent, moving in with a partner or getting married, and having children or not. However, the path to independence is not straightforward and young people face a range of challenges which may result in some of them staying longer in the parental home or returning to it.
Among others, issues that can influence the decision to leave the parental home include whether or not young people are in a relationship or studying, their level of financial (in)dependence, labour market conditions, the cost of housing and more generally living costs. Figure 4 indicates that in 2019, on average across the whole of the EU-27, young people did not leave the parental home until the age of 27.1 years for men and 25.2 years for women. Between 2009 and 2019, there was a slight decrease in the average age at which young people left the parental home, more so for men than for women; the average age for leaving the parental home decreased by 0.6 years for men (from 27.7 years old) and by just 0.1 years for women (from 25.3 years).
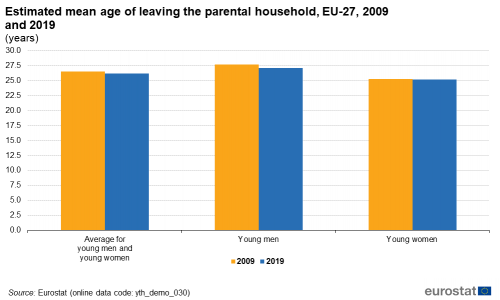
(years)
Source: Eurostat (yth_demo_030)
In most northern and western EU Member States, on average young people left home in their early twenties while in southern and eastern EU Member States the average age for leaving home was typically in the late twenties or early thirties
There are substantial differences between EU Member States regarding the practices concerning co-residence of generations (for example, parents living with their adult children). Figure 5 shows that there are substantial disparities between, on the one hand, southern and eastern EU Member States — where multi-generational households were a more common phenomenon — and, on the other hand, northern and western Member States — where children were more likely to leave the family home earlier in order to live on their own (or with others).
In Croatia, Slovakia, Italy and Bulgaria, the mean age of leaving the parental home was 30 years or above in 2019. Malta, Spain, Portugal and Greece followed with a mean age that was in the range of 28.9-29.9 years. By contrast, young people in Sweden, Luxembourg, Denmark, Finland and Estonia left the parental home, on average, before the age of 23, while in France, the Netherlands and Germany, the average age for leaving the parental home was also less than 25 years. The highest average age for leaving the family home among northern EU Member States was 26.6 years in Latvia, while among western Member States it was 26.8 years in Ireland. By contrast, the lowest average age for leaving the parental home among eastern Member States was 25.8 years in Czechia and among southern Member States it was 27.1 years in Cyprus.

(years)
Source: Eurostat (yth_demo_030)
On average, young women moved out of the parental home earlier than young men in all but one of the EU Member States, the only exception being Luxembourg (where young men left the parental home at a slightly younger age). There were, however, considerable variations in this gender gap: in 2019, young women in Sweden left the parental home, on average, aged 17.6 years, while for young men the average age was just a few months more, at 18.0 years; these were the lowest averages for men and for women among all of the EU Member States and also the smallest gender gap (0.4 years) in favour of women. The low figures in Sweden may, in part, be explained by the Government’s youth policy that is targeted at young people aged 13-25 years old with a focus on getting them established in work and society (Med fokus på unga — en politik för goda levnadsvillkor; With youth in focus — a policy for good living conditions, power and influence). As noted above, the average age that young people left the family home was also relatively low in Luxembourg (where a high proportion of young people study at university or other tertiary educational establishments in another country), as well as in Denmark, Finland and Estonia. Each of these countries was also characterised by a relatively small gender gap: 0.3 years in favour of men in Luxembourg, 0.5 years in favour of women in Denmark, 0.6 years in favour of women in Estonia and 1.5 years in favour of women in Finland. These figures can be contrasted with the situation in Croatia, where the average ages for men and women leaving the parental home were 33.6 years and 29.9 years — the highest values for either sex across all of the Member States, resulting in a gender gap of 3.7 years. Even larger gender gaps were observed in Bulgaria (a gap of 4.5 years) and Romania (4.6 years).
Men under the age of 30 tended not to leave the family home in many of the southern EU Member States
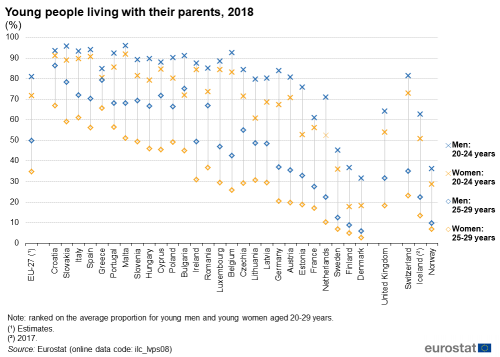
For the EU-27, the data in Figure 6 show that 80.9 % of young men aged 20-24 years lived with their parents in 2018, while the corresponding share was 71.7 % for young women of the same age. Looking at the age group 25-29 years, the proportion of young men living in the parental home was almost half (49.9 %) and the share for young women was close to one third (34.7 %).
In 2018, more than three quarters of young men aged 25-29 years lived in their parent’s home in Croatia (86.3 %), Greece (79.1 %), Slovakia (78.3 %) and Bulgaria (75.1 %). By contrast, young men in Denmark, Finland and Sweden were much more likely to have left the parental home, as only 5.9 %, 8.8 % and 12.3 % of those aged 25-29 years were still living with their parents in 2018. A similar pattern, but with generally lower shares, was observed for women: more than three in five women aged 25-29 years were living with their parents in 2018 in Croatia (66.9 %), Greece (65.7 %) and Italy (61.0 %), while less than 1 in 10 did in Denmark (2.7 %), Finland (4.9 %) and Sweden (6.9 %).
Turning to the younger age group, namely persons aged 20-24 years, Denmark, Finland and Sweden again reported the lowest shares of young people living with their parents in 2018, around one third for men and less than one fifth for women in Denmark and Finland and less than half for men and around one third for women in Sweden. Elsewhere, around two thirds or more of young men aged 20-24 years lived with their parents; this share exceeded 9 out of 10 young men in nine of the EU Member States, peaking at 96.0 % in Malta. Among young women of the same age group, a majority were living with their parents in all but three of the Member States; the exceptions were the three Nordic Member States mentioned above. In three Member States, the share for women aged 20-24 years exceeded 9 out of 10 and peaked at 91.8 % in Malta.
Stable gender gap concerning the age at first marriage
The average age of people at the time of their first marriage increased considerably over the two last decades in all of the EU Member States (see Figure 7). A simple average based on those EU Member States for which national data are available in 2018 shows that the average age for women to be wed for the first time was 30.5 years, while that for men was 33.1 years. In 1998, the average age (again a simple average based on available data) of first marriage was 26.1 years for women and 28.8 years for men. As such, the average age for a first time marriage increased by just over four years for both men and women between 1998 and 2018, although some of this difference may be explained by the different data coverage.
Despite these increases in the average age at the time of first marriage, the gender gap remained relatively unchanged in most of the EU Member States. In 2018, the simple average of the gender gaps was 2.6 years whereas in 1998 it was 2.7 years. The average age of men at the time of first marriage was systematically higher than the average among women in each of the EU Member States. The largest gender gaps in 2018 were recorded in Romania (3.4 years), Bulgaria (3.3 years) and Greece (3.1 years), while Portugal and Ireland (2016 data) were the only Member States where this gender gap was less than 2.0 years.
Slovakia, Poland and Bulgaria were the EU Member States that reported the youngest average ages for women getting married for the first time in 2018, from 26.5 to 27.5 years. At the other end of the range was Sweden, where the average age of women getting married for the first time was 34.0 years. The pattern across Member States for men was similar to that observed for women, as Slovakia and Poland were the only ones where the average age for men getting married for the first time was less than 30.0 years, while Sweden again had the oldest average (36.7 years).
Births outside of marriage increased in the EU
The proportion of live births outside marriage increased across the EU over recent decades, reflecting the changing patterns of family structures. More and more couples became parents without getting married and those that did marry tended to do so at a later age. The share of children born outside of marriage in the EU-27 rose from 22.9 % in 1998 to reach 34.6 % by 2008, before continuing to increase during the most recent decade, as the simple average across those EU Member States for which data are available (see Figure 8) was 41.6 % in 2018 (including 2016 data for Belgium and 2017 data for Cyprus), compared with 35.2 % for the same Member States in 2008.
In 2018, the highest shares of live births outside of marriage were recorded in France (60.4 %), Bulgaria (58.5 %), Slovenia (57.7 %) and Portugal (55.9 %), while more than half of all live births were also outside of marriage in Sweden, Denmark, Estonia and the Netherlands. By contrast, Greece (11.1 %), Cyprus (20.3 %; 2017 data) and Croatia (20.7 %) recorded the lowest proportions of live births outside of marriage in 2018.
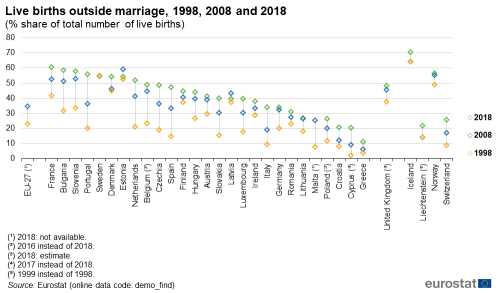
(% share of total number of live births)
Source: Eurostat (demo_find)
Between 1998 and 2018, the proportion of live births outside of marriage grew in all but one of the EU Member States (subject to data availability). Portugal (up 35.8 points), Spain (32.8 points) and the Netherlands (31.1 points) recorded the largest increases, while Latvia (2.4 points) and Estonia (1.6 points) were the only Member States to register increases below 5.0 points. Sweden was the only exception, insofar as it reported a modest fall in the share of live births outside of marriage between 1998 and 2018 (down 0.2 points).
Bulgaria and Romania had the highest numbers of live births during adolescence and youth
Complementing the findings for fertility rates and the mean age of mother’s when having their first child (as presented in the article on demographic trends), Figure 9 shows the fertility rates of women aged 15-30 years, broken down by five-year age groups. For young women aged 15-19 years, the EU-27 fertility rate was 9.1 live births per 1 000 young women, rising to 39.0 live births per 1 000 women among those aged 20-24 years and 87.3 live births per 1 000 women for those aged 25-29 years.

(live births per 1 000 women)
Source: Eurostat (demo_frate)
There were considerable differences across EU Member States as regards fertility rates during adolescence and for young women. These differences may reflect, among other factors, sex education at school, attitudes towards discussing these matters within families, and cultural differences with regards to typical ages for marriage and family formation. The fertility rate for young women was relatively high in Bulgaria and Romania (38.9 and 36.4 live births per 1 000 young women aged 15-19 years). Denmark, the Netherlands, Slovenia, Italy, Sweden, Finland and Luxembourg recorded the lowest fertility rates for young women aged 15-19 years (all less than 5.0 live births per 1 000 women).
Turning to the age group 20-24 years, Romania and Bulgaria also recorded the highest fertility rates in the EU (74.3 and 69.3 live births per 1 000 young women respectively), followed by Slovakia (57.2 live births per 1 000 women) and Latvia (56.0 live births per 1 000 women). Luxembourg and Spain recorded the lowest fertility rates in this age group, with 23.2 and 24.1 live births per 1 000 women.
The oldest age group shown in Figure 10 concerns young women aged 25-29 years. Fertility rates in this age group were lowest in the southern EU Member States. Spain recorded, by far, the lowest fertility rate for women of this age (51.7 live births per 1 000 women in 2018), while rates were within the range of 60-70 live births per 1 000 women in Malta, Italy, Luxembourg, Greece, Cyprus and Portugal. Equally, most of the eastern and northern Member States reported fertility rates in this age group that were above the rate for the EU-27; Hungary and Finland were exceptions to this rule (with lower than average fertility rates). For the western Member States, the picture was less clear cut. Rates ranged from 63.2 live births per 1 000 women in Luxembourg to 115.9 live births per 1 000 women in France, which was the highest fertility rate for this age group among the Member States.
The number of abortions has gone down greatly, as has the share of abortions among teenagers
The ability of families to plan whether or not to have children and when to have them is fundamental. Yet, family planning remains a neglected public health priority [1] and unmet needs for contraception and advice lead to unintended pregnancies which may impact upon lives and well-being.
In 2018, there were 455 000 legally induced abortions in the 16 EU Member States for which data are available. This figure marked a reduction of 46 % when compared with the 664 000 abortions that were registered in 2008 (in the 16 Member States for which data are available for both reference years).
While most pregnancy terminations in 2008 and 2018 concerned young women under the age of 30 years, the most recent data suggests that there has been a decrease in abortions performed on girls aged under 20 years. For instance, in Estonia and in Finland, the share of all legal abortions that concerned teenagers (less than 20 years old) fell by 11.0 and 9.2 points. A similar (but less marked) downward development was observed in 12 of the other 13 Member States for which data are available in both parts of Figure 10, the one exception being Hungary where the share increased from 12.2 % in 2008 to 13.4 % in 2018.

(% share of legally induced abortions)
Source: Eurostat (demo_fabort)
Foreign-born children and young people in the EU
Citizens from EU Member States have the freedom of movement within the EU’s internal borders. Being free to move from one EU Member State to another may help promote intercultural understanding and contribute to the creation of a common EU identity. Furthermore, this freedom allows EU citizens to live, study and look for work in another Member State.
Migration policies within the EU are increasingly concerned with attracting particular migrant profiles, often in an attempt to reduce perceived skills shortages. Selection can be carried out on the basis of language proficiency, work experience, educational attainment and/or age. International immigration, especially of young people, may be used as a tool to solve specific labour market shortages but also to have a positive impact on the age structure of the destination country. However, migration alone will almost certainly not reverse the ongoing pattern of population ageing that is being experienced in many parts of the EU.
Migration is influenced by push and pull factors that combine economic, political and social factors, as well as global events, and linguistic and/or historical ties; these may have a direct impact on the size and composition of foreign populations.
Just over one in five children and just over two in five young people in Luxembourg were born outside the country
Looking at the population of children aged 0-14 years, Luxembourg was the EU Member State where the share of foreign-born children was highest in 2019, with 13.9 % of children born in another EU-27 Member State and 6.6 % of children born in a non-member country, resulting in one fifth (20.5 %) of all children having been born outside the national territory (see Figure 11). Ireland, Sweden and Cyprus had the next highest shares of foreign-born children: in Ireland, some 12.0 % of all children were born in another country (no breakdown available); in Sweden, 1.6 % of all children were born in another EU-27 Member State, while 7.8 % were born in a non-member country (the highest share among EU Member States), giving a total of 9.4 % of all children being foreign-born; in Cyprus, some 9.2 % of all children were born in another country (no breakdown available). By contrast, Croatia and Czechia recorded the lowest shares of children having been born outside of their national territory (0.7 % and 1.1 % of the total).
Figure 12 presents similar figures but for young people aged 15-29 years; note that the scale of this figure is different from that used in Figure 11 for children. As for children, the highest share of young people born in a foreign country was recorded in Luxembourg (41.9 % in 2019), followed by Cyprus, Malta, Austria and Sweden (where 30.3 %, 28.2 %, 21.3 % and 20.8 % respectively of all persons aged 15-29 years had been born abroad); these were the only EU Member States where more than one fifth of all young people were foreign born. While a majority of foreign-born young people in Luxembourg were born in another EU-27 Member State, the opposite was true in Austria and Sweden (where a higher proportion of foreign-born young people were born in non-member countries (there is no breakdown available for Cyprus or Malta)). There were six Member States that reported double-digit shares of young people aged 15-29 years that had been born in non-member countries. The highest shares were recorded in Sweden (17.1 %), Spain (15.5 %) and Luxembourg (13.9 %), while Austria, Belgium and Italy each recorded shares within the range of 10.1-12.2 %; all of the remaining Member States (for which data are available) recorded single-digit shares.
On the other hand, Poland, Lithuania, Slovakia, Bulgaria and Latvia had the lowest shares of young foreign-born persons, as this subpopulation accounted for 1.4-2.5 % of the total population among those aged 15-29 years.
Figure 13 focuses on the age structure of the foreign-born population within each EU Member State and particularly the share of children and young people aged 15-29 years within the total foreign-born population.
In 2019, Romania had the highest share of children and young people in its foreign-born population, as those aged 0-29 years accounted for three fifths (60.6 %) of the total foreign-born population. Bulgaria, Cyprus, Ireland and Malta followed with an aggregated share for children and young people that was higher than one third of the total foreign-born population. At least one fifth of the foreign-born population of the EU Member States consisted of children and young people with five exceptions: the three Baltic Member States (Latvia, 6.8 %; Estonia, 11.2 %; Lithuania, 17.0 %), Croatia (10.2 %) and Slovenia (17.8 %).

(% share of total number of foreign-born people)
Source: Eurostat (migr_pop3ctb)
Subjective well-being
The level of integration in society can be reflected through subjective measures such as overall life satisfaction or the degree of happiness. The EU-SILC survey and its ad-hoc modules cover a broad range of different aspects linked to subjective well-being and happiness, with interesting results for young people (aged 16-24 years) and different types of households with children.
Young people tend to report higher levels of life satisfaction
Life satisfaction can be measured on an 11-point scale which ranges from 0 (‘not satisfied at all’) to 10 (‘fully satisfied’). In order to aid interpretation, answers were grouped into low, medium and high satisfaction, based on the following thresholds: scores of 0-5 were classified as a ‘low’ levels of satisfaction, 6-8 as ‘medium’ levels of satisfaction, and 9 and 10 as ‘high’ levels of satisfaction.
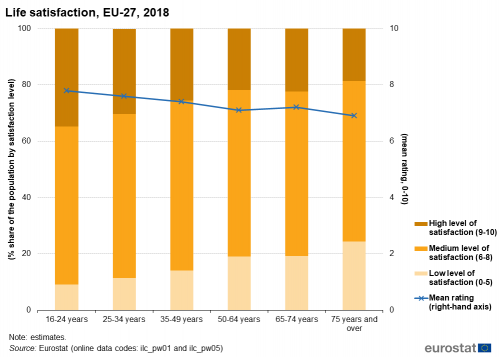
As can be seen in Figure 14, life satisfaction in 2018 was highest in the EU-27 among the youngest age group, as 34.8 % of young people aged 16-24 years reported that they were highly satisfied with life; this high share pushed up the average level of satisfaction among people aged 16-24 years to 7.8 (on a scale of 0-10).
Generally, life satisfaction within the EU-27 population decreased as a function of age, with the exception of those aged 65-74 years (the period in life which corresponds to the first decade of retirement for many people), where satisfaction levels were slightly higher in 2018 than for people aged 50-64 years (7.2 compared with 7.1).
In most EU Member States, the youngest age group reported the highest overall scores for life satisfaction in 2018, exceptions being Denmark, Luxembourg, the Netherlands, Finland and Sweden, where people aged 65 years and over were more satisfied than the young; Ireland, where people aged 25-34 years were more satisfied than the young; Belgium, where people aged 25-34 years were as satisfied as the young; Malta, where people aged 25-34 years and people aged 35-49 years were as satisfied as the young.
Figure 15 presents information on the population aged 16-24 years by their reported level of life satisfaction. In 2019, more than half (56.1 ) of the EU-27 population aged 16-24 years had a medium level of life satisfaction, while just over one third (34.8 %) enjoyed a high level of life satisfaction. As such, fewer than 1 in 10 (9.2 %) young people had a low level of life satisfaction.
Looking in more detail at the results for the EU Member States, almost half of the population aged 16-24 years in Ireland (49.9 %) had a high level of life satisfaction, closely followed by young people in Austria, Czechia, Poland, Slovakia and Romania (where between 45.7 % and 48.6 % of all young people had a high level of life satisfaction). At the other end of the range, more than one third (36.4 %) of all young people in Bulgaria had a low level of life satisfaction. This was a much higher share than in any of the other EU Member States, with Lithuania (20.5 %) and Hungary (15.3 %) recording the next highest shares.
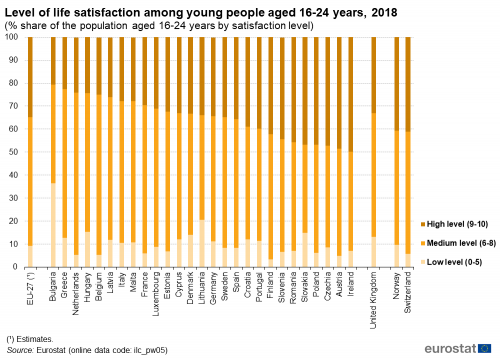
(% share of the population aged 16-24 years by satisfaction level)
Source: Eurostat (ilc_pw05)
Life satisfaction is higher among couples and in households with children
Figure 16 shows that life satisfaction for people living alone in the EU-27 was below the average level of satisfaction for couples (either with or without children). Households with two adults reported the highest levels for life satisfaction in 2018 (7.3). The lowest level of life satisfaction, on the other hand, was recorded for single-person households (6.8). Households with dependent children reported a higher level of life satisfaction (7.6) than households without dependent children (7.1), which may reflect the lower levels of life satisfaction among single person households and older people.
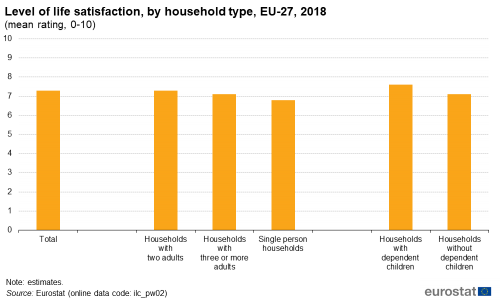
(mean rating, 0-10)
Source: Eurostat (ilc_pw02)
Young people tended to be less happy than the working-age population
In EU-SILC, happiness is measured by the following question: ‘How much of the time over the past four weeks have you been happy?’ This question was asked on a verbal five-point scale and can therefore not be directly compared with results for life satisfaction. That said, young people aged 16-24 years were generally less often happy than their elders of working-age.
As can be seen in Figure 17, more than three fifths (62.4 %) of young people aged 16-24 years reported being happy all or most of the time over the four-week period prior to the survey (conducted during 2018). This was lower than the corresponding shares recorded for all other age groups within the working-age population, as 64.6 % of those aged 50-64 years were happy all or most of the time, rising to 71.5 % among those aged 35-49 years and peaking at 75.6 % for those aged 25-34 years. By contrast, a smaller share of the elderly (65 years and over) were happy all or most of the time. It is also interesting to note that more than 1 in 10 persons aged 16-24 years stated that they were happy a little or none of the time; slightly higher double-digit shares were recorded among the elderly.

(%)
Source: Eurostat (ilc_pw08)
Figure 18 illustrates that people in two adult households (in many cases couples) were generally more likely to be happy all or most of the time than people living on their own and that people in households with children were generally more likely to be happy all or most of the time than people in households without children. In 2018, almost two thirds (64.2 %) of people living in EU-27 households with two adults and 59.1 % of people living in households with three or more adults declared that they were happy all or most of the time, compared with 50.5 % of single person households. The share of people in these three types of households who were never or rarely happy ranged from 9.5 % among households with two adults to 16.7 % for single person households. People in households with dependent children were more likely to be happy all or most of the time (63.1 %) and less likely to be never or rarely happy (7.0 %) than people in households without dependent children (58.9 % for all/most of the time and 12.1 % for never or rarely happy).
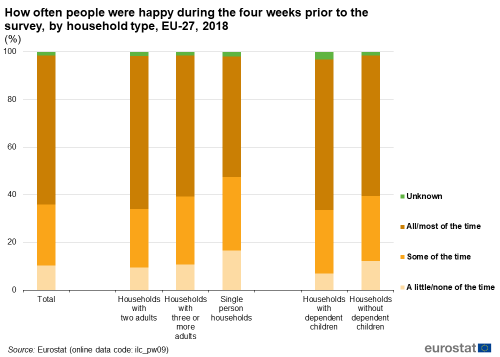
(%)
Source: Eurostat (ilc_pw09)
Young people’s participation in society
Social and political participation of young people is considered one means of encouraging a more inclusive and democratic society. The active participation of young people in decisions and actions locally, regionally, nationally and across the EU enhances their capacity to influence decision-making and allows them to contribute to building a better society.
Taking active part in democracy
The results of Special Eurobarometer No. 477 on democracy and elections, which was conducted in September 2018, indicate that more than half (52 %) of people aged 15-24 years in the EU-27 expressed a wish to be able to vote electronically or online if living abroad in another EU Member State at the time of a national election. A similar share (53 %) was recorded for people aged 25-39 years, while those aged 40 years and over were much less likely (33 %) to state that their preferred way of voting was electronically or online.
Figure 19 shows that while a majority of young people aged 15-24 years living in another EU Member State would prefer to vote in their national elections either electronically or online, more than one quarter (26 %) preferred to vote in an embassy or consulate, and more than one tenth (11 %) preferred to vote by post.

(%)
Source: Eurostat (demo_pjangroup) and Special Eurobarometer 477 — Democracy and elections 2018
In a Flash Eurobarometer survey (No. 478) conducted in March 2019, young people in the EU-27 were asked which topics should be a priority for the EU in the years to come. Among those aged 15-19 years, the most common topic for priority action was protecting the environment and fighting climate change (71 % agreed); note that respondents were allowed to give up to five different answers when questioned. There were two other topics that were priorities for the EU according to a majority of young people aged 15-19 years: fighting poverty and economic and social inequalities (59 %) and improving education and training (57 %). Figure 20 shows that a similar pattern was recorded across the EU-27 among young people aged 20-24 years and those aged 25-30 years, as a majority of these age groups also agreed that it was a priority for the EU to protect the environment and fight climate change, to fight poverty and inequalities, and to improve education and training. A majority (54 %) of those aged 25-30 years also agreed that boosting employment and tackling unemployment was a priority for the EU in the years to come.

(%)
Source: Eurostat (demo_pjan) and (demo_pjangroup) and Flash Eurobarometer 478 — How do we build a stronger, more united Europe 2019
Participating in organised activities can develop a person’s interest in political, social and civic issues (see Figure 21). Results from Flash Eurobarometer No. 478 indicate that a majority of young people aged 15-19 years in the EU-27 had got information on current issues from social media (62 %) or had participated in volunteering activities or local community projects (58 %). A majority of young people in the age groups for 20-24 years and 25-30 years also participated in both of these activities, although — unsurprisingly given age restrictions for voting — a higher share of young people in these two groups participated in voting in local, national or European elections.
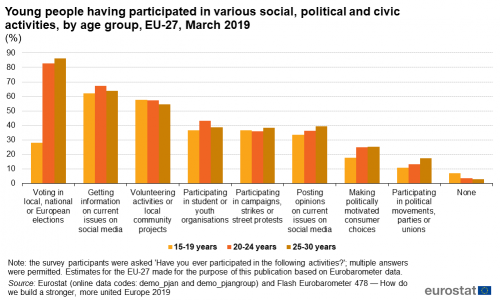
(%)
Source: Eurostat (demo_pjan) and (demo_pjangroup) and Flash Eurobarometer 478 — How do we build a stronger, more united Europe 2019
Figure 22 shows information on the proportion of young people in the EU-27 having participated in a range of different cultural and sporting activities or in active participation (for example, activism or political/local community organisations). In general, young people aged 15-19 years in the EU-27 were more inclined (than their elder counterparts) to take part in at least one of these activities in 2017; among other possible causes, this may reflect other priorities for somewhat older age groups as they move into the labour market or start a family. A relatively high share of young people aged 15-19 years participated in a sports club (45 %) or in a youth/leisure club or youth organisation (30 %); both of these shares were considerably higher than those recorded for young people aged 20-24 years or 25-30 years.
There was a much greater level of uniformity across the different age groups of young people in terms of their participation rates for the remaining activities that are presented in Figure 22. Participation levels were generally lower for cultural, community, activist or political organisations. For example, some 4-8 % of all young people in the EU-27 (within the three age groups shown) participated in organisations promoting human rights or global development or organisations for climate change or environmental issues. For older people, there was a greater likelihood that they did not participate in any of the cultural or active participation activities shown: while 35 % of young people aged 15-19 years did not participate in any of the activities, this share rose to more than half (52 %) among young people aged 25-30 years.

(%)
Source: Eurostat (demo_pjan) and (demo_pjangroup) and Flash Eurobarometer 455 — European youth 2017
In a Flash Eurobarometer survey (No. 478) conducted in August/September 2017, participants were asked if they had ever stayed abroad for the purpose of volunteering. More than 1 in 10 (11 %) young people aged 20-24 years stated that they had spent some time abroad for the purpose of volunteering. This share was somewhat higher than for young people aged 25-30 years (9 %) or for young people aged 15-19 years (5 %); note that a higher share of the youngest age group stated that they had not had the opportunity to volunteer. Among young people aged 20-24 years who had stayed abroad for the purpose of volunteering, the most common period spent volunteering was 2-4 weeks. Young people aged 25-30 years were more likely to have spent a period of more than one month abroad volunteering, whereas those aged 15-19 years were more likely to have spent a shorter period abroad volunteering (less than two weeks or 2-4 weeks).
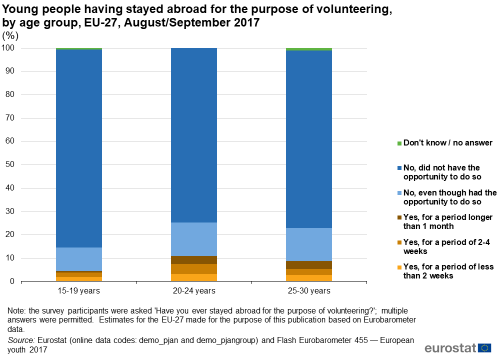
(%)
Source: Eurostat (demo_pjan) and (demo_pjangroup) and Flash Eurobarometer 455 — European youth 2017
Source data for tables and graphs
Data sources
The data used in this article are primarily derived from demography data that is collected by Eurostat on a range of issues related to population developments, household structure, non-national population stocks, marriages and fertility. Data are collected on an annual basis and are supplied to Eurostat by the national statistical authorities of the EU Member States.
In addition, the EU labour force survey (EU-LFS) covers a range of statistics on the number, characteristics and typologies of households. Under the specific topic ‘Family composition and household structure‘, the EU-LFS presents statistics on household composition, the number and size of households, as well as on the estimated age that young people leave the parental home. It should be noted that the survey covers only citizens living in private households and excludes those living in collective or institutional households. In order to provide a worldwide comparison for household structures, data from the UNECE database have also been used.
Figures on subjective well-being are derived from EU statistics on income and living conditions (EU-SILC). This source was used to provide data on life satisfaction and happiness.
Data from Eurobarometer surveys have been used to depict the situation concerning cultural, social and political participation by young people. Eurobarometer surveys are opinion surveys which address a wide range of topics, for example: EU enlargement, the social situation, health, culture, information technology, the environment, the euro, or defence issues.
Context
EU policies related to migration and the migrant population
In 2017, the European Commission published the EU Citizenship Report 2017. Moving and living freely within the EU is the right most closely associated with EU citizenship. Given modern technology and the fact that it is now easier to travel, freedom of movement allows EU citizens to expand their horizons beyond national borders, to leave their country for shorter or longer periods, to come and go between EU Member States to study and train, to travel for business or for leisure, to shop across borders or to look for work. Free movement potentially increases social and cultural interactions within the EU and closer bonds between EU citizens. In addition, it may generate mutual economic benefits for businesses and consumers, including those who remain at home, as internal obstacles are removed.
EU policies targeting subjective well-being
Measuring well-being has an inherent appeal. Promoting the well-being of people is one of the principal aims of the EU, as set forth by the Treaty on European Union. In the EU, a broad range of outcomes is considered when evaluating the objectives of social and economic policy, including subjective measures around the quality of life. Many international, EU and national bodies report on subjective well-being and publish associated reports going beyond gross domestic product (GDP) as the overall measure of societal performance.
Well-being began to appear more explicitly within the EU policy agenda in 2006 when the Council of the EU cited the well-being of present and future generations as its central goal within its European Sustainable Development Strategy. Soon after, the limits of GDP as a measure of well-being were increasingly discussed at an international level — for example, in the ’Beyond GDP’ initiative, which was followed by a Conference in the European Parliament in 2007. In 2009, the European Commission published its Communication on ’GDP and beyond — measuring progress in a changing world’ concluding that EU policies will be ultimately judged on whether or not they successfully deliver social, economic and environmental goals. For more information, see the European Commission website for Beyond GDP — measuring progress, true wealth, and well-being.
In the same year (2009), the Commission on the Measurement of Economic Performance and Social Progress (also known as the Stiglitz-Sen-Fitoussi Commission) published its report. This formed the basis for the work of the ESS (European Statistical System) Sponsorship Group on Measuring Progress, Well-being and Sustainable Development which published a report in 2011.
More recently, a High-Level Expert Group on the Measurement of Economic Performance and Social Progress (HLEG), attached to the OECD, was established. Its purpose is to follow-up on the recommendations of the Commission on the Measurement of Economic Performance and Social Progress and to provide impetus and guidance to the various initiatives on measuring people’s well-being and societies’ progress. In 2018, this group published Beyond GDP — Measuring What Counts for Economic and Social Performance which looked, among other issues, at the continued importance of the ‘Beyond GDP’ agenda and took stock of the situation since the release of the original report in 2009.
The European Commission addressed one particular aspect of the ‘Beyond GDP’ agenda when putting forward a process for renewed socioeconomic convergence within the EU, as outlined in the European Pillar of Social Rights that seeks to build a more inclusive and fairer EU based on 20 key principles. Alongside these developments, the EU also plays a key role in promoting sustainable development, both globally and within the EU. Environment policy within the EU rests on the principles of precaution, prevention and rectifying pollution at source. Legislation aims to ensure that people within the EU can live within the planet's ecological limits. Such developments are centred on an innovative, circular economy, where biodiversity is protected, valued and restored, for example, by decoupling growth from resource use.
Direct access to
- Population (t_demo_pop)
- Fertility (t_demo_fer)
- Immigration (t_migr_immi)
- Acquisition and loss of citizenship (t_migr_acqn)
- Marriages and divorces (t_demo_nup)
- Population (demo_pop)
- Fertility (demo_fer)
- Immigration (migr_immi)
- Acquisition and loss of citizenship (migr_acqn)
- Marriages and divorces (demo_nup)
- LFS series - Specific topics (lfst)
- Youth (yth), see:
- Youth population (yth_demo)
- Youth social inclusion (yth_incl)
- Youth - culture and creativity (yth_cult)
- Youth participation (yth_part)
- Youth volunteering (yth_volunt)
- Acquisition and loss of citizenship (ESMS metadata file — migr_acqn_esms)
- Fertility (ESMS metadata file — demo_fer_esms)
- Households statistics — LFS series (ESMS metadata file — lfst_hh_esms)
- Marriages and divorces (ESMS metadata file — demo_nup_esms)
- Population (ESMS metadata file — demo_pop_esms)
Notes
- ↑ ‘Choices and planning. Entre Nous No. 79’, World Health Organisation (see https://www.euro.who.int/en/health-topics/Life-stages/sexual-and-reproductive-health/publications/entre-nous/entre-nous/choices-and-planning.-entre-nous-no.-79).
