International trade in services by partner
Data extracted in July 2023.
Planned article update: August 2024.
Highlights
In 2021, 22.3 % of EU exports of services were destined for the United States, while 34.5 % of EU imports of services originated in the United States.
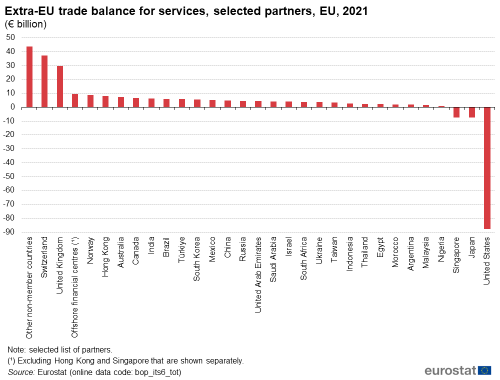
The EU’s largest trade surplus for services in 2021 was recorded with Switzerland (€37 billion).

(€ billion)
Source: Eurostat (bop_its6_tot)
Globalisation patterns in EU trade and investment is an online Eurostat publication presenting a summary of recent European Union (EU) statistics on economic aspects of globalisation, focusing on patterns of EU trade and investment.
This article looks in more detail at the EU’s principal partners for international trade in services. Trade intensity is thought to be related to geographic distance: this may be particularly true for some services due to their intangible, non-transportable nature which restricts opportunities for exchange. Alongside geographical distance, there are other barriers which impact/prevent trade in services, for example, linguistic or cultural ‘distance’. On the other hand, digitalisation and new technologies have permitted new business models for delivering services across borders and over larger distances. This article looks in more detail at the EU’s principal partners for international trade in services.
The analyses of trade by partner are based on a fixed list of countries: Argentina, Australia, Brazil, Canada, China, Egypt, Hong Kong, India, Indonesia, Israel, Japan, Malaysia, Mexico, Morocco, Nigeria, Norway, Russia, Saudi Arabia, Singapore, South Africa, South Korea, Switzerland, Taiwan, Thailand, Türkiye, Ukraine, the United Arab Emirates, the United Kingdom and the United States, as well as offshore financial centres.
Full article
Focus on EU trade in services by partner
In 2021, 22.3 % of EU exports of services were destined for the United States
The EU exported services to non-member countries that were valued at €1 067 billion in 2021. Figure 1 shows that the EU’s main export markets were the United States and the United Kingdom, which each accounted for approximately one fifth (22.3 % and 19.2 %; €238 billion and €205 billion) of the EU’s services exports. The next largest shares were recorded for Switzerland (10.8 %), followed at some distance by China (5.5 %).

(% of extra-EU total)
Source: Eurostat (bop_its6_tot)
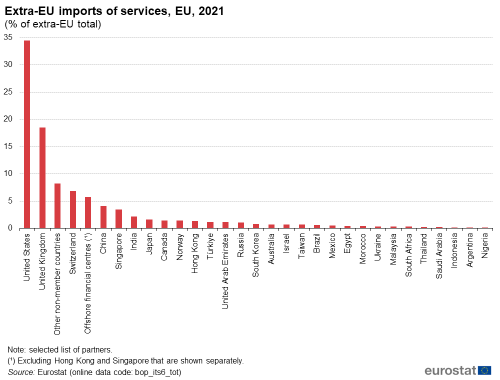
In 2021, 34.5 % (or €326 billion) of EU imports of services originated in the United States
Imports of services from non-member countries into the EU were valued at €945 billion in 2021. Figure 2 shows that the United States was, by far, the principal origin of extra-EU imports, accounting for approximately one third (34.5 %; €326 billion) of the EU’s imports. The next highest shares were recorded for the United Kingdom (18.5 %), Switzerland (6.8 %) and offshore financial centres (5.7 %) [1].

(% of extra-EU total)
Source: Eurostat (bop_its6_tot)
During the period from 2011 to 2021, a growing proportion of the EU’s exports of services was destined for the United States, its share of the total rising from 17.7 % to 22.3 % (up by 4.6 percentage points); the relative importance of EU exports to China increased by 2.4 points, while Hong Kong and Singapore also saw their shares rise by more than 0.5 points.
A comparable analysis for the development of services imports reveals there was a greater shift in the structure of EU trade between 2011 and 2021, as the proportion of EU imports of services that originated in the United States rose from 23.7 % to 34.5 % (up 10.8 percentage points). The relative importance of EU imports that originated in Singapore increased by 1.6 points, while China (up 0.9 points) was the only other country (among those selected) to register an increase of at least 0.5 points. This analysis also confirms a pattern of increasing concentration, insofar as a growing proportion of the EU’s trade in services was with its principal trading partners (which were predominantly developed world economies). This is an interesting distinction when compared with international trade in goods, where globalisation has resulted in a diversification of trading partners (as emerging and developing countries have captured market shares).
The EU’s largest trade surplus for services in 2021 was recorded with Switzerland
In 2021, the EU’s largest trade surplus for services was recorded with Switzerland (€37 billion); the EU also ran a sizeable surplus for trade in services with the United Kingdom (€30 billion). Among the 30 specific trading partners shown in Figure 3, the EU ran a deficit for trade in services with just three. By far the largest deficit was recorded for trade with the United States (€88 billion), while the other principal trading partners that were net exporters of services to the EU in 2021 included Japan (€8 billion)and Singapore (€7 billion).

(€ billion)
Source: Eurostat (bop_its6_tot)
Focus on trade in services for individual EU Member States
Having examined extra-EU trade flows for services, this next section presents more detailed information relating to individual EU Member States. Note that the data presented for the Member States cover total trade (in other words, intra-EU and extra-EU trade flows combined), while the data for the EU as a whole concern extra-EU trade only.
A relatively high proportion of trade in services was between neighbouring countries
The top three partners for trade in services for each of the EU Member States are shown in Table 1 (for exports) and Table 2 (for imports). As the EU’s largest economy, and with its relatively central location, it is not surprising to find that Germany was the leading export destination for trade in services among 15 Member States in 2021; five of these shared a border with Germany. The United States was the largest export market for services from six Member States (including both Germany and France). France was the biggest export market for services from two Member States while the Netherlands, Finland, Sweden and Russia each appeared once in the ranking of principal export markets. These were generally characterised by their close proximity to the reporting country, with exceptions such as France as the leading export market for Portugal and Russia as the leading export market for Cyprus.

Source: Eurostat (bop_its6_tot)
Table 2 shows a similar set of information for imports. In 2021, Germany was the principal origin of services imports for 11 of the EU Member States, followed by the United States (which was the principal origin of imports for six Member States) and offshore financial centres (which was the main origin of imports for two of the Member States). As for exports, there were often high levels of trade in services between neighbouring countries and those which were culturally or linguistically aligned but with notable exceptions such as Ireland as the largest partner for Latvia and Slovenia as the largest partner for Portugal. Otherwise, it is interesting to note that offshore financial centres were among the top three origins of services imports in several of the EU Member States, namely Greece, Cyprus, Malta, Bulgaria and Ireland.

Source: Eurostat (bop_its6_tot)
In 2021, some of the largest bilateral surpluses and deficits for trade in services concerned a range of countries considered among the world’s leading financial centres
This article closes with an analysis of the largest bilateral trade surpluses and deficits for services (see Table 3); it is based on EU Member States as the reporting entity and a fixed list of 30 partner countries. Many of the largest bilateral surpluses and deficits for trade in services in 2021 concerned a range of countries that are considered among the world’s leading financial centres – for example, Ireland, Luxembourg, the United States, the United Kingdom, Switzerland, Singapore and (other) offshore financial centres.
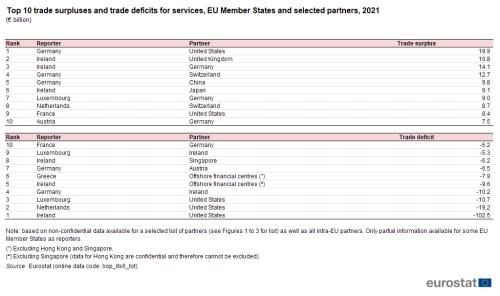
In 2021, the biggest trade surplus for services was recorded by Germany for its trade in services with the United States (€19.9 billion). There were three other bilateral trade surpluses for services that were valued at more than €10.0 billion: Irish trade with the United Kingdom (€16.8 billion) and with Germany (€14.1 billion) and German trade with Switzerland (€12.7 billion).
Asymmetries in trade
Asymmetries between ‘mirror data’ are a common issue of all trade statistics. Asymmetries occur when the reported data by one country do not correspond to the mirror data reported by the partner country.
For example, country A reports exports of 100 machines to country B, and country B reports imports of 60 machines from country A. Typical reasons for asymmetries are:
- differences in the specific methodology used,
- differences in the population (samples),
- errors in the geographical allocation,
- other aspects, such as outdated coefficients or weights, and biased estimations.
An example of an asymmetry is shown in Table 3, as Ireland recorded a trade surplus for services with Germany valued at €14.1 billion, while the German trade deficit for services with Ireland was valued at €10.2 billion.
Asymmetries create problems for users, as in the absence of any other information they cannot be sure which of the two asymmetrical values should be used. Eurostat regularly measures and reports on bilateral asymmetries to help with this issue.
In March 2022, Eurostat launched an asymmetry resolution mechanism (ARM) for international trade in services statistics. The mechanism aims to directly address the most important asymmetries among the data of EU Member States. The ARM complements other activities that are going on in parallel, such as regular quality reporting and ongoing methodological work.
In 2021, the three largest bilateral trade deficits for services were all with the United States
As noted in the overview article on trade in services, Ireland accounted for the highest share (26.5 %) of the EU’s imports of services from non-member countries in 2022; this may be expected to feed through into trade deficits with a range of partners. Detailed information on trade in services by partner is only available for 2021. These show that Ireland had 3 of the 10 largest bilateral trade deficits for services:
- by far the largest, was the Irish trade deficit with the United States, valued at €102.5 billion;
- Ireland also had a deficit of €9.6 billion with offshore financial centres (other than Hong Kong and Singapore) and a deficit of €6.2 billion with Singapore.
The second and third highest bilateral deficits in 2021 were also with the United States: the Netherlands had a deficit of €19.2 billion with the United States while Luxembourg’s deficit with the United States was €10.7 billion.

(€ billion)
Source: Eurostat (bop_its6_tot)
Source data for tables and graphs
Notes
- ↑ The aggregate for offshore financial centres includes European countries such as Andorra, the Isle of Man and Liechtenstein, as well as financial centres that are further afield – principally these are located in and around the Caribbean. The full list of countries and territories is: Andorra, Antigua and Barbuda, Anguilla, Aruba, Barbados, Bahrain, Bermuda, Bahamas, Belize, Cook Islands, Curaçao, Dominica, Grenada, Guernsey, Gibraltar, Hong Kong, Isle of Man, Jersey, St Kitts and Nevis, Cayman Islands, Lebanon, Saint Lucia, Liechtenstein, Liberia, Marshall Islands, Montserrat, Mauritius, Nauru, Niue, Panama, Philippines, Seychelles, Singapore, Sint Maarten, Turks and Caicos Islands, Saint Vincent and the Grenadines, Virgin Islands, British, Virgin Islands (United States), Vanuatu, and Samoa. Note that for the purpose of this publication, data for Hong Kong and Singapore are shown separately and have been systematically removed from the aggregate covering offshore financial centres.
Direct access to
Metadata
- Balance of payments – international transactions (BPM6) (ESMS metadata file – bop_6_esms)
Further methodological information