International trade in goods by type of good
Data extracted in June 2023
Planned article update: July 2024
Highlights
In 2022, machinery and transport equipment accounted for 37 % of all goods exported from the EU and for 27 % of all goods imported into the EU.
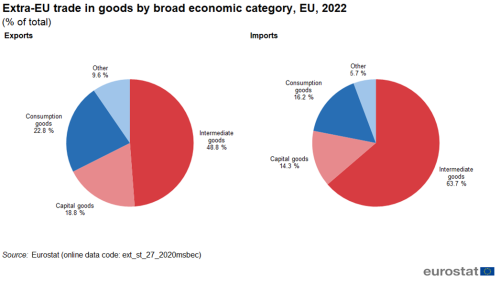
(% of total)
Source: Eurostat (ext_st_27_2020msbec)
Globalisation patterns in EU trade and investment is an online Eurostat publication presenting a summary of recent European Union (EU) statistics on economic aspects of globalisation, focusing on patterns of EU trade and investment.
This article examines in more detail the different types of goods that are traded between nations. Globalisation, falling trade costs and technological progress are thought to have driven the international fragmentation of production and the development of international production/supply chains. These changes to the way in which goods (and services) are produced, has resulted in manufacturing processes being split into different stages so that intermediate inputs may be sourced from the most efficient producers, even if they are spread across disparate locations. As a result, the relative importance of intermediate goods - the inputs which connect different production stages together - as a share of total trade has risen at a rapid pace.
Full article
International trade in goods - developments by broad economic category
Statistics on international trade in goods by broad economic category (BEC)
As global production chains have developed into complex production networks it has become increasingly difficult, from a statistical perspective, to measure where specific (end) goods are made and by whom. Indeed, an analysis of international trade developments based on gross measures has become less accurate, as intermediate goods (parts and components) may be counted several times as they cross borders to be used at various stages of the manufacturing process.
The classification of international trade statistics by broad economic category (BEC) is managed by the United Nations. These statistics permit the conversion of international trade data based on the standard international trade classification (SITC) into end-use categories. At its most detailed level, the BEC classification has 19 categories that can be aggregated to approximate the three basic types of goods (capital, intermediate and consumption goods); this makes it easier to analyse international trade statistics alongside other types of general economic statistics, such as national accounts.
The share of intermediate goods in all extra-EU imports peaked in 2011-2012
Figure 1 shows the development of the share of intermediate goods in total trade for the EU over the period covering 2002-2022. Prior to the global financial and economic crisis, trade in intermediate goods was an important driver of overall trade, as witnessed through their increasing share of total trade up until 2008. This was particularly true for extra-EU imports, suggesting that EU manufacturers had a relatively high propensity to import parts and components from non-member countries; there was also an increase in the relative share of intermediate goods among intra-EU exports.
The crisis had a considerable impact not only on the value of trade in intermediate goods, but also resulted in a declining share of intermediate goods in total trade. Thereafter, there was a relatively swift recovery and the share of intermediate goods in total trade continued to rise, peaking in 2011 at 66.0 % for extra-EU imports and 49.1 % for extra-EU exports while for intra-EU export they peaked one year later at 56.1 %. Between those years and 2016 the shares fell but in 2017 they rose again. In 2022 they stood at 63.7 % for extra-EU imports and 48.8 % for extra-EU exports while for intra-EU exports they were 54.8 %. It should be noted that price fluctuations of energy products have a substantial impact on the share of trade in intermediate goods.

(%)
Source: Eurostat (ext_st_27_2020msbec)
The predominance of intermediate goods in total trade is shown in Figure 2. Across the EU, intermediate goods accounted for just less than half (48.8 %) of all goods that were exported in 2022; as noted above, the corresponding share for imports was higher, at 63.7 %. For comparison, capital goods (18.8 %) and consumption goods (22.8 %) each accounted for around a fifth of all exported goods. In imports the shares of capital goods (14.3 %) and consumption goods (16.2 %) were lower than in exports.

(% of total)
Source: Eurostat (ext_st_27_2020msbec)
Shares of intermediate products in total trade vary considerably among Member States
In 2022, a majority of the EU Member States reported that intermediate goods contributed more than half of their total trade in value terms, both for imports (24 Member States) and exports (19 Member States); note these were not the same Member States for each trade flow (see Figures 3 and 4). The share of intermediate goods in total exports was over 60 % in Luxembourg (67.0 %), Belgium (66.7 %), Ireland (65.6 %), Bulgaria (64.4 %), Croatia (64.0 %), Finland (63.6 %), Romania (62.4 %), Latvia (61.4 %), Greece (61.3 %) and Estonia (60.3 %) and below 40 % only in Cyprus (27.5 %). The share of intermediate goods in total imports was highest in Belgium (68.8 %), Greece (65.8 %), Italy (65.6 %), Bulgaria (65.3 %) and Hungary (65.1 %), while only Denmark (49.3 %), Cyprus (43.7 %) and Malta (43.6 %) had shares below 50 %.
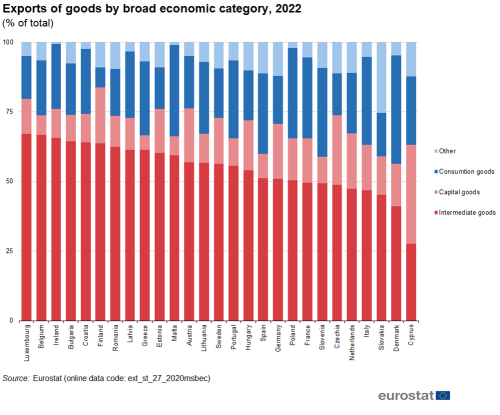
(% of total)
Source: Eurostat (ext_st_27_2020msbec)

(% of total)
Source: Eurostat (ext_st_27_2020msbec)
International trade in goods - developments for key product groups
Historically, the biggest shifts in international trade by product resulted in a marked decline in the relative contribution of agricultural products to total trade, while the share of manufactured goods increased. When asked to picture globalisation today, many people are likely to imagine a cargo ship transporting large quantities of manufactured goods to distant markets on the other side of the world. A closer examination reveals that the bulk of international trade in goods is relatively concentrated within some key product groups, while there are many goods where the level of international trade remains quite low. Indeed, as noted in the article International trade in goods for the EU - an overview, the intrinsic nature of some goods (for example, those with a limited shelf-life or those that are bulky) means that they are principally consumed within domestic or neighbouring markets.
In 2022, machinery and transport equipment accounted for €952 billion or 37 % of all goods exported from the EU.
Figure 5 shows the development of extra-EU exports for the top level headings from the standard international trade classification (SITC). One of the most striking aspects is the high value of machinery and transport equipment, which was €952 billion in 2022 (37.0 % of all exports). The next highest values were recorded for other manufactured goods (€571 billion, 22.2 %) and chemicals and related products (€553 billion, 21.5 %), while food, drinks and tobacco (€204 billion, 7.9 %), mineral fuels, lubricants and related materials (€180 billion, 7.0 %) and raw materials (€76 billion, 3.0 %) accounted for much lower shares.
Looking at developments during the period 2002-2022, the impact of the global financial and economic crisis in 2009 and the COVID-19 crisis in 2020 on the different product headings is evident. In 2009 exports decreased sharply for all product groups. By comparison, in 2020 exports of chemicals, food, drinks and tobacco and raw materials were much less impacted than exports of machinery and transport equipment, other manufactured goods and mineral fuels. A comparison of developments for EU exports between 2002 and 2022 reveals that in absolute terms machinery and transport equipment (+ €495 billion) increased the most. In relative terms its value was 2.1 times as high as in 2002, which was similar to the growth of other manufactured goods but much lower that mineral fuels which in 2022 were 7.5 times as high as in 2002. By comparison the exports values in the other three groups in 2022 were between 3.2 and 3.6 times as much as in 2002.

(billion EUR)
Source: Eurostat - Comext DS-018995
A-typical development for imports of mineral fuels, lubricants and related materials due to fluctuation of oil prices
Complementary information on developments for EU imports is presented in Figure 6 (based on the same product headings). Due to sharply increasing prices mineral fuels, lubricants and related materials became the largest product group in imports (€831 billion, 27.7 % of all imports). It was followed by machinery and transport equipment (€825 billion, 27.5 %) and other manufactured goods (€663 billion, 22.1 %) All products follow the same pattern, a decline in 2008 followed by a recovery in the following years. The COVID-19 pandemic caused a large drop in 2020 but a strong recovery followed in 2021 and 2022. Over the whole period, imports of mineral fuels increased most (+ €678 billion), followed by machinery and transport equipment (+ €487 billion) and other manufactured goods (+ €437 billion). In relative terms mineral fuels increased the most, being 5.4 times as large in 2022 than in 2002.

(billion EUR)
Source: Eurostat - Comext DS-018995
Figure 7 shows the shares by product heading in extra-EU exports and extra-EU imports in 2022. As the total value of EU exports (€2 573 billion) was lower than imports (€3 002 billion), there was a deficit of €430 billion representing 7.7 % of total extra-EU trade. Figure 7 identifies those product headings where the EU had a trade surplus with non-member countries, for example, chemicals and related products (€190 billion) or a trade deficit, for example, mineral fuels (€650 billion).

(% of EU total)
Source: Eurostat - Comext DS-018995
International trade in goods - focus on selected product groups
This final section in this article looks in more detail at international trade developments for a selected group of specific products, where globalisation has had a significant impact on industrial structure and conduct:
- medicinal and pharmaceutical products (SITC 54);
- iron and steel (SITC 67);
- motor cars (SITC 781);
- articles of apparel and clothing accessories (SITC 84).
The share of these four selected products in extra-EU trade is presented in Figure 8. Between 2002 and 2022 the share for medicinal and pharmaceutical products in total exports rose by 6.1 percentage points (pp), while the shares for the other three fell slightly. For imports, the share for medicinal and pharmaceutical products in total exports rose only by 0.3 pp, slightly less than the increase for motor cars (0.6 pp). The other two products each dropped slightly. These changes should be interpreted with caution as they are the result of a combination of changes in quantities as well as changes in prices.
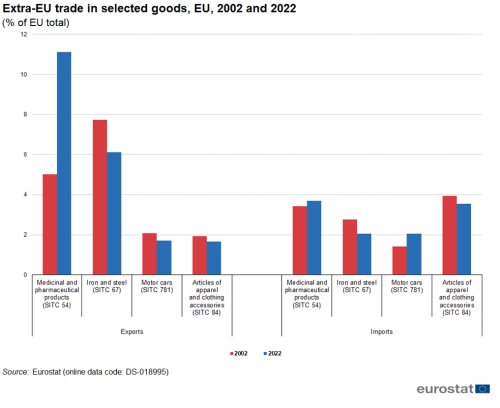
(% of EU total)
Source: Eurostat - Comext DS-018995
Medicinal and pharmaceutical products
Extra-EU exports of medicinal and pharmaceutical products were valued at €286 billion in 2022, compared with extra-EU imports of €111 billion; as such, the EU had a trade surplus of €175 billion. According to the European Commission’s Directorate-General for Trade, the most common trade impediments faced by pharmaceutical exporters are a range of burdensome and costly registration, licensing and certification procedures; the EU aims to redress these through its bilateral trade agreements or by tackling individual barriers as part of its market access partnerships.
The United States was the EU’s main trading partner for exports of medicinal and pharmaceutical products (see Figure 9). Just below one third (32.6 %) of EU exports in 2022 were destined for the United States; slightly higher than in 2002, when the United States accounted for a 30.9 % share of the EU’s exports of medicinal and pharmaceutical products. The next largest EU export markets were Switzerland (12.9 % of all exports in 2022), the United Kingdom (7.2 %) and China (5.9 %).
Imports of medicinal and pharmaceutical products into the EU were even more dominated by the EU’s main trading partners, as almost four fifths of the goods imported in 2022 originated from the United States (35.4 %), Switzerland (34.0 %) and the United Kingdom (9.1 %) combined; the next highest share was recorded for imports originating in China (5.2 %).
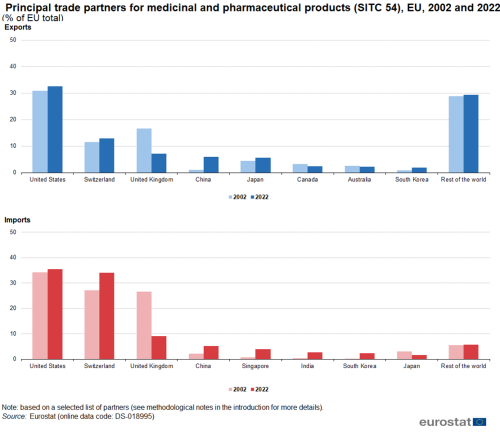
(% of EU total)
Source: Eurostat - Comext DS-018995
Among the EU Member States in 2022, extra-EU exports of medicinal and pharmaceutical products were relatively concentrated in Germany (23.9 % of the EU’s exports), Belgium (19.7 %), Ireland (14.6 %) and the Netherlands (7.5 %); Germany, Belgium and Ireland had the United States as their main export destination while Germany was the main export destination for the Netherlands (see Table 1). For Ireland, medicinal and pharmaceutical products made up almost a two fifths (38.9 %) of their total exports.
Belgium (18.7 %), Germany (17.5 %) and the Netherlands (16.1 %) recorded the highest shares of extra-EU imports of medicinal and pharmaceutical products in 2022, and were the only EU Member State with double-digit shares (see Table 2).

Source: Eurostat - Comext DS-018995

Source: Eurostat - Comext DS-018995
Iron and steel
The iron and steel industry is often seen as being of strategic importance. In the last couple of decades there has been a pattern of industrialised nations relocating some of their iron and steel production facilities to developing countries; this has been driven, at least in part, by a desire to relocate production facilities closer to coal and iron ore supplies.
At the same time as the quantity of iron and steel production was falling in the EU (with output being refocused on high-end products), there was widespread investment in new plants across China; indeed, according to the world steel association, by 2022 China was producing more than half of the world’s steel output (see the publication World steel in figures 2022 from the website of the World steel association, July 2023). The other leading global producers of steel include the EU, India, Japan and the United States.
Alongside a rapid shift in global output of iron and steel, there were also major changes to trade patterns. These were particularly evident during the last few years, as Chinese economic growth slowed, resulting in excess Chinese capacity being redirected to foreign markets. In 2002, China accounted for just 2.1 % of the EU’s imports of iron and steel. By 2022 the share of EU imports originating from China had jumped to 12.0 % becoming the largest origin for imports of iron and steel ahead of Turkey (10.4 %), India (9.3 %) and Russia (9.1 %). The share for the top 8 import partners rose from 56.9 % in 2002 to 65.1 % in 2022 (see Figure 10).
Between 2002 and 2022 a growing share of EU exports of iron and steel were destined for Turkey (its share rising from 5.1 % in 2002 to 9.1 % in 2022), Switzerland (from 6.5 % in 2002 to 9.0 % in 2022), Mexico (from 3.0 % in 2002 to 4.5 % in 2022) and China (from 5.0 % in 2002 to 5.5 % in 2022). The United States (20.4 %) and the United Kingdom (13.2 %) were the EU’s main export destinations.
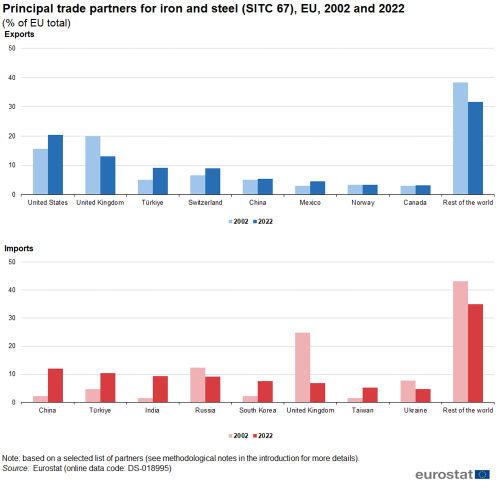
(% of EU total)
Source: Eurostat - Comext DS-018995
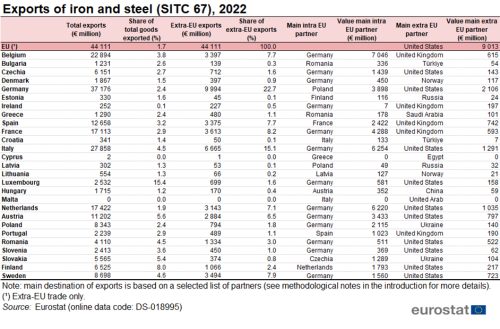
The EU had a trade deficit of 17.4 billion in 2022. In 2022, the leading exporter among the EU Member States (based on total trade, in other words, intra-EU and extra-EU flows) was Germany (€37.2 billion), followed by Italy (€27.9 billion) and Belgium (€22.9 billion). It is interesting to note that iron and steel products accounted for 15.4 % of all goods exported from Luxembourg in 2022, the next highest share being recorded in Finland (8.0 % of total exports) - see Table 3.
Extra-EU iron and steel imports into the EU from non-member countries were valued at €61.6 billion in 2022. Table 4 shows that Germany had the highest value (€39.2 billion) of iron and steel imports among the EU Member States (based on total trade, in other words, intra-EU and extra-EU flows), followed by Italy (€29.9 billion) and France (€18.4 billion). Germany and Italy were the main origin of iron and steel imports for a large number of Member States while there were also several Member States reporting that their principal origin of imports was a neighbouring country.
Motor cars
The car industry has undergone a considerable change in recent years, with increased production from new producers in emerging markets, while traditional car manufacturers have faced structural issues associated with falling domestic sales and overcapacity. The industry remains dominated by a small number of global players who tend to have a presence on most continents as a result of takeovers, joint ventures, alliances and other forms of collaboration. The car industry is often seen as a pioneer for new methods of industrial organisation and is a leading exponent of global value chains, sourcing intermediate inputs from around the world and delivering these ‘just-in-time’ for assembly.
While car production has diversified geographically, Europe’s automotive industry is concentrated in the hands of a small number of groups, including Volkswagen, Daimler, BMW, Fiat Chrysler, PSA and Renault. It should also be noted that overseas carmakers have a considerable presence manufacturing cars within the single European market, for example: General Motors in Germany and Austria; Ford in Spain; or Hyundai in Czechia. It is important to note that the statistics presented below relate to imports and exports of motor cars between national territories, regardless of the ownership of the production facilities where these cars are made.
The EU is the world’s largest car exporter, and the industry’s export orientation is underscored by its growing trade surplus, which reached €96 billion in 2022 (while at the same time the EU had a deficit of €430 billion for total goods). Increasing exports of motor cars to established and emerging markets may be viewed as a response by Europe’s carmakers to address the issue of falling domestic demand.
In 2022, the United States (23.1 % of the total) and the United Kingdom (16.9 %) were the main destinations for EU exports of motor cars, while China (15.4 %) was the third highest destination - see Figure 11. It is interesting to note that, while the share of EU exports destined for the United States and the United Kingdom declined by 6.4 pp and 17.5 pp respectively between 2002 and 2022, the share of exports destined for China rose by 14.1 pp.
Almost four fifths of the EU’s imports of motor cars in 2022 originated from six countries: China (15.2 % of the total), the United Kingdom (14.8 %), the United States (14.0 %), South Korea (12.7 %), Japan (12.3 %) and Turkey (10.2 %). It is interesting to note the rapid decline in the share of EU motor car imports that originated from Japan (-19,5) and the United Kingdom (-19.9 pp). These developments reflect the establishment of Japanese manufacturing bases within the EU, and also the growing shares of China (+15.2 pp), Mexico (+6.8 pp) and Turkey (+ 6.7 pp).
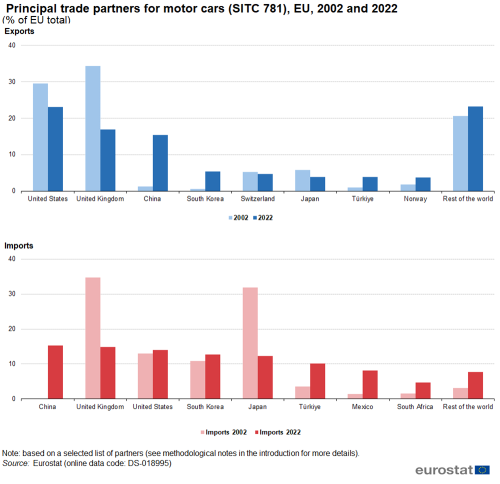
(% of EU total)
Source: Eurostat - Comext DS-018995
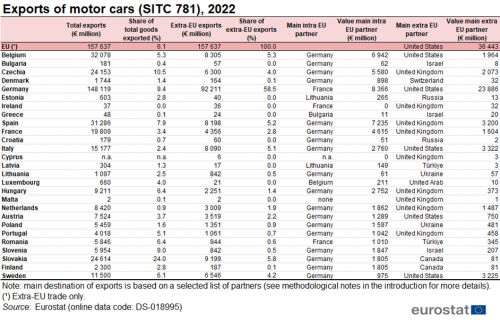
Germany was, by far, the leading exporter of motor cars among the EU Member States in 2022 (see Table 5). Almost three fifths (58.5 %) of all cars exported from the EU originated from Germany, far ahead of Slovakia (5.8 %), Belgium (5.3 %), Spain (5.2 %) and Italy (5.1 %) ; none of the remaining Member States accounted for more than 5.0 % of exports. The United States was the main market for cars exported from Germany, while Germany was the largest export partner for a majority of the Member States.
Germany was also the largest importer of motor cars among the EU Member States in 2022 (see Table 6); it accounted for 32.1 % of imports from outside the EU, followed by Belgium (24.6 %). The largest share of German imports originated from Spain, while Germany was the main origin of imports for Belgium and a large majority of other Member States.
Apparel and clothing accessories
The apparel and clothing accessories industry is another interesting case-study in terms of the impact of globalisation. It is characterised by distant supply chains, with subcontractors manufacturing large quantities of mass-produced clothing (often with very low labour costs); even high-end production, such as designer clothes, are predominantly manufactured away from their country of design, although their manufacture may be closer to home (for example, in other European countries with lower labour costs).
Consumers are generally considered to have benefited from the impact of globalisation in the clothing industry, as prices have been kept extremely low and a wide-range of ever-changing fashions are rapidly made available on the high street. On the other hand, the relocation of the clothing industry towards emerging and subsequently developing economies, principally in Asia, led to widespread job losses in Europe (and North America).
As with the iron and steel industry, the clothing sector is also characterised by overcapacity, which some manufacturers may use to their advantage in order to apply downward pressure on prices agreed with subcontractors. While China and India were at the forefront of the initial relocation of the clothing industry, the situation has subsequently evolved, with India specialising in high-end textiles and Chinese investment often being directed towards establishing new manufacturing facilities in countries such as Bangladesh, Sri Lanka, Vietnam, Laos or Cambodia.
China was the main origin of EU imports for articles of apparel and clothing accessories, its share of the EU import market rose from 23.4 % in 2002 to 30.4 % in 2022 (see Figure 12); Turkey was the only other partner to record a double-digit share (10.9 %), while India (4.8 %) had the third highest share. A relatively high share of EU imports (48.5 %) originated from the rest of the world, suggesting that the manufacture of clothing was being relocated to a wide range of developing countries.

(% of EU total)
Source: Eurostat - Comext DS-018995
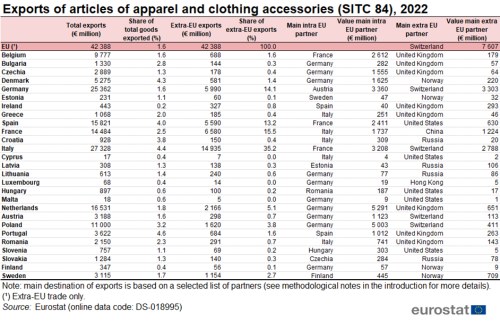
In 2022, the EU ran a large trade deficit (€64 billion) for articles of apparel and clothing accessories. The principal export markets for EU Member States were other Member States or nearby non Member States such as Russia (for Latvia and Lithuania), Norway (for Sweden) and the United Kingdom (for Ireland). Portugal (4.6 %) was the Member State with the highest share for articles of apparel and clothing accessories in total exports (see Table 7).
Source: Eurostat - Comext DS-018995
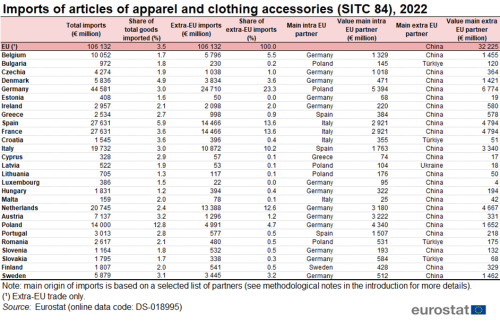
China was the main origin of apparel and clothing accessory imports for eleven of the EU Member States, including Germany, France, Spain, the Netherlands and Italy which were the only Member States to import more than €10 billion of apparel and clothing accessory from countries outside the EU, in 2022 (see Table 8). When considering only extra-EU partners, China was the main origin for 22 of the EU Member States.
Source: Eurostat - Comext DS-018995
Source data for tables and graphs
Direct access to
- International trade in goods - aggregated data
- International trade in goods - long-term indicators
- International trade in goods - detailed data
- International trade in goods (ESMS metadata file - ext_go_agg_esms)
