Farms and farmland in the European Union - statistics
Data extracted in November 2022.
Planned article update: 24 November 2025.
Highlights
(%, 2020)
Source: Eurostat (ef_m_farmleg)
The EU's farms are numerous and varied; they are of all sizes, varied in terms of what is grown or animals that are reared, run under different management structures and found in areas that have different geologies, topographies and climates.
Full article
Farms in 2020
There were 9.1 million agricultural holdings in the EU in 2020
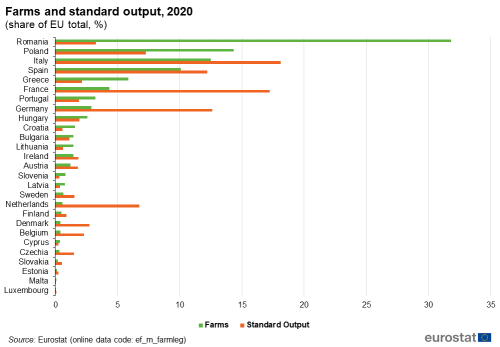
In 2020, there were 9.1 million agricultural holdings in the EU, of which 2.9 million holdings (the equivalent of 31.8 %) were located in Romania. There were more than twice the number of farms in Romania as the next Member State; there were 1.3 million farms in Poland (the equivalent of 14.4 % of the EU total), with 1.1 million farms in Italy (12.5 %) and 0.9 million in Spain (10.1 %).
The vast majority of the EU's farms are family farms
The overwhelming majority (94.8 % in 2020) of the EU's farms are classed as being family farms, defined as being farms on which 50 % or more of the regular agricultural labour force is provided by family members. Family farms were the dominant farm type in all Member States. However, France had a sizeable minority of non-family farms (42.3 % of its 0.4 million farms) along with Estonia (33.8 %).
Most of the EU's farms are small in nature
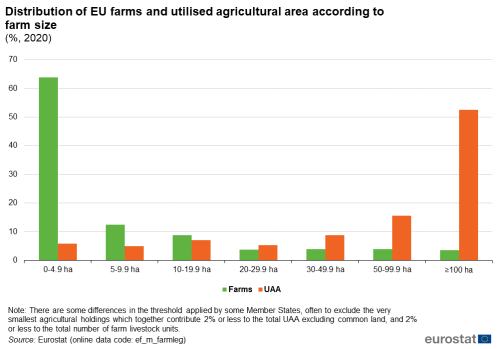
Almost two-thirds of the EU's farms were less than 5 hectares (ha) in size in 2020 (see Figure 1). These small farms can play an important role in reducing the risk of rural poverty, providing additional income and food. At the other end of the production scale, 7.5 % of the EU's farms were of 50 ha or more in size and worked two-thirds (68.2 %) of the EU's utilised agricultural area (UAA). So although the average mean size of an agricultural holding in the EU was 17.4 ha in 2020, only an estimated 18 % of farms were this size or larger.

(%, 2020)
Source: Eurostat (ef_m_farmleg)
This distribution pattern was particularly clear in Romania, the Member State with the highest number of farms; nine in every ten farms (90.3 % or 2.6 million farms) were smaller than 5 ha, but the 0.9 % of farms of 50 ha or more in size farmed a little over one half (54.0 %) of all the UAA in the country. Small farms of under 5 ha were also typical in Malta (96.6 % of the total), Cyprus (87.5 %), Greece (74.0 %), Portugal (73.4 %), Croatia (70.6 %), Hungary (64.9 %) and Bulgaria (64.0 %), as well as in particular regions of others such as the southern parts of Poland and coastal regions of Spain and Italy. The number of small farms in certain Member States and regions reflects a mixture of crop specialisation (such as small olive groves and vineyards), of wide land ownership, and geological and topographical constraints.
Larger farms (of 50 hectares or more) were much more common in Luxembourg (52.7 % of farms), France (46.0 %), Finland (33.3 %), Germany (31.5 %) and Denmark (30.9 %). In most Member States, a majority of UAA was concentrated on the largest farms (50 ha or more in size). Indeed, the largest farms in Czechia (27.8 % of the total) and in Slovakia (17.9 % of the total) accounted for as much as 92-93 % of the respective utilised agricultural areas, the highest proportions among Member States.
EU farms can be characterised in three distinct size groups
Broadly-speaking, there are three distinct groups of farms in the EU: (i) semi-subsistence farms, where the focus is on growing a high proportion of food to feed farmers and their families (ii) small and medium-sized farms that are generally family-run businesses and (ii) large agricultural enterprises which are more likely to have a legal form or be cooperatives.
These distinctions are made clearer by analysing farms in terms of their economic size. Of the EU's 9.1 million farms, 3.3 million had a standard output below EUR 2 000 per year and were responsible for only 1 % of the EU's total agricultural economic output. These very small farms are at the (semi-)subsistence end of the farming scale; about two-thirds of such farms in the EU consumed more than one half of their production in 2016.
A further 2.5 million farms had an economic output within the range of EUR 2 000 - EUR 8 000 per year. Together these very small and small farms accounted for two-thirds (63.7 %) of all farms in the EU in 2020.
In contrast, 299 000 farms (3.3 % of the EU total) each produced a standard output of EUR 250 000 per year or more in 2020 and were responsible for a majority (56.4 %) of the EU's total agricultural economic output; these farms can be characterised as being large agricultural enterprises. A little more than two in every five (44.5 %) of these large farms had a legal or group holding form.
A large majority (60.2 %) of the standard output generated by agriculture across the EU was from the combined farms in Italy (18.1 %), France (17.2 %), Germany (12.6 %), and Spain (12.2 %) in 2020. Although Romania accounted for about one third of the EU's farms, it accounted for only 3.3 % of the EU's standard output (see Figure 2).
EU farms remain diverse in terms of what they grow or rear
The diversity of farm types can be shown according to what is grown or reared, based on whether there is a single dominant activity or not. A farm is considered to be specialised when a particular activity provides at least two-thirds of the production or the business size of an agricultural holding. Others have a mix of activities in which no one activity dominates.
Some farms are specialised in crop production, whether that be where field crop activities are the dominant activity, or where permanent crops (like apples, grapes and olives) dominate, or indeed horticultural activities. Some farms are specialised in animal production and animal products, whether that be where grazing livestock or granivores (such as pigs and poultry) dominate. Other farms have a mix of crops, mix of livestock, or mix of crops and livestock.
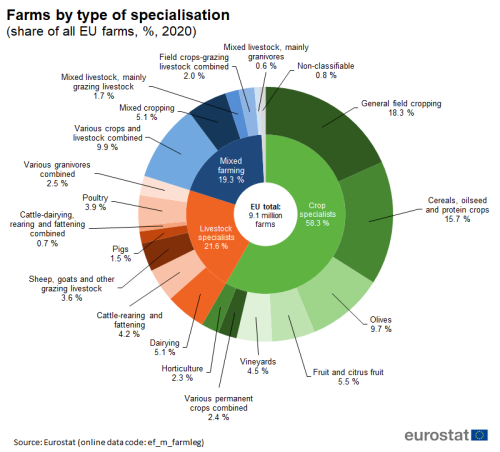
Almost six in every ten farms (58.3 %) in the EU could be categorised as being crop specialist farms in 2020. About one third (34.0 %) of all farms were specialised in field cropping, about one fifth (22.1 %) were specialised in permanent crops, with remainder (2.3 %) being specialist horticultural farms. In this grouping of crop specialists, general field cropping farms that specialised in root crops (such as potatoes and sugar beet), in field vegetables and field crops were the most numerous (accounting for 18.3 % of all EU farms – see Figure 3). This was closely followed by specialist cereals, oilseeds and protein crop farms (15.7 %) of all EU farms.
Another one fifth (21.6 %) of the EU's farms were specialist livestock farms, with specialist dairy farms (5.1 %) and specialist cattle-rearing and fattening (4.2 %) the most numerous within this group.
Mixed farms made up most of the rest (19.3 %), with a small percentage of farms not being classifiable.
(share of all EU farms, %, 2020)
Source: Eurostat (ef_m_farmleg)
In many Mediterranean countries (Spain, Italy, Greece, Cyprus) and also in Finland, specialist cropping was the dominant farm type (with a share of more than 70 % of all farms), while in parts of North-West Europe (Ireland, Luxembourg, the Netherlands) as well as Austria, specialist livestock farming was the dominant activity (with a share of more than 50 % of all farms). More than 25 % of farms were mixed holdings in Croatia, Lithuania, and Romania.
Farms managed a little less than one half (46.4 %) of the total land area of the EU in 2020
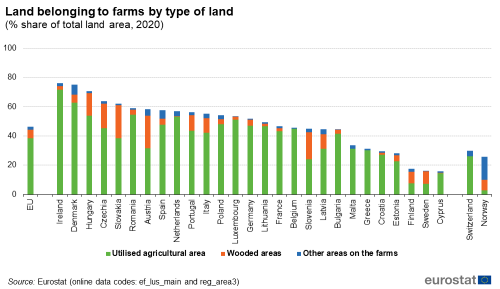
Farms in the EU managed two-fifths (38.4 %) of the total land area of the EU as UAA (157.4 million ha), but also land as wooded areas (5.9 %) and as other farm land not used for agriculture (2.2 %).
Agricultural landscapes dominated the countryside in a few Member States; about 72 % of Ireland’s land area was used as agricultural land and the share was also particularly high in Denmark (62.6 %). In Romania, Hungary, the Netherlands and Luxembourg, about one half of the total land area was used as agricultural land. This was in starkest contrast to Finland and Sweden where forests dominated the landscape. In these two Nordic Member States, agricultural land use only represented the equivalent of 7.5 % and 7.4 % of their respective total land areas. Indeed, they were the only EU Member States where wooded areas belonging to agricultural holdings accounted for a higher share of the land area than that used for agricultural purposes (see Figure 4).
(% share on total land area, 2020)
Source: Eurostat (ef_lus_main) and (reg_area3)
France (27.4 million ha) and Spain (23.9 million ha) had the largest utilised agricultural areas in the EU in 2020, 17.4 % and 15.2 %, respectively, of the EU total. There were also more than 10 million hectares of UAA in Germany (16.6 million ha, equivalent to 10.5 % of the EU total), Poland (14.8 million ha, or 9.4 % of the EU total), Romania (12.8 million ha, or 8.1 %) and Italy (12.5 million hectares, or 8.0 %).
The evolution of farms and farmland between 2005 and 2020
The number of farms has been in steep decline
The number of farms in the EU has been in decline for a long time. However, putting a precise figure on farm losses should be treated with some caution, as coverage has decreased in some countries with the raising of the size threshold for what is considered a farm. This means that figures in time series analysis of farm numbers, types of farms and characteristics of the labour force should be seen as indicative rather than precise[1].
Bearing in mind this precaution, the number of farms in the EU decreased by about 37 % in the relatively short period between 2005 and 2020. This corresponded to the loss of 5.3 million farms across the Member States, the vast majority of which (about 87 %) were small farms of a size under 5 ha. During this period, there were fewer farms in every Member State but the largest reductions were recorded in Romania (an indicative loss of 1.4 million farms, equivalent to a decline of -32 %), Poland (an indicative loss of 1.2 million farms, or -47 %), Italy (an indicative loss of 0.6 million farms, or -34 %), Hungary (an indicative loss of 0.5 million farms, or -68 %), Bulgaria (an indicative loss of 0.4 million farms, or -75 %) and Greece (an indicative loss of 0.3 million farms, or -36 %).
Most farms lost in the smallest size classes: remaining farms getting larger
The number of the smallest farms under 5 ha in the EU was 4.6 million less in 2020 than in 2005. Although there were also considerable losses in larger farm sizes classes, these were far fewer; the total number of farms of a size between 5 ha and 100 ha was 0.7 million less in 2020 than 2005.
There was growth in the number of the largest farms in the EU (see Figure 5). This was also reflected in most Member States. There were three exceptions: Denmark, Greece and Austria.
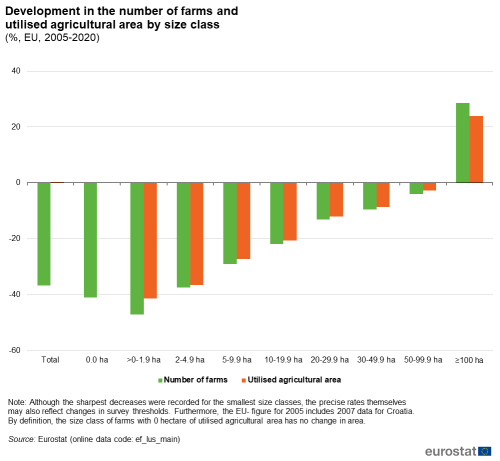
(%, EU, 2005-2020)
Source: Eurostat (ef_lus_main)
The amount of land used in the EU for agricultural production has remained steady
The amount of land that was used for agricultural production remained broadly unchanged (+0.3 %) between 2005 and 2020, despite the sharp reduction in farm numbers. At the EU-level, this consolidation of agricultural land reflected the growth in the number of the largest holdings and the land that they used for agricultural purposes.
In some Member States, the transfer of land from the smallest farms to bigger farms through mergers and takeovers resulted in the growth of numbers of farms in medium-sized classes. For example, in Bulgaria there were higher numbers of farms in all size classes over 5 ha, despite an overall loss of 0.4 million farms. In Romania, there were higher number of farms in all size classes over 20 ha, despite an overall decline of 1.4 million farms.
Legal form of holdings growing
There were about 400 000 farms in the EU that had a legal basis in 2020, the equivalent of 4.4 % of all farms. This represented an increase of 80 000 farms taking this form in the period between 2005 and 2020, and growth was noted in every farm size category, although most notably in farms of a 100 ha or more in size.
Source data for tables and graphs
Data sources
Farm Structure Survey (FSS) data are collected from agricultural censuses every ten years and from sample surveys every 3 or 4 years in between. The main tables from the Agricultural Census for 2020 are gradually being published and are used in this analysis.
Context
Farming is an activity that is about growing crops and raising livestock. It is the business of providing key primary ingredients for the food that we eat and much of what we drink. Farming draws on a set of resources to produce these agricultural goods, as well as agricultural services. These resources or 'factors of production' can be broadly categorised as land, labour, knowledge, capital and entrepreneurship. Within the EU, the farming sector operates under the Common Agricultural Policy (CAP). Just as agriculture needs to keep pace with scientific and technological advances, so the CAP needs to respond to developing challenges. The CAP has been reformed a number of times over the years. On 2 December 2021, the European Commission proposals for further changes beyond 2020 were adopted and will enter into force on 1st January 2023. The nine objectives of this new CAP highlight the central role of farms and farmers in meeting challenges to do with climate change, with creating vibrant rural areas, with preserving rural landscapes, with environmental care and with protecting food and health quality. These economic, environmental and climate-related and socio-economic challenges require that farmers be at the heart of Europe's rural communities. This helps explain why support for the generational succession of farms and encouragement of a new generation of farmers is also a key part of the new CAP proposal.
Direct access to
- Agriculture (agri), see:
- Farm structure (ef)
- Farm structure (ESMS metadata file — ef_esms)
- Farm structure — Methodology of Community surveys
- National methodological reports
Main legislation
- Regulation 1166/2008 of the European Parliament and of the Council on farm structure surveys and the survey on agricultural production methods (farm structure survey from 2010 to 2016)
- Summaries of EU Legislation: EU integrated farm statistics
- Regulation No 378/2014 of the European Parliament and of the Council of 3 April 2014 amending Regulation (EC) No 1166/2008 as regards the financial framework for the period 2014-2018
- Commission Regulation No 715/2014 of 26 June 2014 amending Annex III to Regulation (EC) No 1166/2008 of the European Parliament and of the Council on farm structure surveys and the survey on agricultural production methods, as regards the list of characteristics to be collected in the farm structure survey 2016
Implementing legislation
- Commission Regulation 1200/2009 implementing Regulation 1166/2008 on farm structure surveys and the survey on agricultural production methods (farm structure survey from 2010 to 2016)
- Commission Regulation 2015/1391 amending Regulation (EC) No 1200/2009
Related and older legislation
- Council Regulation 1217/2009 setting up a network for the collection of accountancy data on the incomes and business operation of agricultural holdings in the European Community
- Summaries of EU Legislation: Farm incomes and operations - EU statistics
- Commission Delegated Regulation 1198/2014 of 1 August 2014 supplementing Council Regulation (EC) No 1217/2009 setting up a network for the collection of accountancy data on the incomes and business operation of agricultural holdings in the European Union
- Commission Implementing Regulation 220/2015 of 3 February 2015 laying down rules for the application of Council Regulation (EC) No 1217/2009 setting up a network for the collection of accountancy data on the incomes and business operation of agricultural holdings in the European Union
- https://ec.europa.eu/info/food-farming-fisheries/key-policies/common-agricultural-policy/future-cap_en
- https://ec.europa.eu/info/sites/info/files/food-farming-fisheries/key_policies/documents/eco_background_final_en.pdf
- https://ec.europa.eu/info/sites/info/files/food-farming-fisheries/key_policies/documents/env_background_final_en.pdf
- https://ec.europa.eu/info/sites/info/files/food-farming-fisheries/key_policies/documents/soc_background_final_en.pdf
Notes
- ↑ For more details, see the Statistics Explained article on Farm structure survey – survey coverage.
