Beginners:Government finance statistics
Highlights
This article is part of Statistics 4 beginners, a section in Statistics Explained where statistical indicators and concepts are explained in a simple way to make the world of statistics a bit easier for pupils and students as well as for everyone else with an interest in statistics.
To understand government finance statistics, it is important to first get an idea of what government is in statistics and what government finance statistics seek to measure. That is why this article will first take a look at what government and government finance statistics are, before moving on to questions on what government finance statistics can tell us and how they are calculated.
Full article
What is government?
First of all, we need to understand what is meant by the word government.
For the purpose of government finance statistics the government sector, also referred to as the general government sector, is made up of:
- the central government;
- state governments which may be known by various names (not all countries have this level of administration);
- and local governments.
Furthermore, the general government sector includes:
- social security funds; see Box 1 for more information about this specific subsector.
Box 1: Social security funds
The social security funds subsector includes certain units within the government, whose principal activity is to provide social benefits. Certain groups of the population are obliged by law or regulation to participate in the schemes or to pay contributions. These funds are managed by the general government in terms of fixing the contributions to be made and the benefits to be paid.
Common examples of social benefits are payments related to pensions and sickness.
What are government finance statistics?
Government finance statistics show the economic activities of government, including:
- total revenue and total expenditure, for example the expenditure on social benefits and the revenue from taxes and social contributions;
- transactions in financial assets and liabilities, for example the issuance of bonds and the resulting inflow in government deposits (the bank balance) as well as other flows of assets and liabilities, for example fluctuations in the market value of government bonds;
- stocks of assets and liabilities, which measure what the government sector owns (its assets - non-financial such as land and buildings and financial such as its deposits in commercial banks) and what it owes (its liabilities, such as the bonds it has issued). These are measured at a particular moment such as at the end of a year.
As such, government finance statistics are a bit like company accounts: they have a profit and loss account summarising income (revenue) and expenditure during a year or quarter and also a balance sheet at the beginning and the end of the year showing the company’s assets and liabilities.
The full name of the binding standards and methods used for compiling government finance statistics in the EU is the European system of national and regional accounts, referred to by its abbreviation ESA. These standards are updated regularly to reflect changes in the economy, such as financial developments. The latest version is called ESA 2010. Special manuals on government finance statistics referring to ESA 2010 are available on the Eurostat website where more detailed information can be found.
What can government finance statistics tell us?
Revenue
Revenue includes different types of government revenue, for example from different types of taxes and social contributions. These statistics show how much of government revenue comes from income taxes, such as personal income taxes paid by households, how much from taxes on income and profits of corporations, how much from wealth or inheritance taxes, how much from value added taxes (VAT), or how much comes from taxes on products like those on cigarettes, alcohol or petrol. Government revenue from taxes and social contributions is often shown relative to the size of the economy, in other words relative to gross domestic product (GDP). More information about GDP is available in another Statistics 4 beginners article. Apart from taxes and social contributions, governments also have - for example - revenue from dividends of public corporations, from interest income on its loan assets or from fines and penalties.
Examples
In 2016, taxes on personal income made up 55.2 % of all government revenue from taxes and social contributions in Denmark, but 7.4 % in Cyprus.
By contrast, taxes on profits of businesses accounted for 17.3 % of the total revenue in Cyprus, but 0.5 % of the total in Estonia.
In total, taxes and social contributions were equivalent to 39.8 % of GDP in the EU in 2016. Among the EU Member States, this ratio was highest in France at 47.4 % and lowest in Ireland at 23.6 %.
Expenditure
Turning to government expenditure, the statistics can be analysed in two ways.
Firstly, they can be analysed by looking at the type of expenditure, for example wages and salaries of government employees as well as the associated social contributions paid by government as an employer (compensation of employees), interest (on debt), investment expenditure (gross capital formation), subsidies, social benefits or other expenditure. Typically, in the EU, social benefits represent the largest share of total expenditure.
Examples
Governments can invest in a large range of things, such as in infrastructure or in research and development, just to name a few.
In 2016, investment represented 5.8 % of government expenditure in the EU, ranging from 3.3 % in Portugal to 11.8 % in Estonia.
In the EU, interest payments represented 4.6 % of government expenditure, ranging from 0.1 % in Estonia to 9.3 % in Portugal.
Secondly, government expenditure can be analysed by looking at the purpose of the expenditure, based on the classification of the functions of government (COFOG); the broadest headings in this classification are shown in Box 2. The full detailed list is available here.
Box 2: Divisions of COFOG — classification of the functions of government
01 General public services
02 Defence
03 Public order and safety
04 Economic affairs
05 Environmental protection
06 Housing and community amenities
07 Health
08 Recreation, culture and religion
09 Education
10 Social protection
Financial assets and liabilities and government debt
Concerning financial assets (what the government sector owns) and liabilities (what the government sector owes), some analyses focuses on government debt. For general government gross debt, several different types of analyses can be performed:
- How much debt does each government subsector have?
- In which currency was the debt issued?
- What is the maturity of the debt, in other words is the government debt mainly composed of liabilities, which have to be repaid shortly or is the government mainly incurred in long-term instruments?
- To which other sectors is the debt owed: financial corporations, another general government subsector, households or foreign creditors?
How is the government deficit calculated?
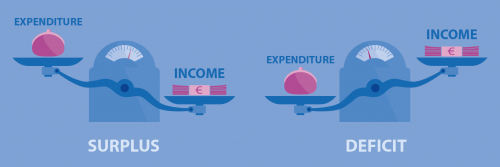
Taking the total revenue and expenditure of government, it is possible to calculate the difference, which is either a surplus (if revenue is higher than expenditure) or a deficit (if expenditure is higher than revenue); the difference is also known as the public balance. An alternative way to look at this balance is to look at the consequence of having a surplus or a deficit: if there is a surplus the government has money to lend, while if it has a deficit it needs to borrow in order to cover all of its expenditure. As such, the surplus/deficit of the government sector is referred to as net lending/borrowing in national accounts.
Example
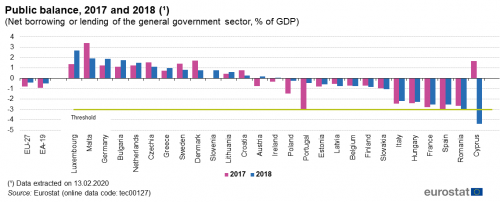
For analysis, for example to make comparisons between countries easier, the value of the surplus or deficit is often compared with the value of GDP and is then shown as a percentage (% of GDP). See example below.
How is the government debt calculated?
For calculating general government gross debt, three types of liabilities are considered:
- debt securities;
- loans;
- currency and deposits.
Within the EU, the vast majority of government debt is in the form of debt securities, mainly bonds issued by governments. Bonds generally specify the level of interest that will be paid to the purchaser. They also specify the period of time after which the full value of the bond, its so-called face value, will be repaid: this period of time is known as its original maturity.
Loans are when a government has taken the initiative to borrow money from creditors, often banks. Again, the loan will typically be for a set period of time during which interest will be paid and at the end of this period the loan should be repaid in full. This might also be a loan from another country, for example when a relatively developed country lends money to another country to help its development or simply for short-term adjustments of liquidity.
The main difference between loans and debt securities is that loans are said to be ‘non-negotiable’ whereas debt securities are ‘negotiable’. This means that the borrower and lender are generally fixed for the period of a loan as the loan generally cannot be traded from one lender to another. However, the purchaser of a debt security can sell the security to someone else before it reaches maturity.
Deposit liabilities of the central government are like accounts of financial institutions, such as banks, building societies, credit unions, or savings and loan associations. Deposits may be held in accounts from which the account holder can freely make payments or withdrawals, or they may be held in accounts where access is restricted, for example for a period of time.
The total government debt is the sum of these different types of debt, namely debt securities, loans, and currency and deposits. The value of the government debt is expressed in a currency, for example euros.
Example
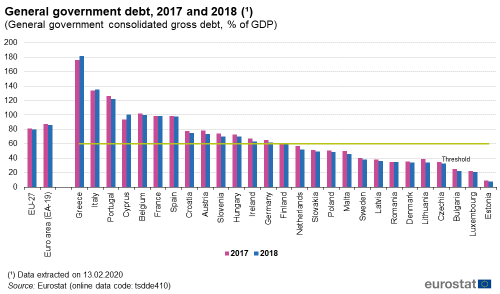
As with the deficit, the value of the debt is often compared with the value of GDP and is then shown as a percentage (% of GDP). See example below.

(general government consolidated gross debt, % of GDP)
Source: Eurostat (tsdde410)
What have government finance statistics got to do with the euro and the convergence criteria?
A set of convergence criteria were established by the Maastricht Treaty, which laid down the conditions for the establishment of the euro. Countries wanting to join the euro area are obliged to meet these criteria and they should maintain their finances with respect to the criteria thereafter. There are two convergence criteria which relate to government finances, namely:
Government deficit — total general government revenue minus total general government expenditure — should not be above 3 % of GDP.
General gross government debt — in other words, how much a government has borrowed debt securities, loans and currency and deposits and not yet repaid — should not be above 60 % of GDP.
The excessive deficit procedure (EDP)
EU Member States regularly provide Eurostat with data relating to their surplus/deficit and debt for statistical verification and these statistics are then used within the European Commission’s excessive deficit procedure (EDP) to analyse budgetary discipline and respect of the convergence criteria. Eurostat releases the data in the form of news releases and these statistics are also presented in a Statistics Explained articles on Government finance statistics.
Direct access to
Related articles:
- Government finance statistics
- Government finance statistics - quarterly data
- Government expenditure by function — online publication
- Structure of government debt
- Tax revenue statistics
Glossary items in Statistics Explained:
- Net lending/borrowing
- Government debt
- Government
- Central government
- State government
- Local government
- Social security funds
- Government revenue and expenditure
- Classification of the functions of government (COFOG)
- Assets
- ESA 2010
- Tax revenue
- Taxes on products
- Value added tax (VAT)
- Gross domestic product (GDP)
- Dividends
- Compensation of employees
- Interest
- Gross capital formation
- Subsidies
- Social benefits
- Convergence criteria
- Treaty on European Union


