EU registered trade in goods surplus of €38 billion in 2023

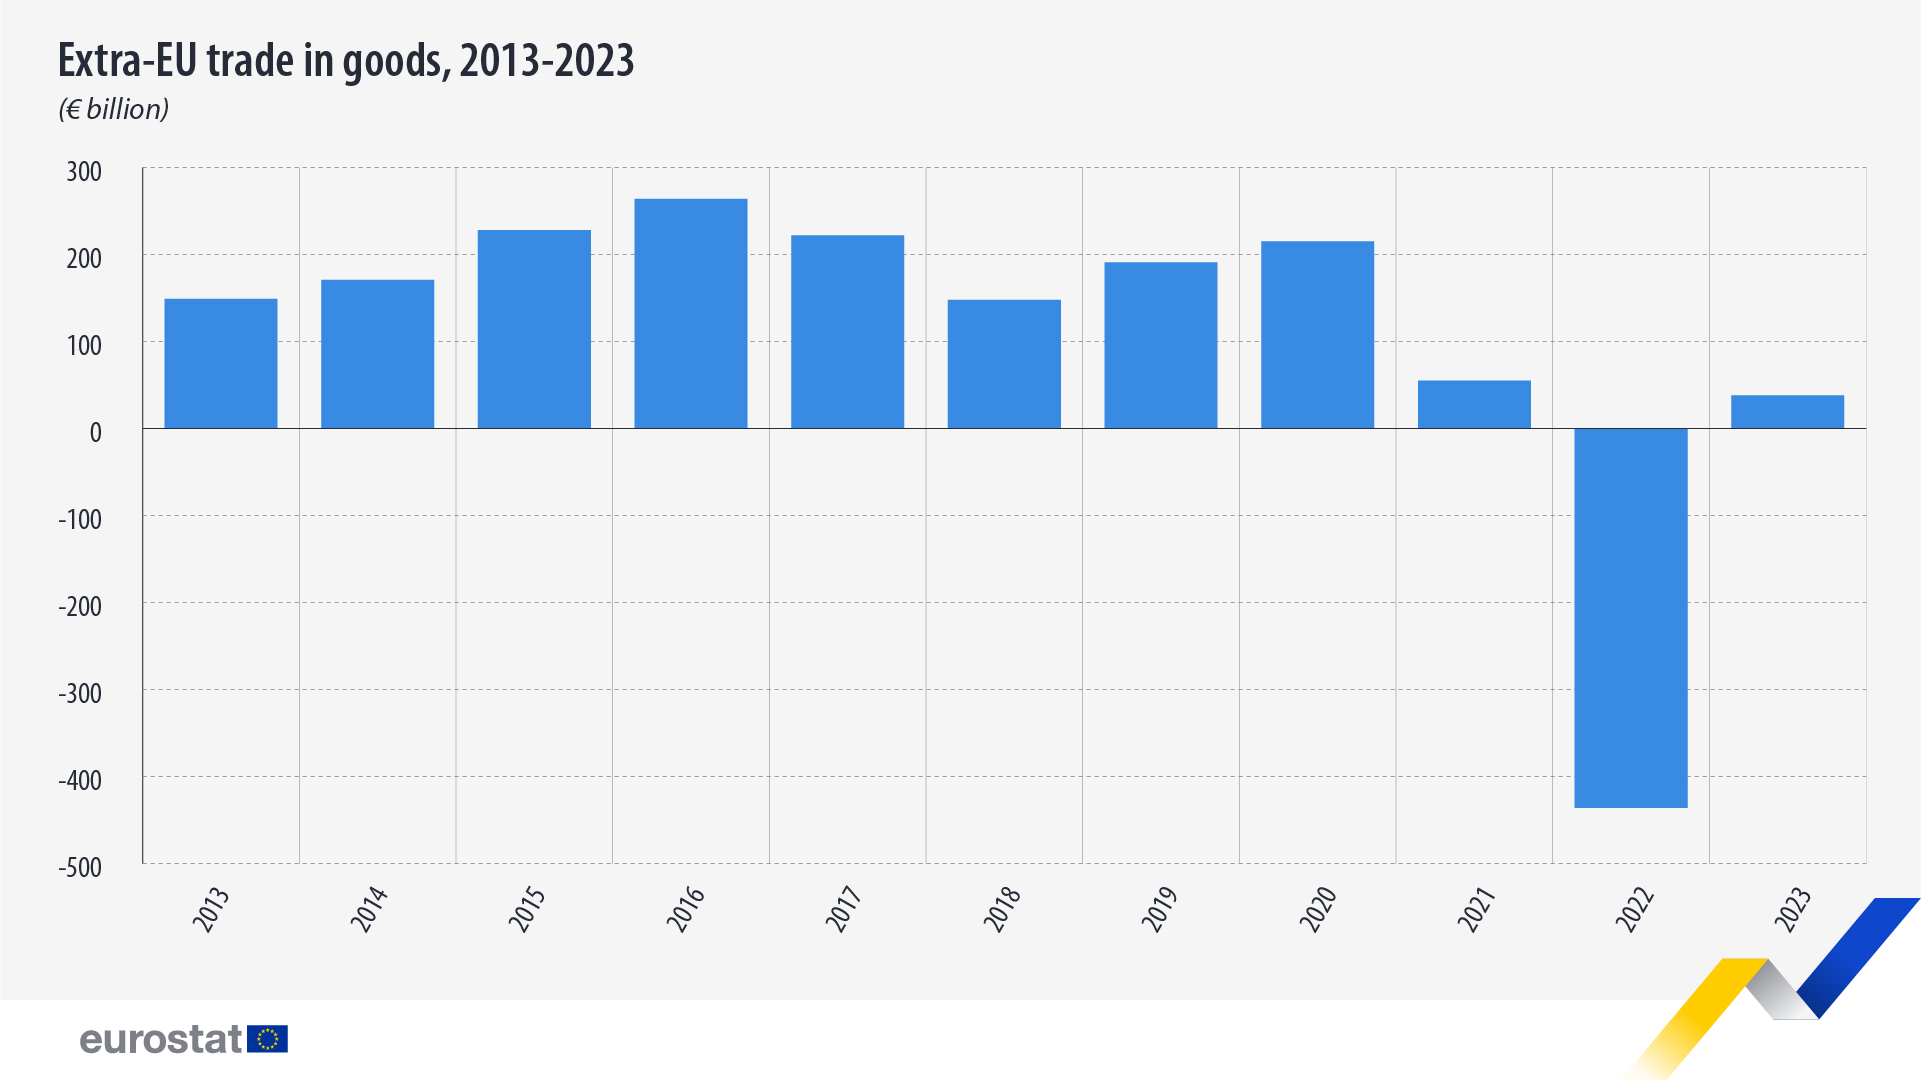
In 2023, the EU trade in goods balance registered a surplus of €38 billion. This marks a great contrast compared with 2022 when the EU reported a deficit of €436 billion due mainly to the increased value of energy imports resulting from high prices for energy.
This information comes from data on international trade in goods published recently by Eurostat. This article presents a handful of findings from the more detailed Statistics Explained article.
Source dataset: ext_lt_intertrd
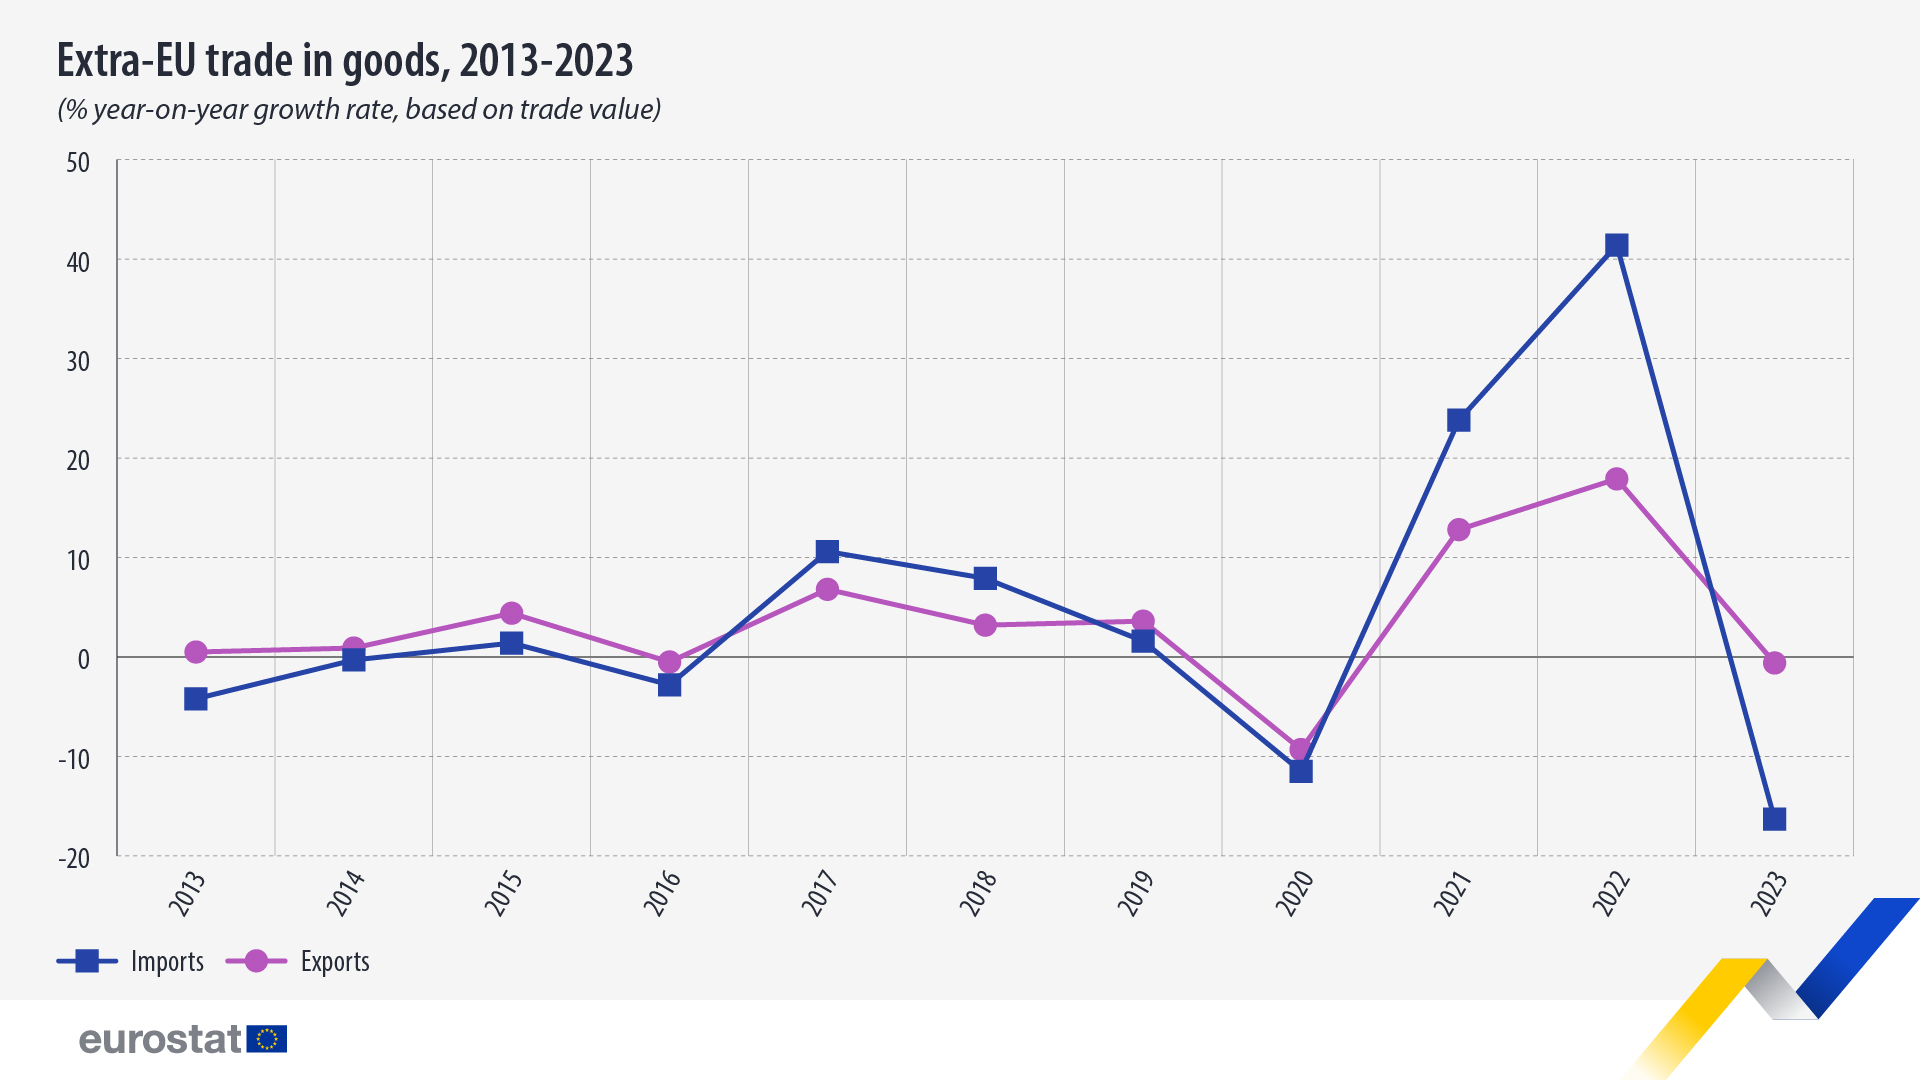
The reason for the balance turning from a deficit in 2022 to a surplus in 2023 was the steep decline in the value of extra-EU imports (-16% compared with 2022). This decline was driven mainly by drops for ‘energy products’ (-34% with respect to 2022), and ‘manufactured goods classified chiefly by material’ (-21%). For both products, the drop was a combined effect of a drop in prices and a drop in volume.
Source dataset: ext_lt_intertrd
EU members remain reliant on the European single market
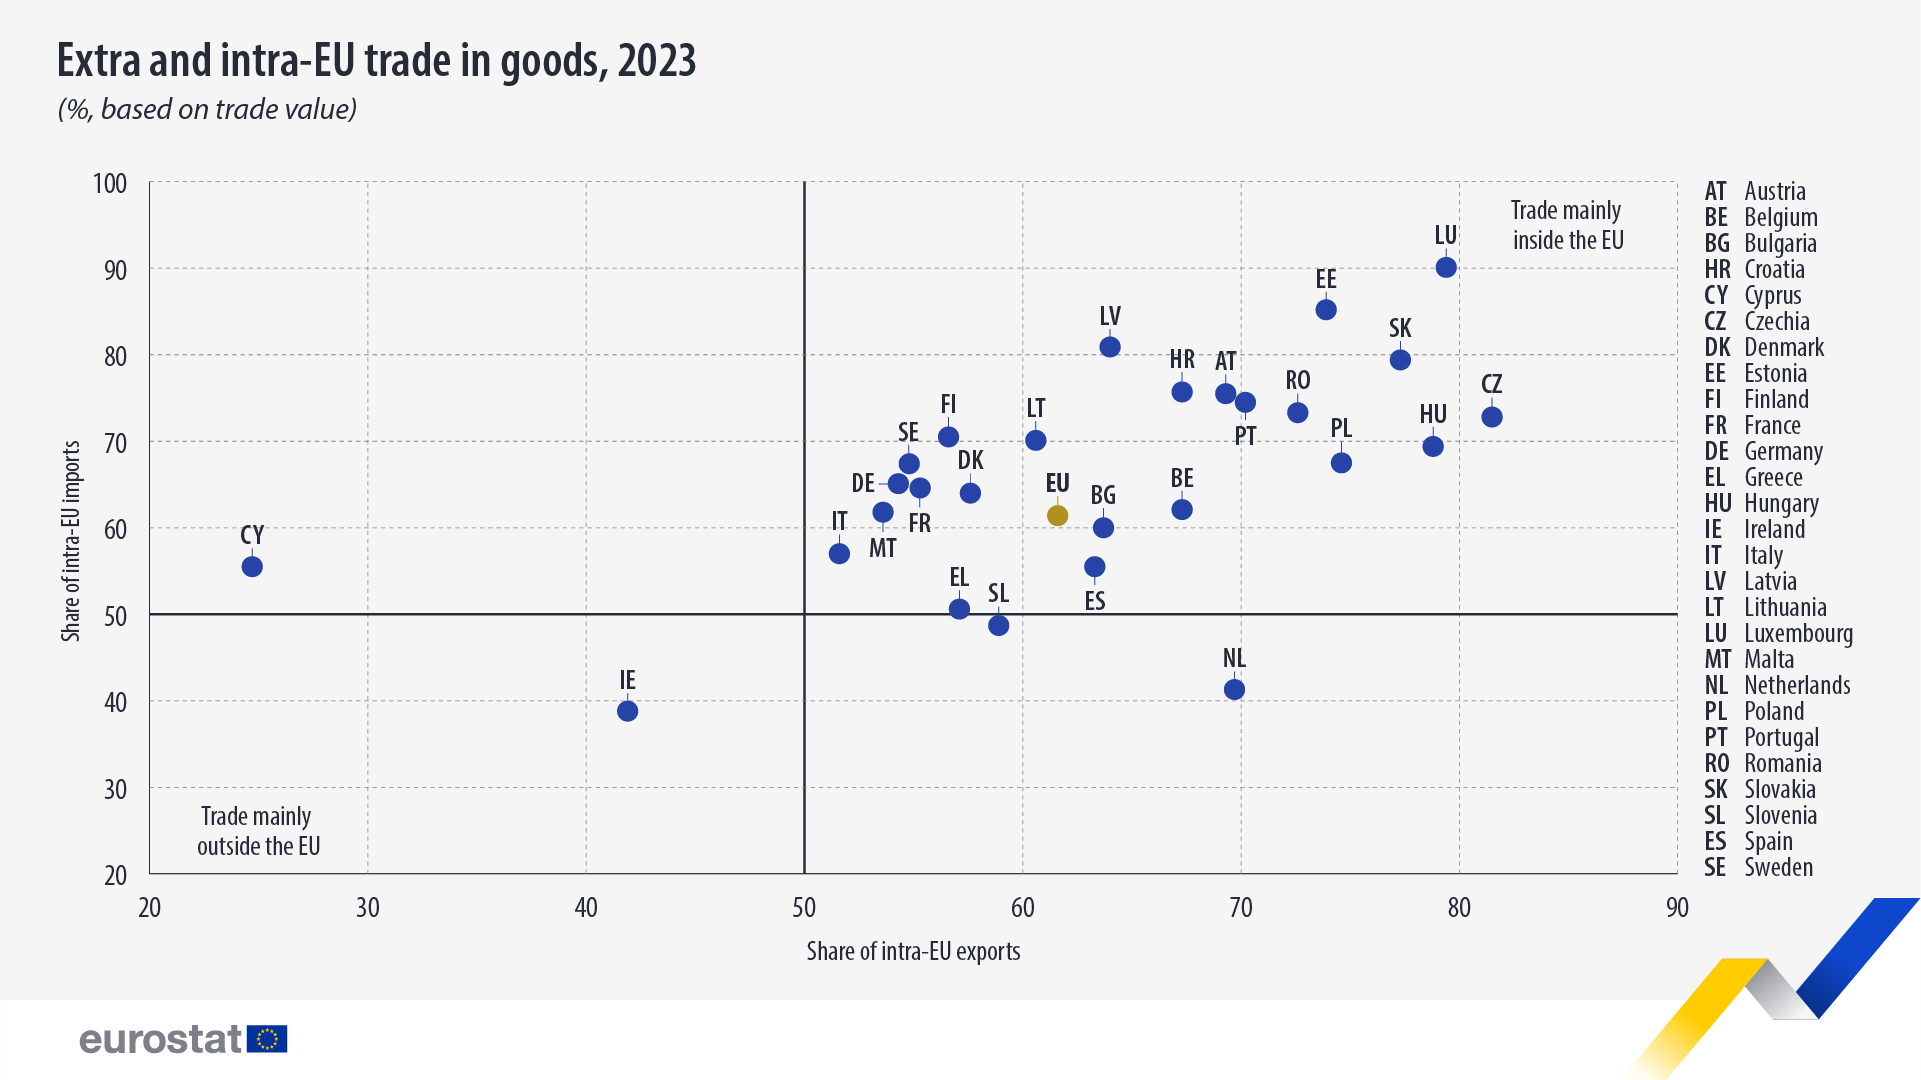
Data show that the EU’s internal market continued to take centre stage in EU countries’ trade of goods, although the proportion of intra-EU and extra-EU flows in total trade in goods varied considerably across EU countries, reflecting, to some degree, historical ties and geographical location.
Source dataset: ext_lt_intratrd
Among the EU members, the highest share of intra-EU imports was recorded in Luxembourg (90% of its total imports), while the highest share of intra-EU exports was registered in Czechia (82% of its total exports).
On the other hand, the lowest share of intra-EU imports was recorded in Ireland (39% of its total imports), mainly because its primary trade partners are the United States and the United Kingdom.
The Netherlands is the country which imports mostly from outside the EU, and exports mostly inside the EU, continuing to play the role of main entry hub for the EU. By contrast, Cyprus is the country exporting mainly outside the EU, while importing mainly from inside the EU. This is mainly due to its geographical location which facilitates trade with the Middle East.
For more information
- Statistics Explained article on international trade in goods
- Thematic section on international trade in goods
- Database on international trade in goods
- Statistics 4 Beginners on trade in goods
Methodological note
‘Manufactured goods classified chiefly by material’ contain the following goods:
- Leather, leather manufactures and dressed furskins
- Rubber manufactures, n.e.s.
- Cork and wood manufactures (excluding furniture)
- Paper and paper manufactures
- Textile yarn and related products
- Non metallic mineral manufactures, n.e.s.
- Iron and steel
- Non-ferrous metals
- Manufactures of metal, n.e.s.
If you have any queries, please visit our contact us page.


