Tutorial:Layout rules for tables
Highlights
This tutorial is part of the guidelines Layout rules for tables, graphs and maps, using the Excel add-in.
It describes the layout rules for Eurostat tables produced with Excel in Statistics Explained and some publications such as 'Statistical working papers' and 'Manuals and guidelines'.
Full article
Themes
The appropriate theme colour can be set using the Set Eurostat Theme command. This also sets the default font to be used (for the current workbook). See figure 1.
Default Theme
If you use the same theme for all workbooks you create, you can set a default theme by using the Set Default Theme Color… command in the Set Eurostat Theme menu.
When calling this command the Default Theme dialog box is displayed.
Formatting Tables
Formatting tables requires several steps since each step requires other cells to be selected in order to apply the proper formatting (e.g. select EU/EA Aggregates cells before clicking on the EU/EA Aggregates button). In order to simplify the chain of formatting tasks the order of the buttons reflects the order in which you should typically apply the commands. The tasks are:
- 1. Format title, subtitle, notes, footnotes and source
- 2. Sort table (protocol order)
- 3. Format column headers
- 4. Format EU/EA aggregates
- 5. Format first column
- 6 Unify table width
The Table Layout group contains commands for formatting tables according to the Eurostat table graphical guidlines:
To format a table, use the following steps (all steps are optional):
- 1 -Select the title and click on Title
- 2 -Select the subtitle (e.g. unit) and click on Subtitle
- 3 -Select the Notes and click on Notes.
- 4 -Select the footnotes and click on Footnote. Note: If you have many footnotes, you can click on All Footnotes to format all footnotes in the current Excel workbook with one click. Please also see Guidelines for notes and footnotes
- 5 -Select the cell to insert the source and online data code and click on Source. Note: If the Source is already in the cell, select the cell and click on Source to format the source according to the Eurostat rules.
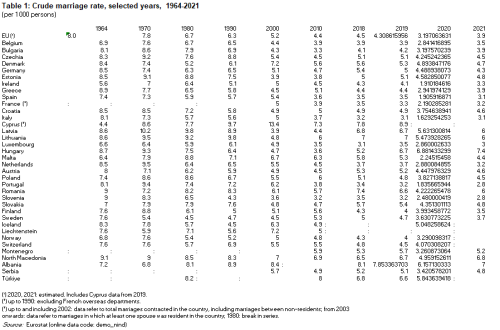
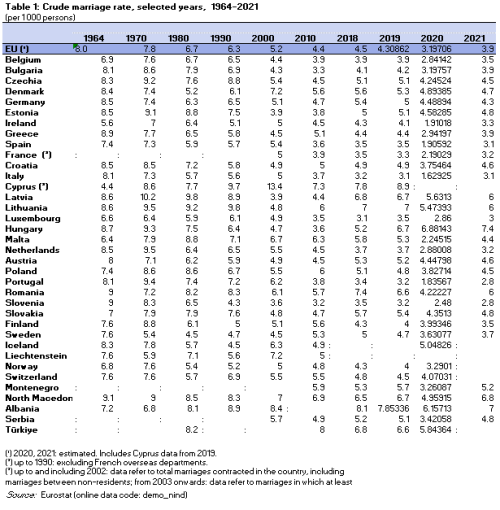
- 6 -Select the table without the header row and the EU/EA aggregates and click on Sort to sort the table according to the protocol order.
- 7 -Select the column headers and click on Column Headers. The right color of the theme is set, the inside lines and the top and bottom black lines of the header are created automatically.
- 8 -Select the EU/EA Aggregates cells and click on EU/EA Aggregates.
- 9 -Select the first column and click on First Column.
- 10 -Select the table (starting from the header row, down to the last data row, i.e. do not include the Title or the footnotes). Click on Unify Table Width. Result: The table column width will be adjusted in such a way that the table is about 25 cm wide. All but the first columns get the same width. The first column gets the best width, depending on its content.
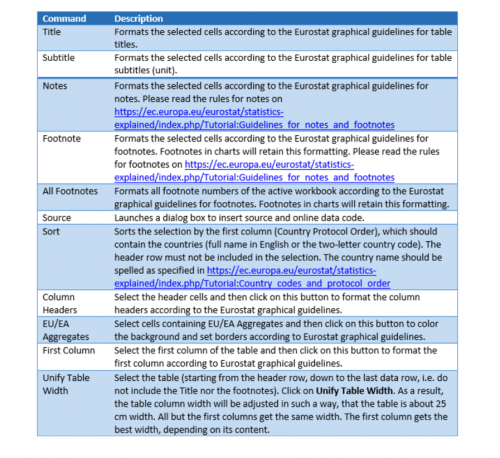
The following table summarises the table formatting commands together with a short description. Please note that the Eurostat Layout add-in has been designed to follow the Eurostat graphical guidelines as closely as possible. However, there are some technical restrictions which do not enable the exact formatting as required by the Eurostat graphical guidelines to be produced. For example, the Myriad font is to be used in publications. However, the Arial font has been chosen as the font used in Excel, yet Arial does not offer light, semibold, etc. Thus, the formatting obtained in Excel is as close as technically possible to the Eurostat graphical guidelines.
Formatting Numbers
The Numbers group contains commands for formatting numbers in tables according to the Eurostat graphical guidelines.
To format the numbers in a table use the following steps (all steps are optional):
- 1. Select the cells with numbers and click on Format. This results in the following:
- a. The selected cells are formatted using Arial 10pt, right-aligned.
- b. A small space between the right-aligned number and the right border of the cell is added.
- c. The thousands separator is activated. Furthermore, a check is conducted to determine whether the thousands separator is a blank. If this is not the case, you are asked whether the separator should be changed to a blank. If yes, the separators dialog box is shown (cf. Thousands Separator in Excel for more details).
- 2. Use the increase/decrease decimal buttons to change the number of decimal places shown.
Formatting Table Borders
The Borders group contains commands for formatting table borders according to the Eurostat table graphical guidlines:
To format the borders of a table use the following steps (all steps are optional):
- 1. Click on Gridlines to hide the lines between rows and columns. For the final version, the gridlines should be hidden so that no gridlines appear when including the table in the article or publication.
- 2. Select the table and click on Reset borders to remove any borders from the selection.
- 3. Select the data of the table (not the header row) and click on Inside Lines.
- 4. Select the last row of your table and click on Bottom Line. Repeat this step (as applicable) for the last row of
- a. the Member States,
- b. the EFTA countries,
- c. the candidate countries,
- d. other countries (e.g. USA, Japan).
- 5. Use grey vertical lines to separate distinct sets of data in the same table. To do so, select the column to be separated and click on Grey Left Line. Repeat this step as necessary.
1. Create a PNG file from each image
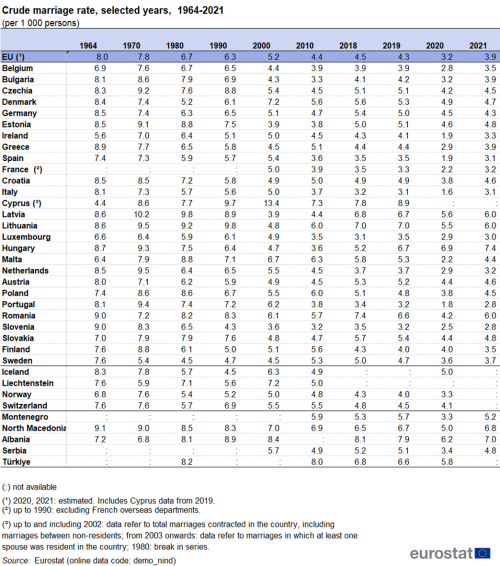
To publish your charts or tables in Statistics Explained, you have to provide a PNG file of the charts and tables.
The Eurostat Layout add-in provides a command to support this task. There is a Picture group on the Eurostat Layout ribbon tab, as shown here:
Note: Title and source are mandatory items in the PNG, when publishing on Statistics explained. The Save as PNG command checks, whether you include these items. If not, you are asked to include them.
Saving Tables as PNG
To create a PNG file for a table, do the following:
- (1) Select the range of cells to be displayed in the PNG including the table title, notes, footnotes and source.
- (2) Click on the Save As PNG button.
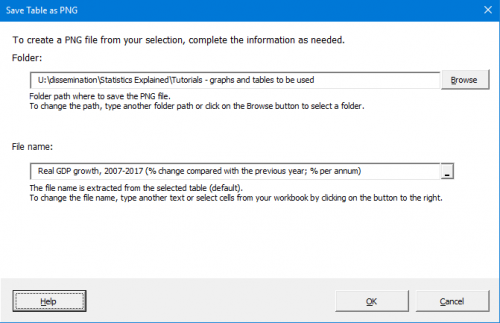
- (3) The following dialog box appears:
- (4) By default, the PNG is saved in the same folder where the active Excel file is located. The file name is extracted from the table title and subtitle. You can modify the folder and file name as needed.
- (5) Click on OK to save the PNG file.
Direct access to


