International trade in services by type of service
Data extracted in July 2023.
Planned article update: August 2024.
Highlights
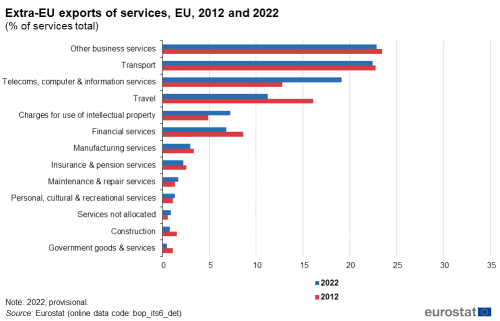
The main components of EU exports of services in 2022 were other business services (22.9 % of total services exports), transport (22.4 %) and telecoms, computer and information services (19.1 %).
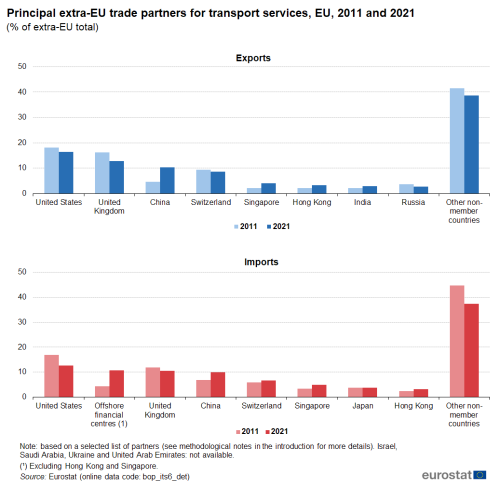
In 2021, the United States was the EU’s main trading partner for transport services, receiving 16.5 % of EU exports to non-member countries and providing 12.6 % of EU imports.
(% of extra-EU total)
Source: Eurostat (bop_its6_det)
Globalisation patterns in EU trade and investment is an online Eurostat publication presenting a summary of recent European Union (EU) statistics on economic aspects of globalisation, focusing on patterns of EU trade and investment.
This article examines developments for international trade in services by type of service. While some types of international services – like transport – have existed as long as there has been commercial activity, trade for many other services has developed relatively recently as a result of market liberalisation and the introduction of new information and communication technologies; these changes often eliminated a range of obstacles and provided new means for supplying services remotely. As a result, some services have experienced considerable structural changes, as small and medium-sized enterprises (SMEs) have been replaced by much larger, international enterprises. Examples include the retail sector (for example, food and beverages or clothing), accommodation services (for example, hotel chains) or financial services (for example, retail banks or insurance companies), where it is relatively commonplace to find increased levels of concentration as multinational enterprises expand their operations. Nevertheless, evolving technologies have lowered costs in some markets for services and provided opportunities for new entrants to disrupt more established enterprises.
Part of the change in the structure and composition of international trade in services may be attributed to a similar pattern of development to that witnessed previously for manufacturing, insofar as a range of (business) services have been outsourced to countries with lower costs, for example, computer programming or call centres in India. By contrast, the delivery of high value, bespoke services, such as those provided by architects, lawyers or management consultants has generally remained close to the point of delivery, reflecting among other issues continued barriers to entry in some professional services and the perceived need to develop and maintain face-to-face business contacts.
Full article
International trade in services – overall developments
In 2022, other business services accounted for the highest share of EU trade in services
In 2022, the highest values of EU international trade in services (see Table 1) – as measured by the sum of exports and imports to/from non-member countries – were recorded for:
- other business services (this diverse category includes, among others, services in the areas of research and development (R&D), professional and management consultancy, technical and trade-related services, architectural, engineering and scientific services, security and investigative services, real estate and other services to businesses);
- transport services;
- telecoms, computer and information services;
- travel services;
- charges for the use of intellectual property (for example, royalties and licences);
- financial services.
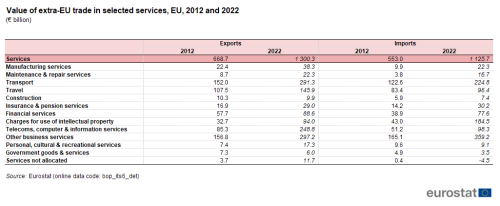
The EU exported other business services to the value of €297 billion in 2022, which was almost one quarter (22.9 %) of all its services exports. The next highest shares of EU exports were recorded for transport services (22.4 %; €291 billion) and telecoms, computer and information services (19.1 % of all service exports; €249 billion); apart from travel services (€146 billion), each of the remaining services that are shown in Table 1 accounted for less than €100 billion of exports in 2022.
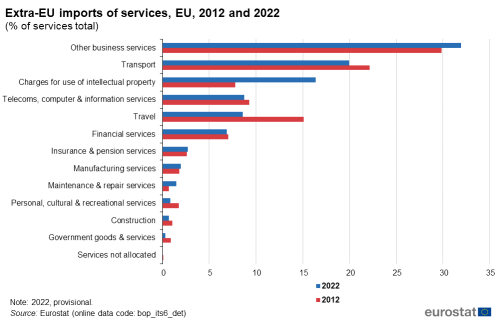
The structure of EU imports was slightly more concentrated: in 2022, other business services accounted for almost one third (31.9 %: €359 billion) of the EU’s total imports of services, followed by transport services (20.0 %; €225 billion) and charges for use of intellectual property (16.4 %; €185 billion); each of the remaining services that are shown in Table 1 accounted for less than €100 billion of imports in 2022.
(€ billion)
Source: Eurostat (bop_its6_det)
Between 2012 and 2022, the fastest growing share of the EU’s trade in services was accounted for by telecoms, computer and information services, and charges for the use of intellectual property
The share of telecoms, computer and information services in the total value of EU service exports to non-member countries rose by 6.4 percentage points between 2012 and 2022. The next largest increase (2.3 percentage points) was recorded for charges in relation to the use of intellectual property, followed by maintenance and repair services (0.4 percentage points), services not allocated (0.3 percentage points) and personal, cultural and recreational services (0.2 percentage points).
By contrast, the relative importance of travel services within extra-EU exports fell 4.8 percentage points during the same period while the share of financial services fell 1.8 percentage points. It should be noted that travel services were severely impacted by the COVID-19 crisis and generally recovered more slowly than most other services. In absolute values – in current prices – construction and government goods and services were the only service categories to record a lower level of exports in 2022 than in 2012.
(% of services total)
Source: Eurostat (bop_its6_det)
A similar analysis relating to changes in the structure of extra-EU services imports (see Figure 2) reveals that a growing proportion of the EU’s imports were composed of charges for the use of intellectual property: their share of the EU total increased 8.6 percentage points between 2012 and 2022, while there was also a relatively fast increase in the share of other business services (up 2.1 percentage points). By contrast, as for exports, the relative contribution of travel services and transport services declined, falling 6.5 and 2.2 percentage points. In absolute values, imports of services not allocated, government goods and services, and personal, cultural and recreational services were lower in 2022 than in 2012.
(% of services total)
Source: Eurostat (bop_its6_det)
In 2022, the EU had a trade surplus for all but 3 of the 12 main service categories
The EU recorded a trade surplus in 2022 for 9 of the 12 service categories detailed in Table 2. The three services where there were deficits were charges for the use of intellectual property (€90.5 billion), other business services (€62.1 billion) and insurance and pension services (€1.3 billion). The EU’s largest trade surplus was for telecoms, computer and information services (€150.4 billion), followed by transport services (€66.6 billion) and travel services (€49.5 billion).
The cover ratio provides an alternative measure for analysing the relative difference between exports and imports; it is calculated as the value of exports divided by the value of imports and expressed as a percentage. In 2022, the value of EU exports of telecoms, computer and information services was 2.5 times as high as the value of EU imports of the same services (a cover ratio of 253.0 %). The deficits recorded for three services were reflected in cover ratios below 100 %. The cover ratio for services not allocated (a residual category with a relatively low level of trade) was unusual in that it was negative, due to a negative value for imports.

Source: Eurostat (bop_its6_det)
International trade in services – focus on selected service categories
International trade in services flows show the transactions between residents and non-residents according to 12 main service categories of the extended balance of payments services classification (EBOPS 2010).
The next section looks in more detail at developments for international trade in services with respect to three of the five largest service categories, namely:
- transport services;
- travel services;
- other business services.
Transport services
In the EU for 2022, transport services was the second largest category (after other business services; see Figures 1 and 2), accounting for 22.4 % of services exports and 20.0 % of services imports.
Transport (as defined by the Balance of Payments and International Investment Position Manual – Sixth Edition (BPM6), paragraph 10.74) is the process of carriage of people and objects from one location to another as well as related supporting and auxiliary services. Transport can be classified according to: (a) mode of transport, namely, sea, air, or other ('other' may be further broken down into rail, road, internal waterway, pipeline, and space transport as well as electricity transmission); and (b) what is carried – passengers or freight.
Figure 3 shows developments for EU international trade in transport services from 2012 to 2022. EU exports of transport services to non-member countries exceeded the value of imports every year during this period, resulting in a persistent trade surplus. For the period from 2012 to 2021, this surplus was within the range of €25.2 billion to €45.0 billion but increased to €66.6 billion in 2022. EU exports and imports of transport services developed in a broadly similar manner between these years: relative stability was observed in the period 2012–2015, followed by a slight decrease in 2016 and then relatively rapid growth for three consecutive years. Almost all of these gains were lost in 2020, when the COVID-19 crisis led to a rapid fall in the level of trade. Note that the rebound in 2021 was greater than the decrease in 2020 and even stronger growth was recorded in 2022. As such, the latest information shows both exports and imports at higher levels than in any of the earlier years. In most years during the period under consideration, the share of transport services within total trade for all services declined: the only increases were recorded in 2017, 2018, 2021 and 2022 (for both exports and imports).

Source: Eurostat (bop_its6_det)
Figure 4 shows the relative importance of the different categories of transport services as regards their contribution to EU exports and imports in the total for transport services in 2021; note the use of an earlier reference year for these more detailed statistics. The largest subcategory was sea transport, which accounted for 64.0 % for exports and 54.5 % for imports of the EU’s trade in transport services. The only other subcategories to record double-digit shares in 2021 were:
- air transport, with 17.1 % of exports and 19.4 % of imports; and
- road transport, with 12.1 % of imports.
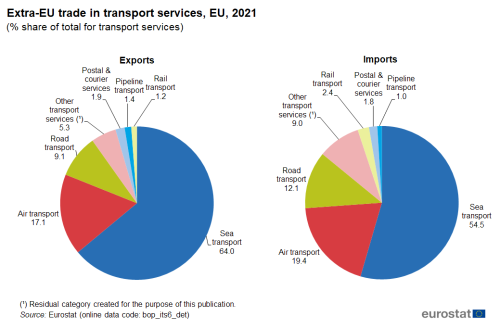
(% share of total for transport services)
Source: Eurostat (bop_its6_det)
In 2021, the United States was the EU’s main trading partner for transport services, accounting for 16.5 % of the EU’s exports to non-member countries and for 12.6 % of its imports (see Figure 5). The United States was followed by the United Kingdom for exports (12.9 %) and offshore financial centres (10.8 %; excluding Hong Kong and Singapore) for imports.

(% of extra-EU total)
Source: Eurostat (bop_its6_det)
Travel services
Within the balance of payments, the travel services category registers ‘visitor’ expenditure (taking account of persons who stay for less than one year and excluding, for example, expenditures related to cross-border commuters, seasonal workers and students); note also that the figures exclude any expenditure related to transport services. Exports of travel services cover goods and services for own use or to give away that are acquired from an economy by non-residents during visits to that economy. Imports of travel services cover goods and services for own use or to give away acquired from other economies by residents during visits to these other economies. For example, when tourists from China visit the EU the expenditure they make during their trip contributes towards the EU’s exports of travel services, whereas residents of the EU Member States who visit China contribute towards the value of EU imports of travel services through their purchases there.
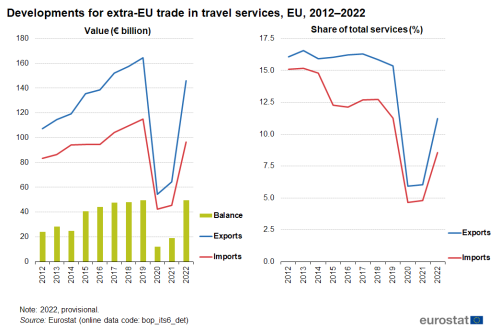
When measured by the fall in the value of trade, travel was the service category most impacted in 2020 by the COVID-19 crisis, both in relative (percentage) terms and in absolute (€ billion) terms. Unlike most other services (where there was a sizeable rebound in 2021), travel services had a modest increase in the value of exports and imports. Growth in 2022 was considerably stronger, however the levels of exports and imports in 2022 remained below their pre-pandemic levels (in 2019). The EU exported travel services to non-member countries valued at €146 billion in 2022, while imports stood at €96 billion; these values were 11.4 % and 16.1 %, respectively, lower than in 2019.
An alternative analysis, based on the share of travel services within the total value of the EU’s extra-EU trade in services shows the impact of the COVID-19 crisis on this category of services: travel’s share of services exports fell from 15.4 % in 2019 to 5.9 % in 2020, while its share of services imports fell from 11.3 % to 4.7 %. The combined modest recovery in 2021 and stronger one in 2022 brought these shares to 11.2 % and 8.6 % in 2022.
The EU recorded a trade surplus for travel services during every year from 2012 to 2022 – in other words, the expenditure of people from the EU visiting the rest of the world was lower than the expenditure of people from non-member countries visiting the EU (see Figure 6). The largest trade surplus was recorded in 2019 prior to the onset of the pandemic, as the value of EU exports of travel services was €49.7 billion higher than that of imports. The trade surplus fell to €12.0 billion in 2020 (the lowest recorded levels for the observed period), recovered somewhat to €19.1 billion in 2021 and then in 2022 nearly returned to its peak, reaching €49.5 billion.
Source: Eurostat (bop_its6_det)
When considering the principal extra-EU trade partners for travel services, it is important to note that many international borders were closed in 2020 and/or 2021 as part of containment strategies to deter the spread of COVID-19. This led to most international passenger travel services being restricted for several months. Even after travel restrictions were relaxed, many individuals were deterred from travelling due to the cost of testing, risk of infection and/or the risk of travel restrictions being (re)introduced. Given their close geographic proximity, it is perhaps unsurprising to find that the United Kingdom and Switzerland were the EU’s main trading partners for travel services in 2021. The United Kingdom accounted for almost one quarter (23.5 %) of extra-EU exports of travel services, while the share for Switzerland was 16.2 %; the United States had the third highest share (13.6 %).
The United Kingdom was also the largest partner for the EU’s imports of travel services in 2021, its 13.2 % share of EU imports was down from 14.5 % in 2011 (see Figure 7). Some 10.7 % of the EU’s imports of travel services in 2021 originated in Switzerland and 9.9 % in the United States. The share for the United States was considerably lower than in 2011, down 5.6 percentage points from 15.5 %.
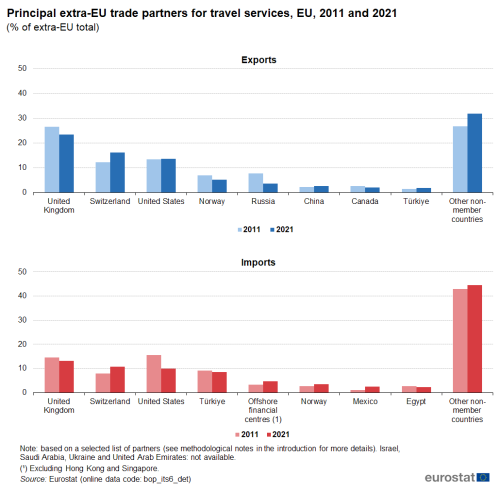
(% of extra-EU total)
Source: Eurostat (bop_its6_det)
The relative importance of travel services as part of total trade in services was generally quite high in a number of EU Member States traditionally associated with tourism. For example, in 2022 travel services accounted for 66.0 % of all services exported by Croatia and just under half of the total in Portugal (47.8 %). By contrast, travel accounted for less than 10.0 % of all services exported by 10 Member States, with the lowest shares in Belgium (5.0 %), Luxembourg (4.0 %) and Ireland (1.7 %).
Other business services
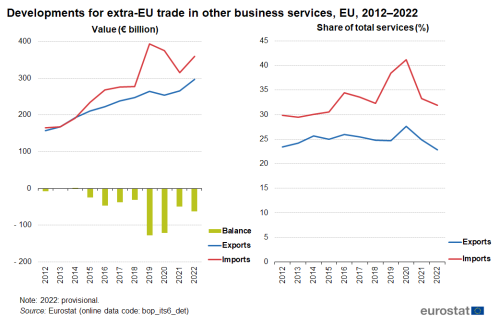
As noted above, the category covering ‘other business services’ includes a diverse range of services, including R&D, legal services, accountancy and management consultancy, and real estate services. Figure 8 shows the development of international trade for the other business services aggregate, with the EU recording a trade deficit throughout the period from 2012 to 2022, except in 2014 (when there was a small surplus of €1 billion); the largest deficit was recorded in 2019 (€128 billion).
The value of exports and imports of other business services increased at a relatively steady pace between 2012 and 2019 (with notably faster growth for imports towards the end of this period). In 2020, the impact of the COVID-19 crisis led to exports falling 4.0 % and imports falling 4.7 %; note these rates are based on data in current price terms. This pattern accelerated for imports in 2021, with a 16.0 % fall, whereas there was a rebound for exports (up 4.5 %). As a result, the EU’s trade deficit for other business services narrowed to €49 billion in 2021. The EU recorded growth for exports and for imports in 2022, up 12.0 % and 14.2 %, respectively. The deficit widened to €62 billion in 2022, approximately half the level it had been in 2019.
Source: Eurostat (bop_its6_det)
Figure 9 shows the relative importance of the different business services as regards their contribution to EU exports and imports in 2021. The largest subcategory for exports was legal, accounting and management consulting services, which accounted for more than one quarter (26.9 %) of the EU’s other business services exports. The same subcategory also recorded the highest share for imports, accounting for almost one third (32.3 %) of the EU’s imports of other business services. For exports and for imports, the second and third largest subcategories were R&D work undertaken on a systematic basis to increase the stock of knowledge, and architectural, engineering and scientific services.

(% share of total for other business services)
Source: Eurostat (bop_its6_det)
In 2021, the United States was the EU’s main trade partner for exports of other business services as well as for imports of these services. It accounted for 24.3 % of extra-EU exports and 32.2 % of extra-EU imports of other business services. The United Kingdom also recorded relatively high shares for both indicators, with a 20.4 % share of the EU’s extra-EU exports and a 21.4 % share of imports.
Between 2011 and 2021, several substantial developments can be noted.
- The United States’ shares of the EU’s extra-EU exports and imports increased substantially, up 4.5 and 5.0 percentage points, respectively.
- The share of the EU’s extra-EU imports provided by offshore financial centres also increased, up 4.9 percentage points.
- Switzerland’s share of the EU’s extra-EU exports decreased, down 4.9 percentage points, as did the United Kingdom’s share of the EU’s extra-EU imports, down 5.0 points.
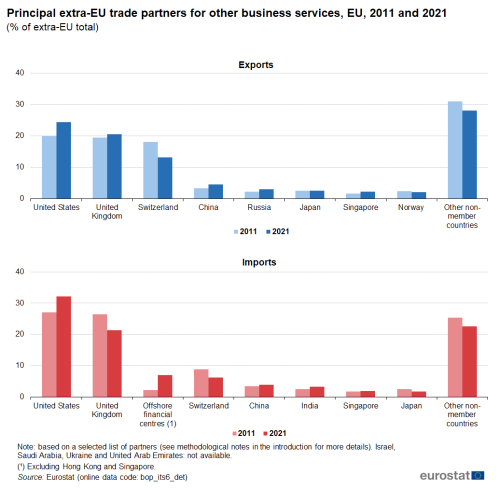
(% of extra-EU total)
Source: Eurostat (bop_its6_det)
Services trade by enterprise characteristics (STEC)
Some data collections were initiated in order to provide answers to questions such as: who are the services traders, are service traders foreign-owned, and how many people do service traders employ? As such, a first set of experimental data on services trade by enterprise characteristics (STEC) has been collected.
Statistics on services trade by enterprise characteristics (STEC) present traditional services trade statistics broken down by the characteristics of the enterprises involved in such trade.
STEC data are produced by combining statistical business register information with data on international trade in services at the enterprise level. This makes it possible for records with the value of each enterprise’s exports and imports to be linked to the equivalent enterprise’s characteristics that are provided in the business register. The resulting dataset of the population of traders can be analysed, for example, by the size of enterprise, the type of ownership of the enterprise, or its main economic activity. By linking these different datasets it is possible to give more value to the data that has been collected without any additional burden on enterprises and with only modest costs for the compilers of these statistics.
The development of STEC statistics represents a notable step towards integrating statistics on international trade in services into business statistics. Regular data reporting for the EU and EFTA countries has been included as part of Regulation (EU) 2019/2152 on European business statistics; the first reference period for this data collection is 2022.
Source data for tables and graphs
Data sources
Tables in this article use the following notation:
| Value in italics | data value is forecasted, provisional or estimated and is therefore likely to change. |
Direct access to
Metadata
- Balance of payments – international transactions (BPM6) (ESMS metadata file – bop_6_esms)
Further methodological information