Foreign direct investment - intensity ratios
Data extracted in July 2023.
Planned article update: August 2024.
Highlights
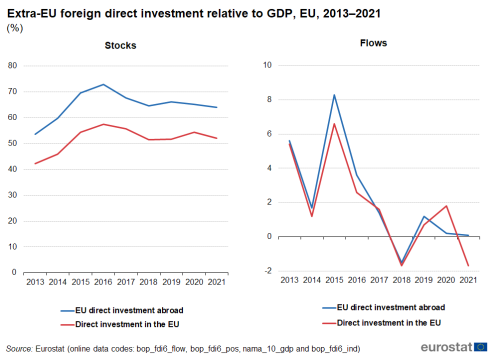
Relative to GDP, EU foreign direct investment stocks abroad fell in 2021; this was the fourth time in the five most recent years for which data are available that they had fallen, having previously risen between 2013 and 2016.
In 2021, extra-EU foreign direct investment relative to GDP was lower for inward flows (-1.7 %) than for outward flows (0.2 %).

(%)
Source: Eurostat (bop_fdi6_flow), (bop_fdi6_pos), (nama_10_gdp) and (bop_fdi6_ind)
Globalisation patterns in EU trade and investment is an online Eurostat publication presenting a summary of recent European Union (EU) statistics on economic aspects of globalisation, focusing on patterns of EU trade and investment.
Investors generally balance expectations of risk and reward. As such, economies characterised by economic and/or political uncertainty are likely to deter investors. By contrast, economies with good fundamentals (for example, relatively low inflation and interest rates, a stable currency, respect for intellectual property rights) are more likely to attract international investment.
Although foreign direct investment (FDI) indicators – such as financial flows, investment positions, and income flows – are not components of gross domestic product (GDP), a set of normalised ratios may be calculated comparing these indicators to GDP, thereby permitting a comparison of results between economies of different sizes. The resulting FDI intensity ratios provide one means for assessing investment integration within the international economy. These ratios form the basis of this article.
Full article
Foreign direct investment: EU stocks and flows
Relative to GDP, EU stocks of outward FDI rose between 2013 and 2016, fell between 2016 and 2018 and were comparatively stable in the most recent years
The most striking feature of Figure 1 is the contrast between the intensity ratios for FDI stocks and flows. The latter were more volatile, with an oscillating pattern (note the different scales in the two parts of the figure).
Since 2013 (the start of the time series), the EU's outward investment position has been positive. In other words, the value of the EU's outward stocks of FDI has exceeded the value of inward stocks. In 2021, the ratio of the EU's outward stock of FDI (relative to GDP) was 64.1 %, while the stock of inward investment in the EU (relative to GDP) was 52.0 %. Between 2013 and 2016, there was a relatively rapid and continuous increase in the EU's FDI stocks relative to GDP, as the intensity ratio for outward stocks rose by 19.2 percentage points (pp) and that for inward stocks by 15.2 pp. This trend reversed in 2017, as both the value of outward and inward stocks relative to GDP fell, as they did again in 2018.
- Inward stocks relative to GDP increased in 2019 and 2020 but remained below the 2016 peak; they fell again in 2021. Relative to GDP, inward stocks in 2021 were 5.4 pp below their 2016 peak but 9.8 pp above their level at the start of the time series (2013).
- Outward stocks relative to GDP also increased in 2019 but fell in both 2020 and 2021. Relative to GDP, outward stocks in 2021 were 8.8 pp below their 2016 peak but 10.4 pp above their level at the start of the time series (2013).

(%)
Source: Eurostat (bop_fdi6_flow), (bop_fdi6_pos), (nama_10_gdp) and (bop_fdi6_ind)
In 2021, outward flows of FDI from the EU exceeded the flow of inward investment into the EU
As mentioned above, the pattern of developments for FDI flows was quite different from that of FDI stocks. It is important to note that the time series presented in Figure 1 begins in 2013, several years after the global financial and economic crisis; by 2013, inward and outward flows of FDI had started to recover from that crisis. Nevertheless, investment flows relative to GDP followed a fluctuating pattern between 2013 and 2021, suggesting there was a sustained period of uncertainty among investors.
- Between 2013 and 2016, the development for the intensity of flows – both outward and inward – fluctuated between increases and decreases on an annual basis.
- The situation changed in 2017 as the intensity ratio for EU outward and inward investment flows fell for a second consecutive year; in 2018, a third consecutive annual fall was recorded as the flows turned negative (indicating reverse investment or disinvestment in both directions).
- In 2019, the intensity ratios for FDI flows returned to positive – although relatively low – values.
- In 2020, the direction of change for the intensity ratios diverged for the first time during the period under consideration. The ratio for inward flows increased again, albeit by a smaller amount than in the previous year, while the ratio for outward flows declined slightly.
- In 2021, the intensity ratios for both flows again moved in the same direction as both fell. The ratio for inward flows decreased more strongly and turned negative, while the fall for the ratio for outward flows was more modest (and remained positive).
Foreign direct investment: flows to and from the EU Member States
Figure 2 shows a comparable set of investment intensity ratios based on outward and inward flows of FDI to/from the EU Member States; note that negative flows indicate reverse investment or disinvestment, with at least one of equity capital, reinvested earnings or intra-company loans being negative. For individual Member States, it is also important to consider that investment flows can be very 'lumpy', especially if these concern sizeable investment decisions taken by large multinational enterprises; consequently, they can change greatly from one year to the next.

(%)
Source: Eurostat (bop_fdi6_flow) and (nama_10_gdp)
Seven of the EU Member States recorded negative ratios (relative to GDP) of outward flows of direct investment in 2021. In Luxembourg and Cyprus, these were valued at -189.8 % and -144.0 %, respectively, of the size of the national economy, while in Malta the ratio was -42.0 %. Smaller negative outward investment flows were recorded for the Netherlands, Estonia, Portugal and Spain. By contrast, Ireland reported the highest positive intensity ratio of outward flows of direct investment in 2021, 11.2 %, the only Member State to record a double-digit value.
Concerning inward investment, five negative intensity ratios were recorded in 2021, the largest also being in Luxembourg and Cyprus, -322.8 % and -125.8 % of GDP, respectively. Smaller negative ratios were recorded for the Netherlands, Ireland and Italy. Malta (20.5 %) was the only EU Member State to record a positive ratio of inward investment relative to GDP that was in excess of 10.0 %, the next highest ratio being 9.4 % in Hungary.
High intensity ratios for FDI flows may reflect significant capital flows linked to the activities of special purpose entities (SPEs).
Special purpose entities
Box 1 – Special purpose entities
Special purpose entities (SPEs) are legal entities that are formally registered with a national authority and subject to the legal and tax obligations of the country in which they are resident. They are ultimately controlled by a non-resident institutional unit and usually they have very few employees and little (or no) productive capacity or physical presence in the host country. Most of their assets and liabilities represent investments in or from other countries and their core business consists of holding/financing non-resident companies on behalf of their enterprise group, as well as channelling funds between affiliates.
The activities of SPEs are a concern for policymakers insofar as there is potential for a substantial division between the productive investments of multinational enterprises and the income they generate. There are a number of international efforts to tighten controls, for example the Action Plan on Base Erosion and Profit Shifting (BEPS) initiative launched in 2013. In October 2021, 136 countries and jurisdictions joined the Statement on the Two-Pillar Solution to Address the Tax Challenges Arising from the Digitalisation of the Economy. This involves a major reform of the international tax system, including the introduction of a minimum 15 % corporation tax rate from 2023 for enterprises with revenue above a certain threshold. It is planned that the signing of a multilateral convention for this agreement will be opened in the second half of 2023 with the objective of it entering into force in 2025.
By excluding foreign investments of resident SPEs, policymakers may have a better idea as to the real potential impact of FDI on their economies.
Important: note that data presented in this chapter (Globalisation patterns in EU trade and investment – Foreign direct investment) for the EU and its Member States include special purpose entities (SPEs) and that this probably results in stocks and flows of FDI in the EU and its Member States being overstated in relation to the 'real' economic impact of such investments. Indeed, the OECD Benchmark Definition of Foreign Direct Investment (2008) recommends publishing data for SPEs separately, in order to permit a more representative analysis of the productive impact of foreign investment on national economies. In this way, it is likely (but not always the case) that stocks and flows of inward and outward FDI will be smaller. Furthermore, if information on SPEs is removed from FDI statistics, the geographical distribution of FDI will also be impacted (those countries where SPEs play an important role will generally see their shares fall). In a similar vein, such changes may also impact information analysed by economic activity – for example, the relative weight of the business services sector may be reduced, as it includes holding companies.
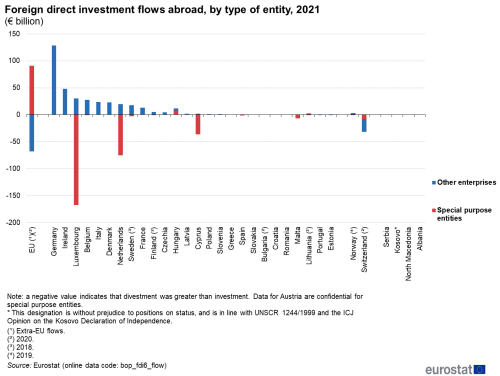
Luxembourg is a leading example of an economy where SPEs play a considerable role as many of its FDI transactions are made by investment funds and holding companies. In 2021, the total level of outward FDI from Luxembourg was -€137.2 billion; however, the value for SPEs was -€167.6 billion, compared with €30.3 billion for other enterprises (if SPEs are excluded from the analysis); see Figure 3. The presence of SPEs may also explain the relatively high share of FDI flows relative to GDP in the Netherlands and Hungary.

(€ billion)
Source: Eurostat (bop_fdi6_flow)
Source data for tables and graphs
Direct access to
- Balance of payments statistics and International investment positions (BPM6) (t_bop_q6)
- Annual national accounts (t_nama10), see:
- Balance of payments – International transactions (BPM6) (bop_6), see:
- European Union direct investments (BPM6) (bop_fdi6)
- Annual national accounts (nama10), see:
- Main GDP aggregates (nama_10_ma)
Metadata
- Balance of payments – international transactions (BPM6) (ESMS metadata file – bop_6_esms)
- European Union direct investments (BPM6) (ESMS metadata file – bop_fdi6_esms)
- Annual national accounts (ESMS metadata file – nama10_esms)
Further methodological information