Archive:Agricultural census in Norway
This article has been archived.
This article is part of a series of country-specific essays on the results of the European Union (EU) Farm structure survey (FSS) 2010. The FSS collects information on the structural characteristics of the agricultural holdings (land use, livestock and labour force) and is carried out every 10 years as an Agricultural census by all the Member States of the European Economic Area (EEA), with two or three additional, intermediate sample surveys carried out in-between. In Norway, the Agricultural census 2010 was fully harmonised with the EU regulations, in accordance with the agreement of the European Economic Area. The present analysis of the farm structure includes a comparison with the previous (2000) Agricultural census. Although the reference years of the Agricultural census in Norway were 1999 and 2010 respectively, the common designation is Agricultural census 2000 and 2010.

Source: Eurostat (ef_kvaareg) (ef_ov_kvaa) (demo_pjan) and FSS 2000 and 2010
Source: Eurostat (ef_kvaareg) (ef_ov_kvaa) and FSS 2000 and 2010
Source: Eurostat (ef_kvaareg) (ef_ov_kvaa)
Source: Eurostat (ef_lu_ovcropaa) (ef_oluaareg)
Special value: "-" not applicable
Source: Eurostat (ef_lu_ovcropaa) (ef_oluaareg)

Source: Eurostat (ef_mptenure)

Source: Source: Eurostat (ef_pmhouscatlaa)
Main statistical findings
Key indicators
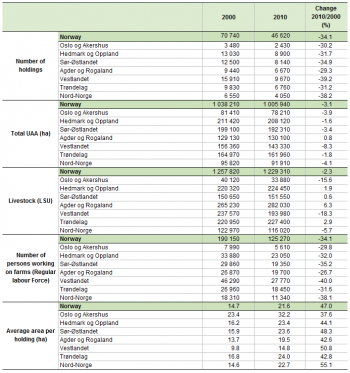
As exhibited in Table 1, in 2010 there were 46 620 agricultural holdings in Norway, one of the smallest values within the EEA. Compared to the FSS 2000, this constitutes a 34.1 % decrease – about 24 000 farms ceased their activities within the inter-census decade.
In contrast, the utilised agricultural area (UAA) remained rather stable over the 2000-2010 timeframe, measuring about 1 million hectares in both reference years. In absolute terms, the agricultural area decreased by only about 32 000 hectares (-3.1 %) within the period under analysis and it was found to cover only 3.1 % of the territory of the whole country in 2010, the smallest share amongst the surveyed countries. The Norwegian agricultural area was one of the smallest among EEA Member States and the smallest among the Nordic countries.
As the agricultural land did not change considerably but the number of holdings largely fell, the average area per farm increased remarkably (+ 47 %) – from 14.7 hectares per farm in 2000 to 21.6 ha per holding in 2010 – suggesting that small farms were taken up by bigger ones over the inter-census timeframe. This phenomenon, commonly observed among the EEA Member States, was further confirmed by the fall in the number of persons regularly working in agriculture, which dropped by 34.1 %: from 190 150 in 2000 to 125 270 in 2010. Accordingly, in 2010 the Norwegian agricultural labour force represented only 4.8% of the active population[1], one of the lowest shares among EEA Member States.
In Norway, the livestock population – expressed in Livestock units (LFS) – remained fairly stable at about 1.2 million LSU in both reference years; among the Nordic countries, both Denmark (4.9 million LSU) and Sweden (1.7 million LSU) recorded higher values than Norway in 2010. In absolute terms, the Norwegian population of farm animals dropped by only 28 000 LSU (-2.3 %) within the 2000-2010 decade, while most of the surveyed countries experienced a sharper decline.
Regional key indicators
Further insight into the structure of the Norwegian agriculture is provided by the regional analysis exhibited in Table 2. In terms of the number of holdings, the aforementioned decrease was found to be spread out fairly evenly so that all the Norwegian territories recorded populations below the 10 000 threshold in 2010. The region of Vestlandet maintained the leading position, while at the same time suffering the highest relative decline: according to the FSS 2010 it recorded the highest number of farms (9 670), a decrease of 39.2 %, in Norway, as it also did in 2000, and it accounted for 21 % of the entire population (its share was 22 % in 2000). The second highest figure was recorded by the territory of ‘Hedmark og Oppland’ – 8 900 farms, corresponding to 19 % of the whole population of holdings – while the region of Sør-Østlandet recorded the third highest number of farms (8 140) and accounted for 17 % of the entire population.
In terms of the agricultural area, ‘Hedmark og Oppland’ proved to be the most important region as 208 120 hectares of agricultural land were recorded within its borders in 2010 – a value which corresponded to 21 % of the entire Norwegian UAA. The territory of ‘Sør-Østlandet’ registered the second highest figure (192 310 ha) and accounted for 19 % of the country’s UAA, whereas ‘Trøndelag’ recorded the third highest value: 161 960 hectares, corresponding to 16 % of the whole agricultural area. All other regions had shares below 15 % in 2010.
With reference to the livestock population, expressed in LSU, the territory of ‘Agder og Rogaland’ was the most important one in 2010. Compared to 2000, it recorded the highest increase (+6.3 %), indicating 282 030 LSU in 2010, a value which corresponded to 23 % of the whole population of farm animals – in 2000 the corresponding figure was 21 %. On the other hand, the region of ‘Vestlandet’ recorded the highest decrease (-18.3 %) over the inter-census decade, though it still accounted for 16 % of the Norwegian livestock in 2010. The territories of ‘Hedmark og Oppland’ and ‘Trøndelag’ recorded very similar values – 224 450 LSU were surveyed in the former region, 227 400 LSU in the latter – and both accounted for 18 % of the Norwegian livestock: the second highest shares recorded within the Scandinavian country.
According to the FSS 2010, 27 770 persons were regularly working on the farms within the territory of ‘Vestlandet’. Although this represents a 40 % decrease compared to 2000 (- 18 520 persons), the mentioned territory proved to be the leading one as it recorded the highest share of the total agricultural labour force (22 %) in 2010. The second highest figure was recorded in ‘Hedmark og Oppland’, where 23 050 persons were recorded as regularly working in agriculture, a value which corresponded to 18 % of the country’s regular agricultural labour force in 2010.
Agricultural holdings
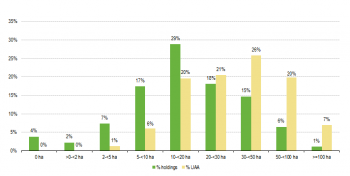
According to the FSS 2010, the majority (60 %) of Norwegian farms proved to have less than 20 hectares of agricultural land. On the other hand, these farms only accounted for 27 % of the whole Norwegian UAA, as they covered 271 060 hectares of agricultural area in 2010. On the other side, 18 820 farms (40 %) recorded 20 hectares or more of UAA and accounted for 73 % of the Norwegian UAA (734 880 ha) in 2010.
As exhibited in Figure 1, agricultural holdings with 10 to 19.9 hectares of UAA were by far the most common, as they represented 29 % of the whole population (13 440). On the contrary, only 500 holdings (1 %) recorded 100 hectares or more of UAA in 2010 – they accounted for 7 % of the Norwegian agricultural area.
Similarly to many other EEA Member States, the decrease in the number of holdings was found to affect the small farms rather than the bigger ones, suggesting that small farms were absorbed by the big ones over the inter-census decade. Accordingly, farms with 2 to 4.9 hectares of agricultural area experienced the sharpest decrease (- 69 %), followed by those with less than 2 ha of UAA (- 68 %). On the contrary, 500 farms with 100 hectares or more of UAA were registered in 2010 whereas only 130 of them were recorded in 2000. Similarly, the number of holdings with 50 to 99.9 hectares of agricultural land more than doubled over the period under analysis, from 1 450 in 2000 to 3 020 in 2010.
See detailed data at NUTS 2 level for 2010 and 2000
Economic size of the farm
According to the FSS 2010, the economic size of all the Norwegian agricultural holdings was EUR 3 156 million (see Table 3). This value, calculated by summing up all the standard outputs (SO) per hectare of crop and per head of livestock of the farms, represented a 4.1 % increase compared to 2007. Among the Nordic countries, both Denmark (EUR 8 431 million) and Sweden (EUR 3 733 million) recorded higher values than Norway, whereas the Finnish agricultural holdings had a slightly smaller economic size (EUR 3 098 million) in 2010.
Accounting for 34 % of the SO of the country, agricultural holdings with an economic size of EUR 100 000 to 250 000 were found to be the most important ones in 2010. Compared to the FSS 2007, this class of farms recorded the highest growth (+20.9 %), reaching a value of EUR 1 074 million in 2010. More generally, the larger size classes experienced an increase of relative importance at the expense of the smaller categories.
Among the different regions, the territory of Agder og Rogaland was the most important one, as it accounted for 19.6 % of the economic size of the Norwegian population of holdings in 2010 (EUR 619 million). A very similar value was recorded in Hedmark og Oppland (19.2 %), while Trøndelag and Sør-Østlandet recorded shares of 17.6 % and 17.3 % respectively. On the other end of the scale, the only two single digit percentages were recorded in Nord-Norge (7.4 %) and Oslo og Akershus (4.6 %) – in absolute terms, the former region accounted for EUR 234 million while the latter had a value of EUR 144 million.
See detailed data at NUTS 2 level for 2010 and 2007
Agricultural holding by main type of farming
The harsh weather conditions which characterise Norway, together with the peculiar morphology of its territory, have an impact on the agricultural production of this Nordic country. Accordingly, concerning the main type of farming, holdings specialised in sheep, goats and other grazing livestock were found to be the most common: they represented 27 % of the total population of farms in 2010 (see Figure 2). The second most common type of farms were those specialised in dairying (18 %), followed by the ones specialised in cereals, oilseed and protein crops (17 %). Agricultural holdings dedicated to the production of general field cropping accounted for 11 % and recorded the only other double digit share.
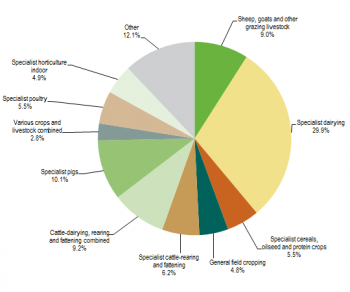
If the economic size of the holdings is taken into account, the ranking looks different and highlights the existence of a major type of production. Indeed, farms specialised in dairying were found to be the most important ones, accounting for 30 % of the SO of all the Norwegian farms in 2010. Agricultural holdings dedicated to pigs recorded the second highest share (10 %), whereas farms specialised in any other type of production fell below the 10 % threshold. The most common type of farm, holdings specialised in sheep, goats and other grazing livestock, contributed only 9 % of the total SO.
See detailed data at NUTS 2 level for 2010
Land use
The utilised agricultural area (UAA) is the total area – taken up by arable land, permanent grassland and meadow, permanent crops and kitchen gardens – used by the holding, regardless of the type of tenure or whether it is used as a part of common land.
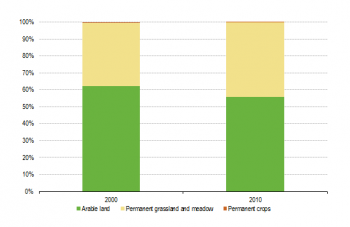
In Norway, arable land and permanent grassland and meadow are the main components of the UAA, as together they covered 99.7 % of the country’s agricultural area in 2010. Their respective shares of the total agricultural land slightly changed over the years, as the area dedicated to arable land decreased by 13 % while permanent grassland and meadow gained importance (+ 13.4 %).
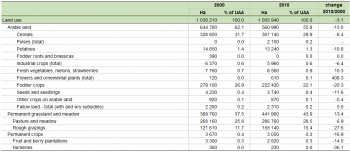
It must be noted that for the sake of comparability between the reference years that the data presented in Table 4 have been recalculated and differ from the ones in Eurostat database. Norway applied the EU definition in collecting information on arable land (temporary grassland) and permanent grassland and meadow (excluding rough grazing) in 2000. Accordingly, a five year threshold was used to distinguish temporary grassland from permanent grassland. As a result, 249 023 ha of temporary grassland were included within the arable land as they were found to fall below the 5 year threshold, whereas 238 639 ha were recorded as permanent grassland in 2000. In 2010, on the other hand, the national definition of arable land (temporary grassland) was used and the age of temporary grassland was ignored, hence 476 545 ha were included in arable land. This change of definition mostly explains the change in composition of the Norwegian UAA.
Despite losing about 84 000 hectares compared to 2000, in 2010 arable land was still the main component of the Norwegian agricultural area and accounted for 55.8 % of it. On the other hand, permanent grassland and meadow gained about 52 000 hectares and accounted for 43.9 % of Norwegian agricultural land in 2010.
See detailed data at NUTS 2 level for 2010 and 2000
Arable land
In 2010, arable land was essentially taken up by cereals and fodder crops, with cereals covering the widest area – 301 140 hectares, corresponding to 29.9 % of the entire UAA – and fodder crops taking up 222 420 hectares of agricultural area and indicating a share of 22.1 %.
See detailed data at NUTS 2 level for 2010 and 2000
Permanent grassland and meadow
Thanks to a 13.4 % rise over the inter-census decade, the land dedicated to permanent grassland and meadow was found to cover 441 900 hectares of agricultural area (43.9 %) in 2010. In particular, the area dedicated to pasture and meadow was found to cover the widest portion of UAA (28.5 %) and accounted for 286 760 ha. Also the area dedicated to rough grazing increased (+27.6 %), reaching a value of 155 140 hectares – 15.4 % of the country’s UAA – in 2010.
See detailed data at NUTS 2 level for 2010 and 2000
Livestock
Statistics on livestock might employ the livestock units (LSU) or the number of heads (number of animals) as reference units – with the former allowing comparison between different types.
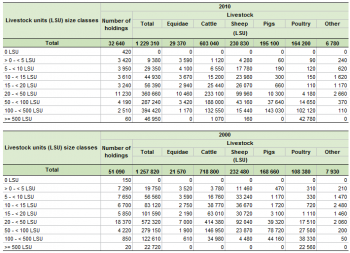
In Norway, 1.2 million LSU were recorded in 2010 (see Table 5), a value which represents a 2.3 % decrease compared to 2000. Accounting for about half of the Norwegian farm animals, cattle represented by far the most important livestock and recorded 603 040 LSU in 2010 – compared to 2000, a 16 % decrease was registered. Also sheep recorded a remarkable share (19 %); moreover, their value remained fairly stable over the period under analysis falling by only 1 %. Both pigs and poultry recorded similar percentages over the total population of livestock – 16 % for pigs, 13 % for poultry – and were found to have increased in number. Pigs showed a growth of 16 % compared to 2000 whereas poultry displayed a remarkable 51 % rise, from 108 380 LSU to 164 200.
Within the 2000-2010 timeframe, the Norwegian population increased by 8.5 % while the livestock decreased by 2.3 %; thus, the number of livestock per inhabitant dropped, from 0.28 to 0.25. Furthermore, the number of holdings with livestock fell (-36 %) more than the total population of farms; as a consequence, the share of holdings with livestock among the population of farms dropped – from 72 % in 2000 to 70 % in 2010 – although this is still one of the highest percentages within the EEA. In terms of size class, the highest decrease was registered among farms with 5 to 9 LSU (-48 %), while holdings with 100 to 500 livestock units tripled: 850 of these farms were registered in 2000 whereas 2 510 were recorded in 2010.
About one forth (23 %) of the Norwegian livestock was found within the territory of Agder og Rogaland, which also accounted for 5 900 holdings with farm animals. The regions of Trøndelag and Hedmark og Oppland proved to have a very similar population of farm animals and both accounted for 18 % of the country’s livestock. Nonetheless, 4 670 holdings with LSU were registered in Trøndelag whereas 5 650 of them were recorded in Hedmark og Oppland.
See detailed data at Nuts 2 level for 2010 and 2000
Labour force
In Norway, the agricultural labour force dropped by about one third (-34.1 %) over the inter-census decade; 190 150 persons were regularly working in agriculture in 2000 while only 125 270 were left in 2010 (see Table 6): among the Nordic countries, both Sweden (141 530) and Finland (125 290) recorded higher values than Norway in 2010. If the direct labour force is taken into account, in terms of the annual work units (AWU), the drop looks slightly sharper (-36.3 %), as figures decreased from 68 170 AWU in 2000 to 43 430 AWU in 2010.
The analysis of the geographical distribution of the agricultural labour force highlights the importance of the territory of Vestlandet. In terms of AWU, Vestlandet was found to account for 21 % of the entire Norwegian labour force directly employed by the holding. The region of Hedmark og Oppland (19 %) recorded the second highest percentage, a value slightly higher than the one recorded in Agder og Rogaland (17 %).
In terms of sole holders, the gender distinction proved to be very marked in Norway as 85 % of sole holders were found to be male in 2010. Moreover, no sign of a diversion of this tendency was found as a very similar figure (86 %) was also recorded in 2000.
See detailed data at NUTS 2 level on holders' age and gender for 2010 and 2000
See detailed data at NUTS 2 level on type of labour force for 2010 and 2000
Management practices
Type of tenure
As exhibited in Table 7, in 2010 most of the Norwegian agricultural area (58.4 %) was found to belong to the farmers who actually worked on that land (see Table 7). On the other side, 41.6 % of the country’s UAA (418 430 ha) proved to be farmed by tenants. Agricultural area utilised in partnership by the landlord and the sharecropper under a written or oral share-farming contract is non-existent in Norway.
Animal housing
In 2010, there were 16 900 holdings farming 874 530 heads of cattle in Norway (see Table 8). The vast majority of these farms (72 %) proved to host cattle in stanchion tied stable with slurry, while the type of housing where the animal is able to move freely with slurry was found to be the second most common one in terms of holdings (29.2 %) and accounted for 337 410 places.
In Norway, the total number of places (920 090) slightly exceeded the number of heads of cattle, suggesting that the hosting capacity of the country was not fully exploited in 2010 – this also explains why the related percentage was more than 100. Furthermore, it must be noted that holdings could record more than one type of animal housing.
Other gainful activities
With 25 500 holdings recording other gainful activities in 2010, Norway was among the EEA Member States with the highest number of farms with activity other than farm work, directly related to the holding and having an economic impact on it. In fact, in relative terms Norway recorded the highest value, as 55 % of the country’s population of farms recorded other gainful activities: Denmark – another Nordic country – recorded the second highest percentage (52 %) in 2010.
As exhibited in Table 9, forestry work was by far the most common source of extra income in Norway as it was observed on 14 560 farms in 2010. 6 450 holdings were also engaged in the related activity of woods processing. Also contractual work was found to be widespread: it was practised by 10 830 holdings, mostly engaged in contractual non-agricultural work (7 630).
See detailed data at NUTS 2 level for 2000
Organic farming
Organic agriculture is an ecological production management system that promotes and enhances biodiversity, biological cycles, and soil biological activity. It is based on the minimal use of off-farm inputs and on the management practices that restore, maintain or enhance ecological harmony.
As displayed in Table 11, both the number of farms practicing organic farming and the UAA under organic farming constantly grew in Norway. Accordingly, 4.3 % of the Norwegian agricultural area was found to be dedicated to organic farming in 2010. This is much less than in the neighbouring country of Sweden (10.1 %).
See detailed data at Nuts 2 level for 2010, 2007, 2005, 2003 and 2000
Data sources and availability
Methodological notes
In Norway, the Agricultural Census 2010 covered all the information required by the European Economic Area (EEA) agreement and was conducted by the Division for Primary Industry Statistics of Statistics Norway.
Survey on agricultural production methods (SAPM)
In 2010 a unique survey was carried out together with the Agricultural census: the Survey on agricultural productions methods (SAPM). This survey collected data at regional level needed to establish agri-environmental indicators as indicated in COM final 508/2006 and to evaluate the greening of the Common agricultural policy.
Data were collected according to specifications listed in Annex V of Regulation 1166/2008, namely data on tillage methods, soil conservation, landscape features, animal grazing, animal housing, manure application, manure storage and treatment facilities and irrigation.
In Norway, the SAPM was conducted as a sample survey together with the Agricultural census – from the 20th of April to the 20th of June 2011. A stratified sampling method based on location, Utilised Agricultural Area and farm type was used to select the farms: 9 233 holdings were surveyed, accounting for 20 % of the census population.
Reference period
Data were collected with reference to the 31st of July 2010, with the exception of the number of sheep which was collected with reference to the 1st of June 2010 or at the beginning of the grazing season. Information on the labour force and irrigation refers to the 12 months before the 31st of July 2010. Data on animal housing, manure application and manure storage were collected with reference to 2010, whereas information on tillage methods and soil conservation refers to the 2009-2010 timeframe.
Threshold for agricultural holdings
Both the FSS and the SAPM targeted all agricultural holdings with at least 0.5 hectares of UAA or 0.1 ha of permanent outdoor crops. Moreover, farms falling below these thresholds based on UAA but complying with a set of different physical thresholds related to the hectares of certain types of crops or heads of cattle were also included in the target population of both surveys.
The Norwegian thresholds are compliant with the EU Regulation 1166/200 and have remained almost unchanged since the Agricultural census 2000 (In 2010, holdings with at least 25 bee hives have been included); hence the FSS 2010 is for all intents and purposes comparable with the previous iterations.
Common land
Common land is the land that does not directly belong to any agricultural holding but on which common rights apply. It can consist of pasture, horticultural or other land. The treatment of the common land used by an agricultural holding might differ from country to country.
In Norway, there are very small portions of common land thus it is considered a non-significant characteristic. Where common land exists it is distributed among the users and included in the holdings.
Geo-reference of the holding
In Norway, the National Cadastre System contains the coordinates of all the properties and buildings; therefore, it was used to locate the agricultural holdings. For confidentiality reasons, 5 neighbouring holdings were allocated the same coordinates.
Economic size
From FSS 2007 onward, the standard output (SO), a new classification of the economic size of the holding is used. The SO has replaced the standard gross margin (SGM) used before. Nonetheless, for comparability reasons, in FSS 2007 both classifications are available.
Statistical regions
During the inter-census period, one municipality has been moved from the region of "Vestlandet" to the region of "Agder og Rogaland". This may slightly influences the figures and thus the comparison.
Other methodological issues
In Norway, the national definition of arable land was applied in the FSS 2010 whereas the EU classification was employed in 2000. Accordingly, information on temporary grass and pasture and meadow (excluding rough grazing) was collected on the basis of two different methods resulting in a break in the time series[2]. For the sake of comparability, 2010 data presented in Table 4 were recalculated using the EU definition; hence they differ from the ones in the Eurostat online database.
Context
European Commission Rural development policy aims to improve competitiveness in agriculture and forestry, the environment and the countryside, as well as the quality of life in rural areas and to encourage the diversification of rural economies.
As agriculture has modernised and the importance of industry and services within the economy has increased, so agriculture has become much less important as a source of jobs. Consequently, increasing emphasis is placed on the role farmers can play in rural development, including forestry, biodiversity and the diversification of the rural economy, in order to create alternative jobs and provide environmental protection in rural areas.
The FSS continues to adapt in order to provide timely and relevant data to help analyse and follow these developments.
See also
- Agricultural census 2010
- All articles on Norway
- All farm structure articles by country
- Farm structure statistics
Further Eurostat information
Publications
- Agriculture, fishery and forestry statistics — Main results – 2010-11 - 2012 edition
- Farm Structure Survey in Norway - 2007 - Statistics in focus 100/2009
- Farm Structure in Norway - 2005 - Statistics in focus 46/2007
- Structure of Agricultural Holdings - Norway 2003 - Statistics in focus 40/2005
Main tables
- Agriculture, see:
- Farm structure: historical data (1990-2007) (t_ef)
Database
- Agriculture, see:
- Farm structure (ef)
Dedicated section
Methodology / Metadata
- Farm structure (ESMS metadata file — ef_esms)
- Methodological Report – FSS 2010 Norway
- Methodological Report – FSS 2007 Norway
Source data for tables and figures (MS Excel)
Other information
- Regulation 1166/2008 of 19 November 2008 on farm structure surveys and the survey on agricultural production methods and repealing Council Regulation 571/88
- Regulation 1200/2009 of 30 November 2009 implementing Regulation 1166/2008 on farm structure surveys and the survey on agricultural production methods, as regards livestock unit coefficients and definitions of the characteristics
External links
Notes
- ↑ A value calculated over the active population in the 4th quarter 2010 of the EU Labour force survey (LFS) Population, activity and inactivity - quarterly data
- ↑ More information on the change of the definition is available in the National Methodological Report 2010 at pages 5 and 6


