Archive:Agricultural census in Malta
This article has been archived.
This article is part of a series of country-specific essays on the results of the European Union (EU) Farm structure survey (FSS) 2010. The FSS collects information on the structural characteristics of the agricultural holdings (land use, livestock and labour force) and is carried out by all European Union Member States every 10 years as an Agricultural census, with two or three additional, intermediate sample surveys carried out in-between. In Malta, the FSS 2010 was the first Agricultural census to be carried out according to European legislation. The present analysis of the farm structure includes a comparison with the 2003 FSS, the first sample survey conducted in the country according to EU regulations.

Source: Eurostat (ef_kvaareg) (ef_ov_kvaa) (demo_pjan) and FSS 2003 and 2010
Source: Eurostat (ef_kvaareg) (ef_ov_kvaa)

Source: Eurostat (ef_lu_ovcropaa) (ef_oluaareg)

Source: Eurostat (ef_lu_ovcropaa) (ef_oluaareg)

Source: Source: Eurostat (ef_pmhouscatlaa)
Main statistical findings
Key indicators
In 2010 there were 12 530 agricultural holdings in Malta (see Table 1). Although the number of farms increased by 14 % after the year 2003, in 2010 Malta was still one of the EU member States with the smallest number of agricultural holdings. The increase of the number of holdings can be explained by two different factors: the systematic update of the registers (all Maltese farms were scrutinized) and the division of the land when inherited from the older generations.
According to the FSS 2010 data, in Malta the utilised agricultural area (UAA) represented 36.2 % of the whole territory and it covered 11 450 hectares, the smallest value recorded within the EU-27: after 2003, an increase of 6.1 % in the UAA was reported. In terms of the average size of the agricultural holdings, a negative growth was observed as the average size decreased slightly, from 1 ha in 2003 to 0.9 ha in 2010. It must be noted that the very opposite tendency was recorded in most of the EU Member State during the same timeframe.
Also in terms of the animal livestock, expressed in livestock units (LSU), Malta showed the smallest values within the EU-27: in 2010 42 910 LSU were recorded in Malta, a value which represented a decrease of 12.3 % when compared to 2003 data.
Between 2003 and 2010, the number of persons working in agriculture grew by 3.5 %, from 17 870 to 18 500. Accordingly, in 2010 the population working in agriculture represented 10.6 % of the economically active population of Malta.[1]
Agricultural holdings
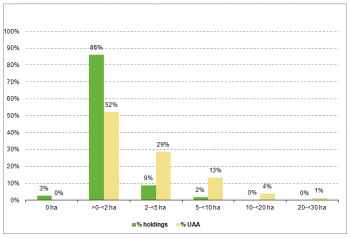
As exhibited in Figure 1, agricultural holdings were found to be rather small in Malta. According to the FSS 2010 data, 89 % of them had less than 2 hectares of UAA, while the remaining 11 % did not exceed 10 hectares of UAA. Moreover, 81 % of the UAA of the whole country belonged to agricultural holdings with less than 5 hectares of UAA; the remaining 19 % was covered by holdings which did not exceed the size of 30 hectares.
While in most of the European Union Member States the number of large agricultural holdings increased to the detriment of the small ones, in Malta the farms with less than 2 ha of UAA grew in number during the 2003-2010 timeframe: from 9 570 to 11 130 (+16.3 %).
Economic size of the farm
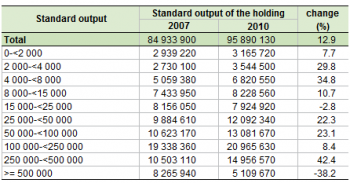
In 2010, the economic size of all the Maltese agricultural holdings was EUR 95.9 million (see Table 2), a value calculated by adding all the standard output (SO) per hectare of crop and per head of livestock of the farms. Compared to the FSS 2007 value (EUR 85 million), the 2010 data showed an increase of 12.9 %. Nonetheless, in 2010 Malta proved to be the country with the smallest economic size in terms of agricultural holdings within the EU-27.
As exhibited in Table 2, within the 2007-2010 period, the agricultural holdings with an economic size of more than EUR 250 000 and less than EUR 500 000 recorded the highest increase (42.4 %), while those with an economic size of more than EUR 500 000 suffered the largest fall (-38.2 %).
In Malta, the holdings with an economic size of more than EUR 100 000 represented 43 % of the total standard output of the Maltese agricultural holdings in 2010.
Agricultural holding by main type of farming
In terms of the main area of production, holdings specialised in general cropping were found to be the most common in Malta. According to the Agricultural census 2010, they represent about 31 % of the total number of holdings. Agricultural holdings classified as specialist it in outdoor horticulture accounted for 11 %. Farms specialised in sheep, goats and other grazing livestock represented 8 % of the total, a share slightly bigger than the one of the farms dedicated to mixed cropping (7 %). Finally, all the remaining types of farm, none of which recorded values higher than 4 %, grouped together accounted for the 18 % of the total number of holdings.
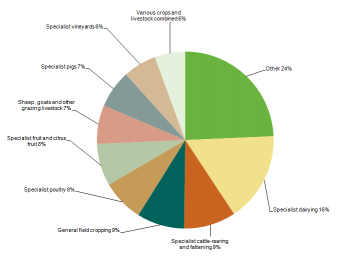
The hierarchy looks different when regarded in terms of the economic size. Indeed, when using the SO for measuring the main type of farming, agricultural holdings specialised in dairying proved to be the most important ones, representing the 16 % of the SO of all the Maltese agricultural holdings (see Figure 3). The second highest share came from holdings dedicated to cattle-rearing and fattening (9 %). Farms specialised in general field cropping accounted for about 9 % of the total standard output, whereas those specialised in poultry shared about 8 % of the country’s SO as well as the agricultural holdings dedicated to special fruit and citrus fruits.
Land use
The utilised agricultural area (UAA) is the total area taken up by arable land, permanent grassland and meadow (non-existent in Malta), permanent crops and kitchen gardens used by the holdings, regardless of the type of tenure or of whether it is used as a part of common land.
In Malta the UAA increased by more 660 hectares after 2003 (6.1 %), indicating the value of 11 450 hectares in 2010.
When comparing the FSS 2010 data with the FSS 2003 data, among the main categories of UAA the only remarkable change concerned the kitchen gardens, whose land grew significantly, more than doubling its value: it shifted from 420 ha to 1 120 ha. On the contrary, the share of the area occupied by arable land showed a small decrease (-2.3 %), from 9 290 hectares to 9 080 hectares, while the area of permanent crops increased slightly (15.7 %), from 1 080 ha in 2003 to 1 250 ha in 2010.
Arable land
In Malta, the land that is regularly worked (ploughed or tilled), generally under a system of crop rotation, decreased by 2.3 % within the 2010-2003 timeframe (see Table 3). This fall was mostly the result of reductions in the production of potatoes (-42.1 %), and fresh vegetables, melons and strawberries (-19.2 %). On the contrary, the cultivation of fodder crops increased by 6.7 % over the same period, covering the 48 % of the whole UAA of Malta. Thus, in terms of land use fodder crops represented by far the most important type of production in 2010.
Permanent crops
In 2010 the area under permanent crops represented 11 % of the UAA of Malta. This figure shows a small increase compared to 2003, when the land under permanent crops represented 10 % of the total UAA of the whole country. Although they recorded a 1.6 % drop over the 2003 value, in 2010 vineyards represented the most important type of permanent crops still accounting for the 5.3 % of the Maltese UAA (see Table 3).
Livestock
Statistics on livestock use two different units of measurement: the number of heads (number of animals) and the livestock units (LSU). The latter makes the comparison between different types of livestock possible.
According to the 2010 data, there were 0.1 LSU per inhabitant in Malta. Over the 2003-2010 period, the population of livestock decreased by 12.3 %, though the relative weight of the different types of livestock did not change. Accordingly, pigs, cattle and poultry remained the most important type of livestock, all together accounting for 92 % of the total LSU.
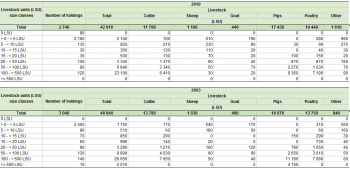
As showed in Table 4, they all decreased in number. Values for pigs moved from 18 970 LSU in 2003 to 17 450 LSU in 2010; for poultry they shifted from 13 750 LSU to 10 440 LSU; in the case of cattle they changed from 13 780 LSU to 11 780 LSU.
Also the number of agricultural holdings with livestock decreased (10 %) over the 2003-2010 period, from 3 040 to 2 740.
In terms of the size of the farms, according to 2010 data, only two classes of agricultural holdings increased in number compared to 2003 data: those with 5 to 9 LSU grew from 80 to 130 (63 %), and the ones with 20 to 49 LSU increased from 90 to 100 (10 %). On the other hand, the biggest class of farms (agricultural holdings with 500 or more LSU) ceased to exist, while farms with 10 to 14 LSU decreased by 57 %, and those with 15 to 19 LSU reduced by a half.
Labour force
In 2010, 18 500 persons were working in the agricultural holdings (see Table 5), a value which represents an increase of 3.5 % in comparison with the 2003 data, when 17 870 persons were working in the agriculture sector. This figure nearly doubles when the analysis takes in to account the labour force in terms of the annual work unit (AWU), reaching 7.8 %. Indeed, in absolute terms the labour force shifted from 4 480 AWU in the 2003 to 4 830 AWU in the 2010.
As exhibited in Table 5, in 2010 the direct labour force reached 4 870 AWU in Malta which represented an increase of 8.2 % over the 2003 data.
Management practices
Type of tenure
In Malta, according to the 2010 data, 2 720 hectares of UAA (23.8 %) belonged to the farmers who actually worked on that land (see Table 6). As in Malta there was no land under shared farming, it was the tenants who worked on the remaining 76.2 % (8 730 ha) of UAA. There have not been changes since 2003 in the type of tenure.
Irrigation
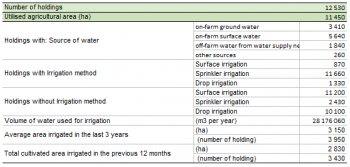
Between 2003 and 2010, the total irrigable area increased by 37 %, shifting from 2 300 to 3 150 ha. Furthermore, in 2010 the area irrigated at least once a year reached 2 830 hectares, corresponding to 25 % of the whole Maltese UAA. However, when analysing data on irrigation, it should be kept in mind that the extent of the irrigated area varies over the years according to the weather conditions.
In terms of the type of crops, the crop that had the largest share of irrigated area was potatoes. According to the 2010 data, its irrigated area was 630 ha, a share of 23 % of the total irrigated area of the country. With 430 ha of irrigated area, vineyards were the second most irrigated crop (15 %), followed by fruit and berry plantation (8 %). The citrus plantations accounted for 4 % of the total irrigated area (100 ha), whereas olive plantations accounted for a slightly smaller value (90 hectares), which represented 3 % of the total irrigated area of the country.
In Malta, in terms of the volume of water, 28.2 millions of cubic metres of water were used to irrigate 2 830 hectares of UAA in 2010: about 10 000 cubic metres per hectares. This value, which includes the water used for the kitchen gardens and area under glass, was estimated for the first time with the 2010 FSS.
Animal housing
According to the FSS 2010 data, there were 290 holdings raising 15 690 heads of cattle in Malta. Since 25 600 places for cattle were recorded in the island (see Table 8), the hosting capacity of the country proved to over pass largely its cattle population. In Malta no stanchion tied stables were registered. 97% of the places for cattle were of the loose housing with solid dung and liquid manure the remaining were in loose housing with slurry.
Other gainful activities
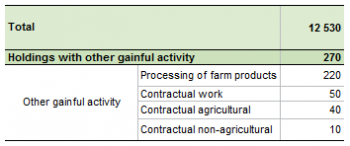
According to the data of the Agricultural census 2010, there were 270 holdings with other gainful activities in Malta. Representing only a small share of the whole population of agricultural holdings (0.02 %), these farms recorded activities other than farm work, directly related to the holding and having an economic impact on the holding.
Information on other gainful activities was collected by eleven category types depending on their characteristics. The most common one was processing of farm products, which included almost all the farms engaged in other gainful activities (220 holdings) according to FSS 2010 data. When analysing data on other gainful activities it must be noted that each holding can have more than one other gainful activity.
Organic farming
Organic agriculture is an ecological production management system that promotes and enhances biodiversity, biological cycles and soil biological activity. It is based on the minimal use of off-farm inputs and on management practices that restore, maintain or enhance ecological harmony.
Currently, in Malta there are 13 holdings that have around 7 hectares of UAA on which they practise organic farming. These holdings also account for 19 hectares of UAA which are undergoing conversion to organic farming.[2]
Data sources and availability
Methodological notes
In Malta, the National Statistics Office was the official body responsible for undertaking the Census of agriculture in 2010. As from its accession to the European Union, Malta has followed the legislation as laid down in Council Regulation 571/88 and has carried out a Farm Structure Survey in 2003, 2005 and 2007.
Survey on agricultural production methods (SAPM)
In 2010 a unique survey was carried out together with the Agricultural census: the Survey on agricultural productions methods (SAPM). This survey collected data at regional level needed to establish agri-environmental indicators as indicated in COM final 508/2006 and to evaluate the greening of the Common agricultural policy.
Data were collected according to specifications listed in Annex V of Regulation 1166/2008, namely data on tillage methods, soil conservation, landscape features, animal grazing, animal housing, manure application, manure storage and treatment facilities and irrigation.
Reference period
The Census provides a point-in-time stocktaking of utilised agricultural area (UAA), livestock and machinery with the reference date for these sections being 31 August 2010. The reference period for permanent crops, arable land, mushrooms, organic land and vines is 1 September 2009 – 31 August 2010. This reference period is also applicable for animal housing and labour force.
Preparatory work on the Census started during the first quarter of 2010 and was extended until the third quarter of 2010. The census was carried out from September 2010 to January 2011.
Threshold for agricultural holdings
No threshold was used in the Census and the full population in the agricultural register was taken into consideration for the Census of Agriculture 2010 and the Survey on Agricultural Production Methods (SAPM). The data collected in the Census is “As per holder’s declarations”.
Common land
Common land – which is the land that does not directly belong to any agricultural holding but on which common rights apply – is non-existent in Malta.
Geo-reference of the holding
The geographical reference of the holdings was collected in terms of the latitude and longitude of the holding, which was decided to be the centroid of the locality corresponding to LAU2/NUTS5.
The entire process was done by the Malta Environment and Planning Authority (MEPA).
Economic size
From FSS 2007 onward, the standard output, a new classification of the economic size of the holding, has been implemented. The SO has replaced the Standard gross margin SGM used before. Nonetheless, for comparability reasons, in FSS 2007 both classifications are available.
Volume of irrigation water
In 2008, a survey to estimate the volume of water used for irrigation was carried out, the results of the survey were used in a model along with other variables (type of irrigation and climatological data) to predict the volume of water used for irrigation.
Other methodological issues
Some of the characteristics presented in the Regulation 1166/2008 were not included in the FSS 2010 because they are not existent in Malta. A complete list of those characteristics is available in the National Methodological report.
Context
European Commission Rural development policy aims to improve competitiveness in agriculture and forestry, improve the environment and the countryside, improve the quality of life in rural areas and encourage the diversification of rural economies.
As agriculture has modernised and the importance of industry and services within the economy has increased, so agriculture has become much less important as a source of jobs. Consequently, increasing emphasis is placed on the role farmers can play in rural development, including forestry, biodiversity, the diversification of the rural economy, in order to create alternative jobs and environmental protection in rural areas.
The FSS continues to adapt in order to provide timely and relevant data to help analyse and follow these developments.
See also
- Agricultural census 2010
- All articles on Malta
- All farm structure articles by country (2007)
- Farm structure statistics
Further Eurostat information
Publications
- Agriculture, fishery and forestry statistics — Main results – 2010-11 - 2012 edition
- Farm Structure in Malta - 2007 - Statistics in focus 73/2008
- Farm Structure in Malta - 2005 - Statistics in focus 13/2006
Main tables
- Agriculture, see:
- Farm structure: historical data (1990-2007) (t_ef)
Database
- Agriculture, see:
- Farm structure (ef)
Dedicated section
Methodology / Metadata
- Farm structure (ESMS metadata file — ef_esms)
- [hthttp://ec.europa.eu/eurostat/documents/749240/749313/MT_NMR_FSS_2010.pdf/e2e189ef-7132-4110-bf03-3a01295a1db8 Methodological Report – FSS 2010 Malta]
- Methodological Report – FSS 2007 Malta
Source data for tables and figures (MS Excel)
Other information
- Regulation 1166/2008 of 19 November 2008 on farm structure surveys and the survey on agricultural production methods and repealing Council Regulation 571/88
- Regulation 1200/2009 of 30 November 2009 implementing Regulation 1166/2008 on farm structure surveys and the survey on agricultural production methods, as regards livestock unit coefficients and definitions of the characteristics
External links
Notes
- ↑ A value calculated over the total number of active people aged 15 to 64, as it is reported by the 4th quarter 2010 of the EU Labour force survey (LFS) by sex, age, nationality and labour status (1 000).
- ↑ Figures on organic farming have been provided by the Maltese National Statistics Office.
