Archive:Agricultural census 2010 - provisional results
This Statistics Explained article is outdated and has been archived - for recent articles on Agricultural census, see here
- Data from May-September 2011. Most recent data: Further Eurostat information, Main tables and Database.
This article presents the first results of the Agricultural census carried out in the European Union (EU) Member States, Norway, Switzerland, Croatia and Montenegro in 2010 (with the exceptions of Greece, Portugal and Spain, where the reference year of the census was 2009).
The preliminary results of this huge statistical operation, covering the structure of the European agricultural sector, are now already available for most of the countries. As soon as further provisional results come in, this article will be updated.
Main statistical findings
Number of holdings
In the last decade there has been a general tendency for reduction of the number of agricultural holdings in the European Union.
From 2003 to 2007 the Farm structure survey observed a 8.8 % reduction in the number of farms.
In most of the countries for which the data is available, this tendency continues in 2010 (Malta and Sweden are the exceptions).
Utilised agricultural area
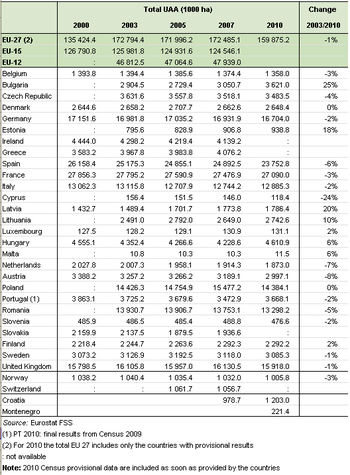
The area that is utilised by agriculture has been relatively stable within the EU - there is a slight tendency for increase in the 12 new Member States, while a small decrease in the old Member States (EU-15).
The provisional results for 2010 confirm this general tendency.
Cattle
Cattle represents close to 50 % of the European livestock units. The provisional results available show a reduction in the number of heads of cattle, that matches the trend verified over the past decade.
Data sources and availability
The values for Portugal are the final results of the 2009 Agricultural census, while the numbers for other presented countries are provisional.
Calendar for delivery of final results
The final results for all EU countries are to be delivered to Eurostat in the course of 2011 and 2012 and are foreseen to be all available during 2013.
The datasets will be included in the database as soon as they have been validated by Eurostat.
See also
- Agricultural census for links to national websites providing first results of the Agricultural census 2010
- Farm structure
Further Eurostat information
Database
- Agriculture (agri), see:
- Farm structure (ef)
Dedicated section
Source data for tables on this page (MS Excel)
Other information
- Regulation 1166/2008 of 19 November 2008 on farm structure surveys and the survey on agricultural production methods and repealing Council Regulation 571/88
- Regulation 1200/2009 of 30 November 2009 implementing Regulation 1166/2008 on farm structure surveys and the survey on agricultural production methods, as regards livestock unit coefficients and definitions of the characteristics


