Archive:Agri-environmental indicators - driving forces - input use
This Statistics Explained article is outdated and has been archived - for recent articles on Agri-environment indicators see here.
- Data from August 2011. Most recent data: Further Eurostat information, Main tables and Database.
Agriculture and the environment
With about 40 % of the EU’s land area being farmed, agriculture has a very important impact on the natural environment. Farming can have beneficial influences on the environment, for instance in creating valuable landscapes and habitats. But inappropriate agricultural practices and land use can also have an adverse impact on natural resources, like the pollution of soil, water and air, fragmentation of habitats and loss of wildlife.
Agri-Environmental Indicators (AEI)
The links between the richness of the natural environment and farming practices are complex. AEI are used to quantify and describe these complex relations between agricultural and agri-environmental policies, agricultural practices and the environment. AEI assess trends over time of;
- the effects of agriculture on the environment;
- the effectiveness and efficiency of agricultural and environmental policy measures.
The Commission is developing 28 indicators following the Driving Forces - Pressures - State - Impact - Response model. The DPSIR concept is an analytical framework that has been developed at the European Environment Agency (Environmental indicators - Typology and overview, EEA, 1999) in order to describe and understand the inter-linkages between economic activities and the environment relating to farming practices, agricultural production systems, pressures and risk to the environment and the state of natural resources.
Driving force indicators
The driving force indicators contribute to a better understanding of the state and evolution of regional farming systems in relation to input use, land use and management practices. They also shed light on general farm trends (intensification/extensification, diversification, and marginalisation) that can affect the conservation of environmental resources in either positive or negative ways.
The driving force indicators relate to:
- Input use: Mineral fertiliser consumption, Consumption of pesticides, Irrigation, Energy use,
- Land use: Land use change, Cropping patterns, Livestock patterns,
- Farm management: Soil cover, Tillage practices, Manure storage,
- Trends: Intensification/extensification, Specialisation, Risk of land abandonment.
In this article a selection of the input use indicators are explained:
- Mineral fertiliser consumption by agriculture
- Energy use by agriculture
Main statistical findings
 Mineral fertiliser consumption by agriculture

Fertilizers contain important nutrients, such as Nitrogen (N), Phosphorus (P) and Potassium (K), which plants absorb from the soil for their growth. Fertilizers are therefore an essential input in agricultural production. In addition to livestock manure used as an organic fertilizer, most farms — with the exception of organic farms — also apply large amounts of mineral fertilizers manufactured by the fertilizer industry. Food production nowadays is very much depending on the use of mineral fertilizers: Over the past 40 years, mineral fertilizers

accounted for an estimated 40 percent of the increase in world food production[1].
Unbalanced fertilizer applications (applications of fertilizers exceeding plants’ nutritional requirements) and farming practices can lead to nutrient losses to the air, soil, ground and surface water. Nitrogen emissions add to climate change and acidification. High concentration of nutrients in water bodies can lead to eutrophication. In order to limit the negative impact of fertilizer and manure use on the environment, a number of legislative measures have been taken, such as the Nitrates Directive, the National Emission Ceilings Directive and the Water Framework Directive, including designation of nitrate-vulnerable zones where Member States have imposed regulatory limits on the load and timing for fertilizer (and manure) spreading on agricultural land.
Mineral fertilisers also have adverse environmental effects stemming from their production processes. More specifically, nitrogenous fertilizers — the fertilizers most commonly consumed — require large amounts of energy and ultimately cause greenhouse gas emissions. In a completely different way, phosphorus and potash fertilizers also have an environmental impact, since the raw materials used to produce them are mined, therefore inducing the typical damage associated with mining, e.g. landscape destruction, water contamination, excessive water consumption and air pollution. Phosphate rock reserves are limited and only found in a few countries in the world. The EU is almost completely depending for the production of phophorus fertilizers on import from reserves located outside the EU. In a report of the Plant Research Institute (Wageningen, the Netherlands) on global P resources it is estimated that with current P consumption today’s economically exploitable resources will be depleted within 125 years and total reserves within 340 years. In some regions of the EU soils are saturated with phosphorous (for instance parts of the Netherlands and Belgium), and risk of phosphorous leaching and run-off is high. In other regions (for instance parts of Mediterrenean and East European countries) soils are phosphorous deficient, and risk of soil erosion and loss of soil fertility are high.
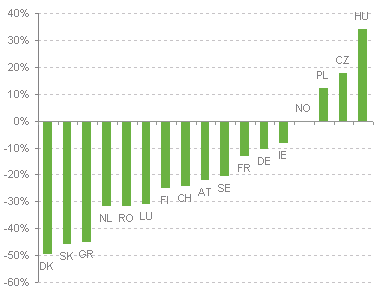
Between 1991 and 2006 the nitrogen fertiliser consumption increased in Poland, Czech Republic and Hungary, decreased in Austria, Schwitzerland, Germany, Denmark, Finland, France, Greece, Ireland, Luxembourg, Netherlands, Sweden, Romania and Slovakia and remained constant in Norway. The largest increase occurred in Hungary (+34%) and the largest decrease in Denmark (-49%). Phosphorous fertiliser consumption increased in Hungary (+33%) and decreased in Poland, Czech Republic , Austria, Schwitzerland, Germany, Denmark, Finland, France, Ireland, Luxembourg, Netherlands, Sweden, Romania and Slovakia. The largest decrease occurred in Slovakia (-80%).

Energy consumption by agriculture
Energy is consumed directly by agriculture with the use of machinery (e.g. cultivation of fields with tractors) and the heating of livestock stables and greenhouses. Agriculture also uses energy indirectly, for the production of agrochemicals, farm machinery and buildings. Considerable amounts of natural gas are used for th

e production of inorganic nitrogen fertilisers. The use of machinery and mineral fertilisers has made it possible to increase agricultural productivity and food supply. However, agriculture, as an energy user, contributes to the depletion of non-renewable energy sources and to global warming (CO2 emissions from fossil fuel combustion). The EU 2020 Strategy aims at a reduction of greenhouse gas emissions of 20%, 20% share of renewables in energy consumption and 20% increase in energy efficiency by 2020.
Energy consumption by agriculture in the EU27 decreased with 9% during the 90s and 11% during the last decade. The decline is relatively large compared to the achievement of other sectors; Total energy consumption increased in the '90s with 3% and decreased in the last decade with only 1%.
The share of agriculture in total energy consumption is only 2% of in the EU27 in 2008. The share of agriculture in total energy consumption is highest in the Netherlands (6%).
Energy consumption by agriculture decreased in the former 10 Central and East European countries (CEC)[2] with 62%, between 2000 and 2009 energy consumption by agriculture continued to decrease but at a slower rate (27%). In all CEC countries the energy consumption by agriculture showed sharp declines during the 90s except Poland where energy consumption increased with 43% and Slovenia where energy consumption remained rather stable (-1%). In most CEC countries energy consumption by agriculture continued to decrease in the last decade except Latvia (+30%) and Lithuania (+3%). The energy consumption by agriculture in EU15 increased with 6% during the 90s but decreased between 2000-2009 with 8%. Though energy consumption by agriculture increased in many countries in the EU15 during the 90s energy consumption by agriculture decreased or remained stable in Germany, Italy, Luxemburg, Austria, Finland, Sweden and the UK. Exceptions to the overall decreasing trend in energy consumption by agriculture in the last decade in the EU 15 are Belgium, Italy, Luxembourg, Austria and Finland.
The average energy consumption by agriculture in the EU27 expressed per ha UAA in 2007 is 158 KgOE per ha. Energy consumption varies between Member States and comparisons between countries cannot be made as the energy consumption is also depending on the structure of agriculture which varies significantly between countries. For example energy use is highest in the Netherlands which is however mainly due to greenhouses (81% of total energy consumption by agriculture in 2007 in the Netherlands is consumed by greenhouses). Intensive greenhouse farming is of significance in the Netherlands, but in most other countries greenhouse farming is non-significant or not existing. The indicator could therefore be improved if energy use could be differentiated by farm typology.
Oil contributes to 59% of total energy consumption by agriculture in the EU27 and is the dominant fuel type in most countries except the Netherlands (where gas is the dominant fuel type), Sweden (renewables) and UK (electricity).
Data sources and availability
Mineral fertilizer consumption by agriculture
At present no harmonised European statistics on mineral fertilizer use are available. In 2010 data have been requested from Member States with a specific Joint Eurostat/OECD Questionnaire on Agri-environmental Indicators. Member States have used different data sources to report total Nitrogen and Phosphorus use. Some Member States have carried out farmer surveys, others have estimated consumption from statistics on production and trade of mineral fertilizers. These data sources are however not comparable. Production and trade statistics may overestimate the actual consumption, as for instance the use of fertilizers by non-agriculture may be included. Surveys may suffer from sampling and other errors. Data on mineral fertilizer consumption from the Joint Questionnaire will be available in the Eurostat database as soon as possible. The European Fertilizer Manufacturers Association also estimates fertilizer consumption by agriculture, these data can be found under the heading Consumption estimate of manufactured fertilizers (source: Fertilizers Europe) in the Eurostat database.
Energy consumption by agriculture
The main data source for this indicator is the Joint Eurostat/IEA/UNECE questionnaires. Energy indicators are compiled on the basis of the data collected under the standard collection cycles of the "Energy Statistics Unit". The relevant energy data collections are regulated since 2008 with the entry-into-force of the Regulation (EC) No 1099/2008 of the European Parliament and of the Council of 22 October 2008 on Energy Statistics. Data on energy statistics can be found at Energy Statistics - supply, transformation, consumption in the Eurostat database. There are certain problems with the data on energy consumption by agriculture from this data source: The data on energy consumption by agriculture includes energy consumption by forestry, and in many cases energy consumption by fisheries as well. Data are also not always complete. It is not likely that the quality of the data source with regards to estimates on consumption by agriculture will be improved, as agriculture is of negliglible importance in the whole Energy Balance.
Data presented in this article are not directly comparable to the data found in the database, as certain corrections (for instance to exclude fisheries/forestry) have been made based on data received from Member States, for example data on Denmark have been derived from the environmental accounts of Denmark and data on Norway from the energy accounts of Norway. Data from the Joint Eurostat/IEA/UNECE questionnaires in Germany were incomplete and estimations have been made based on data available in previous years.
Data on UAA are derived from the Farm Structure Survey.
Context
Around 40 % of the EU’s land area is farmed. This fact alone highlights the importance of farming for the EU’s natural environment. The links between the two, however, are complex. On the one hand, farming has contributed over the centuries to creating and maintaining a variety of valuable semi-natural habitats and agricultural landscapes on which a wide range of wild species rely for their survival. On the other hand, agriculture also has an adverse impact on natural resources such as pollution of soil, water and air, fragmentation of habitats, and a loss of wildlife which can result from agricultural practices and land use.
This complex relationship has to be taken into account in integrating environmental concerns and safeguards into the Common agricultural policy (CAP), with particular attention paid to reducing the risks of environmental degradation through cross-compliance criteria (as a condition for benefiting from direct payments, farmers must comply with certain requirements, some related to environmental protection), incentives and targeted agri-environmental measures, in order to enhance the sustainability of agro-ecosystems.
The importance attached to assessing the interaction between agriculture and the environment is underlined by the fact that the European Commission adopted a list of 28 agri-environmental indicators (AEI) in 2006 in its Communication COM(2006) 508 final. The AEI are developed for monitoring the integration of environmental concerns into the common agricultural policy at EU, national and regional levels.
See also
- Agri-environment_indicators_-_essential_tools_to_assess_EU_agricultural_policy
- Supporting sustainable agriculture policies with multiple statistical answers
Further Eurostat information
Publications
- Agricultural statistics: Main results - 2008-09
- Agricultural statistics: Main results - 2007-08
- Environmental statistics and accounts
- From farm to fork - Focus on sustainable agriculture and fisheries statistics - SIGMA - The Bulletin of European Statistics, 01/2010
- Food: from farm to fork statistics
Main tables
Database
Dedicated section
Other information
- Commission Communication (2006) 508 final on the development of agri-environmental indicators for monitoring the integration of
environmental concerns into the common agricultural policy.
- Commission staff Working Document SEC(2006) 1136 on the development of agri-environmental indicators for monitoring the integration of environmental concerns into the common agricultural policy.
External links
- European Commission - Agriculture and Rural Development
- Food and Agriculture Organization of the United Nations - Natural Resources & Environment
- OECD - Agri-Environmental Indicators and Policies