Archive:Agri-environmental indicator - risk of land abandonment
This article has been archived. For further information about agri-environment, please see the Agri-environmental_indicators.
This article provides a fact sheet of the European Union (EU) agri-environmental indicator risk of land abandonment. It consists of an overview of data, complemented by all information on definitions, measurement methods and context needed to interpret them correctly. The risk of land abandonment article is part of a set of similar fact sheets providing a complete picture of the state of the agri-environmental indicators in the EU.
Source: EUROSTAT - Farm Structure Survey ef_r_farm
Source: EuroRegionalMap 2.2 (EuroGeographics), Urban morphological zones 2000 (EEA), Urban Audit 2007 (DG REGIO), SRTM mosaic Europe (JRC), CORINE Land Cover 2006 (2000 for Greece) (EEA)

Source: DG AGRI - FADN database, EUROSTAT - FSS, EuroRegionalMap 2.2 (EuroGeographics), Urban morphological zones 2000 (EEA), Urban Audit 2007 (DG REGIO), SRTM mosaic Europe (JRC), CORINE Land Cover 2006 (2000 for Greece) (EEA)

Source: DG AGRI - FADN database, EUROSTAT - FSS, EuroRegionalMap 2.2 (EuroGeographics), Urban morphological zones 2000 (EEA), Urban Audit 2007 (DG REGIO), SRTM mosaic Europe (JRC), CORINE Land Cover 2006 (2000 for Greece) (EEA)
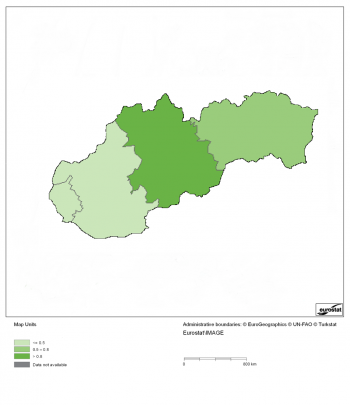
Source: DG AGRI - FADN database, EUROSTAT - FSS, EuroRegionalMap 2.2 (EuroGeographics), Urban morphological zones 2000 (EEA), Urban Audit 2007 (DG REGIO), SRTM mosaic Europe (JRC), CORINE Land Cover 2006 (EEA)
Farmland abandonment is a cessation of agricultural activities on a given surface of land which leads to undesirable changes in biodiversity and ecosystem services.
Main indicator
- The risk of farmland abandonment is estimated through statistical analysis of key drivers (see supporting indicators) combined into a composite index indicator.
Supporting indicators
- Weak land market
- Low farm income
- Lack of investment in the farm
- High share of farm holders over the age of 65 years
- High share of farm holders with low qualification
- Low farm size
- Remoteness and low population density
- Low share of farms committed to specific schemes linked to continue farming
Main statistical findings
Key messages
- Farmland abandonment due to economic, structural, social or difficult regional factors is estimated to have a higher risk in southern Member States (Portugal, Spain, Italy, Greece, Romania). In northern Europe, the risk is higher in the Baltic States, northern Finland and Sweden and in north-western Ireland.
- Amongst the NUTS 2 regions identified with the higher risk of farmland abandonment, the share of holdings with farm-type ‘grazing livestock’ is higher (around 30 %).
- Difficulties in the indicator compilation arise from data availability and resolution. Farmland abandonment appraisal requires to access data at very fine scale in order to assess the distribution of situations within a NUTS 2 region (avoiding regional averaging which masks specific situations). This was not possible with the Farm structure survey (FSS) dataset available to the European Commission Joint Research Centre. Moreover, it was found that official European datasets (FSS, Farm Accountancy Data Network (FADN)) do not hold the same level of geographic reporting amongst all Member States; thus creating time consuming processing and preventing building comparable outputs for all Member States.
Assessment
In the analysis that follows, results are presented by NUTS 2 region as this is the reporting unit provided by the Commission Communication COM(2006)508 final on agri-environmental indicators and because of the resolution available of inputs data (FADN and FSS). However, it is acknowledged that NUTS 2 regions often hold diverse agro-economic conditions and that farmland abandonment is a local phenomenon, not impacting the whole NUTS 2 area in a similar manner.
- Driver D1 - Weak land market
High land sales and rental prices are generally linked to a high demand for agricultural land and hence a lower risk of land abandonment. The FADN parameters ‘Rent paid, including rent for building, quotas’ and ‘Rented utilised agricultural area (UAA)’ are used in a ratio to provide proxy information on the rental price of agricultural land. The average is calculated for the 3 years (2006-2008) for each holding in the database.
Central European countries such as Poland, Slovakia, part of the Czech Republic, part of Hungary, Slovenia and part of Bulgaria have very low renting prices. A similar situation is encountered in the Baltic States and in northern Sweden (Map 1). This can be seen as a sign of a low demand for land, hence possibly leading to land abandonment.
- Driver D2 - Low farm income
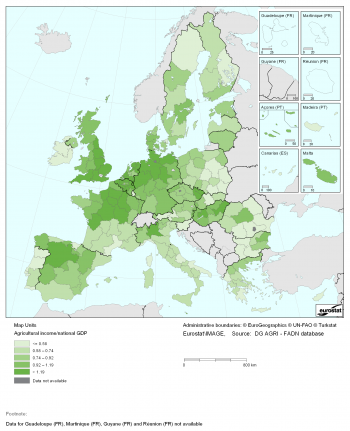
Farmland is at higher risk of abandonment as an economic resource when it ceases to generate a sufficient income. FADN variable ‘Farm net value added’ expressed per annual work unit (AWU) is used.
As the farming economical context is still very heterogeneous between Member States, a unique European threshold value for the farm income does not make sense (different economic and structural situations are present in Member States, in particular incomes are still very disparate - e.g. a low agricultural income in the Netherlands could still be a high value for Bulgaria. There is a ratio of 1 to 15 in EU-27 between the minimum and maximum regional agricultural income). Therefore, the methodology for Driver D2 on ‘Farm income’ compares the farm income to the national general income (all sectors) in order to identify differences; assuming that when differences are large, agriculture may not be economically sustainable anymore, leading to people leaving the farming sector for possible opportunities in other sectors. The weighted average farm income per annual working unit is calculated and compared to the gross domestic product (GDP) per capita at market prices - Euro per inhabitant (Source: Eurostat, nama_gdp_c). The national GDP is a proxy for the national income. In the analysis, the GDP per capita for the period 2006 - 2008 is used.
The higher risk appears on the first quintile (ratio < 0.58), identifying the whole of Ireland, most of Portugal, southern France (Languedoc-Roussillon in particular), central and southern Italy, the whole of Slovenia, mountain areas in western Austria, central and southern Greece, the whole of Cyprus, western Bulgaria, eastern Romania, central Slovakia, central/eastern and southern Poland, and some areas in northern Sweden and eastern Finland (Map 2).
Caution should be taken in interpreting these results as different situations in MS may have different underpinning explanations. Indeed, the results are based on farm income only, while the total household income may change the picture. Ability to pull income from diversification activities (tourism, external income for part-time work, external income of the partner,…) may matter to ensure the survival of rural families; however these data are not available in the dataset.
- Driver D3 - Low investment in the farm
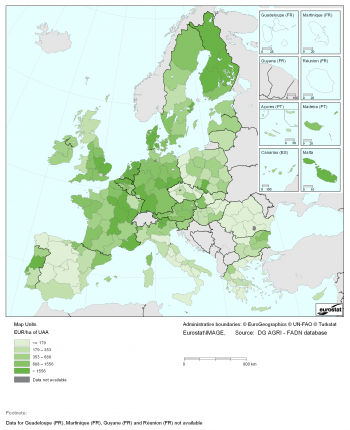
Investment behaviour reflects farm dynamism, its adaptation capacity and expectations about the future. New investments are a signal of a medium/long term strategy and can be a proxy of the willingness to continue farming activity.
In view of removing the bias as small farms have often lower investments (in absolute terms) than large farms, the amount of investment per holding was normalized by its physical size. FADN variables ‘Total investments before deduction of subsidies’ is divided by the holding size. Regions with the lower investment ratio are found in Spain (except north-east), in central and southern Italy, in most of Greece, the whole of Romania, in several Czechs regions and in western Poland (Map 3). The investment parameter in FADN database can have reliability weakness for some (Mediterranean) countries. Explanations provided by these MS refer to investment made with ‘family loans’. Many farmers considering those as private and do not report them in the farm accounts; consequently debts and investments are missing for these farms. This is a known issue in FADN database. Moreover, some Italian experts have mentioned some changes of definition for this parameter during the period 2006 - 2008 in Italy, acknowledging some possible data deficiencies.
- Driver D4 - Age of farm holder
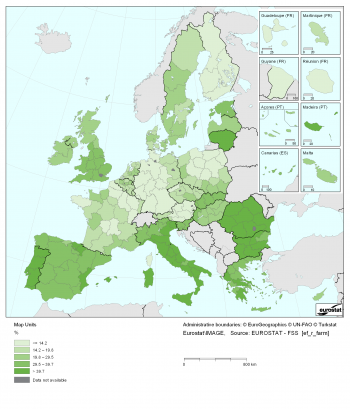
Farmland abandonment is more likely to occur when farmer population is old (close to retirement).
The ratio between farm holders above 65 years and the total number of farm holders has been calculated (Map 4) in order to have a proxy for the distribution of the farmers’ age population. There is an unfavourable age ratio in Portugal, most of Italy, southern Greece, Bulgaria, Romania and Lithuania with 40 % or more of the farm holders’ population above 65 years old.
- Driver D7 - Remoteness and low population density
Farmland abandonment is likely to occur in remote areas with insufficient access to basic services (healthcare, school, and other services) and fewer marketing opportunities.
Low population density: A geographic layer containing population density grid was used to classify the EU-27 local administrative unit (LAU 2) based on the OECD methodology to build LAU 2 typology (urban or rural) (Reference: European Environment Agency (EEA) - Population density). The population density information had been broken down into several classes. Very low densely populated areas (< 50 inhabitants per km2) were identified.
Remoteness: The travel time by road network to urban centres was selected as an indicator of remoteness. Travel time was computed for each LAU 2 to reach the closest urban centre (at least 50 000 inhabitants). Threshold of more than 1 hour travelling time was applied to identify remote LAU 2.
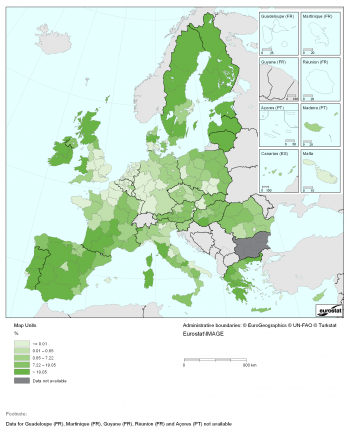
Agricultural area in remote and scarcely populated areas was estimated by overlaying Corine Land Cover (CLC) 2006 dataset (for Greece CLC 2006 is missing, CLC 2000 was used instead) to the geographic layer of remoteness/low population density. The share of this area compared to the total agricultural areas at NUTS 2 level (NUTS 1 for Germany and United Kingdom, NUTS 0 for Cyprus, Estonia, Lithuania, Luxembourg, Latvia, Malta, Slovenia) is shown in Map 5. Regions with the higher share of agricultural land (more than 19 %) in remote and scarcely populated areas occur in Portugal, Spain, south-west and Corsica in France, Tuscany/Molise and Sardinia in Italy, most of Greece, the Nordic Baltic States, Scotland and Wales, and Ireland.
- Composite index
The combination of single drivers into a composite index of risk of farmland abandonment is done through an empirical framework for building composite indicator, following a methodology proposed by the OECD (2008. The framework will be tested at European and at national levels based on their normalised values.
At EU-27 level Map 6 shows a ranking of NUTS 2 regions from the lower to the higher risk using 20 % quintile interval, combining the drivers with the highest data robustness and analytical soundness. These regions are found in Portugal, central Spain, Tuscany, Molise and Sardinia in Italy, part of Peloponnese/part of Macedonia in Greece, Latvia, Estonia, northern Sweden, and in Connacht and Donegal in Ireland. Surprisingly, Tuscany in Italy is identified under this scenario as a region with a higher risk of farmland abandonment. Data screening on the components of the composite index shows the three economic drivers (D1, D2, D3) with low values, comparable to southern Italian regions. But ‘farmers’ age’ and ‘remoteness’ are relatively high, identifying consequently Tuscany with a higher risk of land abandonment. The unexpected low value for D2 ‘farm income’ might be due to the presence of others source of income outside agriculture (e.g. diversification activities such as farm tourism) not included in the farm income. Information on the household income would be relevant for this point. Moreover, Italian experts have confirmed FADN data consistency issues in 2006 - 2007. It may also indicate the need to set different weighting factors on each driver in order to calibrate the model to better fit national conditions, as it looks like drivers 4 and 7 may need a lower weight, in Italy at least. However, this last point would require extensive experts’ consultation to reach a robust weighting system. A downscaling procedure from NUTS 2 to NUTS 3 level has also shown that it is only NUTS 3 ‘Grosseto’ with a high risk, demonstrating the usefulness of having detailed scale data for assessing the risk of farmland abandonment.
The normalisation procedure was also done at Member States level as farm land abandonment is a phenomenon very much linked to national economic, structural and political conditions. Maps are presented for two Member States (Spain and Slovakia) (Maps 7 and 8).
Data sources and availability
Indicator definition
Farmland abandonment is a cessation of agricultural activities on a given surface of land which leads to undesirable changes in biodiversity and ecosystem services.
Measurements
Main indicator
- The risk of farmland abandonment is estimated through statistical analysis of key drivers (see supporting indicators) combined into a composite index indicator.
Supporting indicators
- Weak land market
- Low farm income
- Lack of investment in the farm
- High share of farm holders over the age of 65 years
- High share of farm holders with low qualification
- Low farm size
- Remoteness and low population density
- Low share of farms committed to specific schemes linked to continue farming
Links with other indicators
The indicator "Risk of land abandonment" is linked to the following other indicators:
- AEI 01 - Agri-environmental commitments
- AEI 03 - Farmers’ training level
- AEI 04 - Area under organic farming (see Organic farming statistics)
- AEI 10.1 - Cropping patterns
- AEI 10.2 - Livestock patterns
- AEI 12 - Intensification/extensification
- AEI 23 - High Nature Value farmland
- AEI 28 - Landscape-state and diversity
Data used and methodology
- Data source for drivers D1, D2, D3
Farm Accountancy Data Network (FADN) is a European system of sample surveys conducted every year to collect structural and accountancy data on farms, with the aim of evaluating the impact of the Common agricultural policy (CAP). It covers only farms above a minimum size. In 2006 FADN farms represented 43 % of the farm population in the Farm structure survey (FSS), but 93 % of utilised agricultural area (UAA) and 94 % of livestock units (LSU).
- Data source for drivers D4
The purpose of the Farm structure survey is to obtain reliable data, at regular intervals, on the structure of agricultural holdings in the European Union. It provides harmonized data on a number of agricultural holdings, land use and area (crops), livestock, farm labour force (including age, gender, education), economic size of the holdings, type of activity, other gainful activity on the farm, system of farming, machinery.
- Data source for driver D7
For travel time: EuroRegionalMap road network, communes database (GISCO)
For population density: SIRE database (2001, Eurostat) for population per commune and Corine Land Cover (CLC) for the spatialisation
Identification of urban centres: Urban Audit 2007 cities (source: DG Regional and Urban Policy)
The Urban Morphological Zones derived from CORINE Land Cover 2000 and the disaggregated map of population density (source: European Environment Agency).
For agricultural areas: Corine Land Cover (CLC) 2006 dataset
- Data for mapping all drivers
The administrative boundaries from the EuroBoundaryMap database (EBM 2001 Census, scale: 1/100 000) (Source: EuroGeographics), EuroRegionalMap (ERM v2.2) database (scale:1/250 000) by EuroGeographics
An expert panel of 12 European scientists in fields related to land abandonment (bio-physical/land suitability, farm structure, farm economics, land market, regional development, socio and economic factors in rural areas) and with a good geographic representativeness of EU-27 Member States were tasked to identify the main drivers of farmland abandonment in Europe. Two sets of criteria for the risk of farmland abandonment have been suggested as follows:
- For low farm stability and viability
This is estimated through drivers on low farm income’ (D2), ‘low investments on the farm’ (D3), ‘farm-holder’s age’ (D4), ‘farm manager qualifications’ (D5), ‘low farm size’ (D8), ‘farm enrolments in specific management scheme’ (D9).
- For negative regional context
This is estimated through indicators on ‘weak land market’ (D1), ‘low density population and remoteness’ from market opportunities and major services (D7).
Each of these drivers has been calculated individually; an assessment has been done providing relevance and robustness of the results, maps have been produced.
The results suggest a first group of powerful drivers (policy relevant, analytically sound, data available and robust) composed of: ‘weak land market’ (D1), ‘low farm income’ (D2), ‘low density population and remoteness’ (D7). The second group of drivers with ‘low investments on the farm’ (D3) and ‘farm-holder’s age’ (D4) are policy relevant but some issues were found on data when using European datasets. The third group of drivers with ‘farm manager qualifications’ (D5), ‘low farm size’ (D8), and ‘farm enrolments in specific management scheme’ (D9) have deficiencies in analytical soundness and/or data reliability. They were not used further in the analysis.
In order to produce a single indicator of ‘risk of farmland abandonment’, composite indices (gathering several drivers into one value) have been developed based on Principal Component Analysis carried-out on the normalised values of the individual drivers. The normalisation procedure has been made at 2 different levels: (a) EU-27 level as an attempt to elaborate a risk composite index covering EU-27 in an homogeneous manner; and (b) Member States level. In the latter case, the assumption is made that one cannot compare, in absolute value, situations from Member States having heterogeneous economic and structural developments of the agricultural sector. Otherwise, we may find regions in many new Member States being at risk and very few for western European regions. Therefore, drivers are normalised for each Member State separately.
The scientific literature widely agrees that farm land abandonment is a local specific phenomenon, requiring availability of local data to estimate its risk. When the assessment objective is the European level, lack of accessibility to local data is clearly an issue.
Whether from FADN or from FSS, the resolution of input data available in European databases varies from Member State to Member State, going from NUTS 3 level in the best case, to NUTS 0 level in the worst. This heterogeneity of input data is a source of difficulty and inaccuracy in the aggregation process to build comparable and homogeneous pan-European drivers of farmland abandonment at NUTS 2 level.
Unavailability of some data, mainly FSS microdata occured. Despite these data exist and are available in Eurostat, it was not possible for our project to have access to them. This situation is linked to Member States’ decision limiting access to FSS microdata. This has resulted in an incomplete processing for driver D8 related to farm size, and no possibility to build driver D6 for the trend of loss of UAA.
Moreover, difficulties were encountered with the identification codes of administrative units which change occasionaly in time (redefining of some of the administrative units by Member States). Consequently NUTS codes are not consistent in time and space, requiring important manual fixing and visual screening to find correspondences between tabular and geographic datasets. This is a very time and resources consuming process and not all codes can be fixed, resulting into some gaps in the datasets.
Context
Farmland abandonment is commonly understood as the cessation of agricultural activity on a given surface of land. This process has been observed in many regions of Europe at different periods. Farmland abandonment bears significant environmental consequences and is often associated with social and economic problems in rural areas. Therefore, risk of farmland abandonment is a process driven by a combination of social, economic, political and environmental factors.
Policy relevance and context
Food security is one of the major challenges of the future given the outlook of increasing global demand faced with uncertainties of supply linked to unpredictable economic and political, climatic and biological developments. The European Union has a justified strategic interest to keep its agricultural production potential in view of the short and long term needs such as food, feed, fibre and biomass production.
Moreover, the environmental effects of farmland abandonment may imply loss of landscape and biodiversity, and increased vulnerability to natural disasters.
There is a fear that agricultural and trade reforms will reduce the economic viability of farming in Europe and lead to further abandonment of more marginal agricultural areas.[1] The reasons for and consequences of farmland abandonment are very diverse across the EU while at the same time they can be potentially very serious. For this reason, farmland abandonment has attracted considerable attention from policy makers, at national and EU level.
Farmland abandonment has a biophysical and a socio-economic dimension. Increasingly policy makers have made an effort at the EU level to bring these two dimensions closer to each other. This is reflected - for example - in the way that the common agricultural policy (CAP) has progressively included more environmental requirements attached to the necessary management of agricultural land.
To avoid land abandonment, the CAP offers two main instruments with the objective of keeping farming in place and thereby contributing to maintaining the production capacity of European agriculture:
- Decoupled direct payments contribute to stabilizing and enhancing farm income. Besides this role, direct payments, in combination with cross-compliance, underpin the respect of basic requirements for agricultural activities. Cross compliance consists of mandatory requirements related to the environment, food safety, animal health and welfare (Statutory Management Requirements (SMR)). Furthermore, it includes the requirement to keep land in good agricultural and environmental conditions (GAEC). If a farmer does not respect these basic requirements on all his land, his direct payments are reduced or entirely cancelled. Linking direct payments to basic agricultural land management requirements helps to protect natural resources and maintain the capacity to produce, also on marginal land which might be at risk of abandonment.
- Compensatory payments in Areas of Natural Constraints (ANC) help maintain farming activity in areas which, due to adverse natural conditions, are less profitable. This concerns in particular marginal areas or mountainous areas were the ANC payments contribute to avoiding land abandonment and, thereby, negative effects for the environment and/or the attractiveness of the rural areas in question.
Agri-environmental context
By managing a large part of the European Union's territory, agriculture preserves farm resources, biodiversity, and a wide range of valuable habitats. Many of these habitats and related species have a direct interdependence with agriculture. Agriculture is also the first to benefit from biological diversity. However, the maintenance of a number of ecosystems that have emerged from agricultural cultivation depends on the continuation of appropriate land management practices.
Whilst land abandonment is often viewed negatively, it is not always clear that land abandonment is detrimental. For example, in terms of nature conservation, Keenleyside and Tucker (2010)[2] note: “In many circumstances abandonment may be damaging as it will threaten a range of semi-natural habitats and associated species of nature conservation importance, many of which are concentrated in Natura 2000 sites and other High Nature Value (HNV) farmland. But in some locations, abandonment could be highly beneficial, particularly in highly fragmented landscapes and where it could provide the opportunity for significant large-scale restoration of non-agricultural habitats (e.g. re-wilding).‟
See also
- Agri-environmental indicators (online publication)
Further Eurostat information
Publications
- Agriculture, forestry and fishery statistics — 2016 edition (Statistical book)
- Energy, transport and environment indicators - 2016 edition
- Agriculture, fishery and forestry statistics - 2015 edition
- Food: from farm to fork statistics - 2011 edition
- Environmental statistics and accounts in Europe - 2010 edition
Database
- Agriculture (agri), see:
- Farm structure (ef)
- Farm structure: historical data (1990-2007) (ef_h)
- Farm structure by region, main indicators (ef_r_main)
- Structure of agricultural holdings by eurofarm region, main indicators (ef_r_farm)
- Farm structure by region, main indicators (ef_r_main)
- Farm structure: historical data (1990-2007) (ef_h)
- Farm structure (ef)
- Economy and finance, see:
- National accounts (including GDP) (ESA 95) (na)
- Annual national accounts (nama)
- GDP and main components (nama_gdp)
- GDP and main components - Current prices (nama_gdp_c)
- GDP and main components (nama_gdp)
- Annual national accounts (nama)
- National accounts (including GDP) (ESA 95) (na)
Dedicated section
Source data for tables and figures (MS Excel)
Other information
- Commission Communication COM(2006)508 final - Development of agri-environmental indicators for monitoring the integration of environmental concerns into the common agricultural policy
- Agri-Environmental Indicators, see:
- Corresponding IRENA Fact sheet 17
External links
- Publications
- European Commission - DG Agriculture and Rural Development
- Database
- Other external links
- European Commission - DG Agriculture and Rural Development
Notes
- ↑ Renwick A., Jansson T., Verburg P-H., Revoredo-Giha C., Britz W., Gocht A. and McCracken D. (2011). Policy Reform and Agricultural Land Abandonment. 85th Annual Conference, April 18-20, 2011, Warwick University, Coventry, UK 108772, Agricultural Economics Society.
- ↑ Keenleyside, C and Tucker, G M (2010) Farmland Abandonment in the EU: an Assessment of Trends and Prospects. Report prepared for WWF. Institute for European Environmental Policy, London

