Archive:Agri-environmental indicator - renewable energy production
This article has been archived. For further information about agri-environment, please see the Agri-environmental_indicators.
This article provides a fact sheet of the European Union (EU) agri-environmental indicator production of renewable energy from agriculture and forestry. It consists of an overview of recent data, complemented by all information on definitions, measurement methods and context needed to interpret them correctly. The production of renewable energy from agriculture and forestry article is part of a set of similar fact sheets providing a complete picture of the state of the agri-environmental indicators in the EU.
The indicator gives an indication of the importance of the agricultural and forestry sectors in the total production of energy. In particular, the trend[1] of the production of renewable energy shows the contribution of agriculture and forests towards the 2020 renewable energy targets, according to which the EU has committed to obtain 20 % of its energy from renewable sources by 2020.
Main indicator:
- Share of primary energy production of renewable energy from agriculture and forestry to total energy production in the EU-27.
Supporting indicators:
- Share of primary energy production of renewable energy from agriculture and forestry to total renewable energy production.
- Production of renewable energy from agriculture, calculated by summing fuel bioethanol production, biodiesel production and biogas production.
- Production of renewable energy from forestry.
- Estimation of the agricultural area of energy crops (utilised agricultural area (UAA)) devoted to the production of renewable energy).
Main statistical findings
Key messages
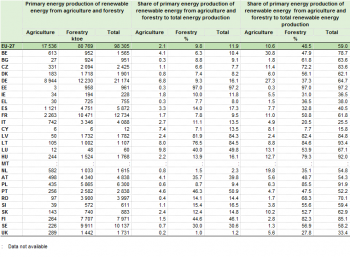
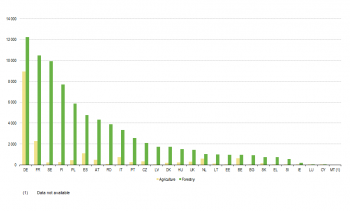
- EU agriculture and forestry play an increasing role in supplying renewable energy. The production of renewable energy from agriculture and forestry in the EU-27 reached 98.4 million tonnes of oil equivalent in 2010. Forestry is by far more important in absolute term (80.8 million tonnes) than agriculture (17.5 million tonnes).
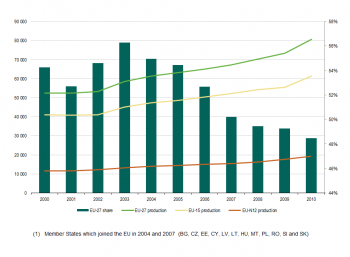
- The primary energy production of renewable energy from agriculture and forestry in the EU-27 in the year 2010 represented 11.9 % of the total primary energy produced and 59 % of the total renewable energy produced. While the production of renewable energy from the forestry sector accounts for 9.8 % of the total primary energy and 48.5 % of the total renewable energy, the agricultural sector contributes only 2.1 % and 10.6 %, respectively.
- However, the production of renewable energy has increased more rapidly in the agricultural sector than in the forestry sector. The production of renewable energy from agriculture increased by almost sevenfold between 2004 and 2010 whilst the production from forestry increased by 54 % in the period 2000-2010 at an average annual growth rate of 4.4 %.
- The contribution of agriculture to the total production of primary energy and to the total production of renewable energy increased by 1.8 percentage points between 2004 and 2010 (from 0.3 % to 2.1 %) and by 8.4 percentage points (from 2.2 % to 10.6 %) respectively. The share of forestry in the total primary energy production increased by 4.2 percentage points between 2000 and 2010 (from 5.6 % to 9.8 %), whereas the contribution of forestry to the total production of renewable energy decreased by 5.8 percentage points (from 54.3 % to 48.5 %) in the same period.
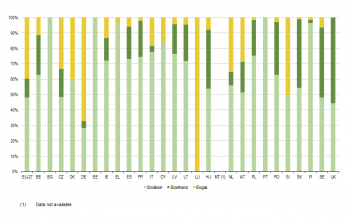
- 60 % of renewable energy from primary biomass sources in agriculture consists of biofuels (48 % or 8 457 ktoe from biodiesel energy crops and 12.2 % or 2140.8 ktoe from ethanol energy crops) and (39.8 % or 7 008.7 ktoe) of agricultural biogas.
- Directorate-General for Agriculture and Rural Development (DG AGRI) estimates show that, in 2011 an estimated 6.1 million ha of agricultural land in the EU-27, equivalent to 3.4 % of the total UAA, were directly devoted to the production of biomass and energy crops. The total estimated area devoted to the production of biomass and energy crops continues to increase in the EU-27. Because no reliable statistical data is available anymore from 2008 onwards only a rough estimation for Europe as a whole can be provided. Until 2007 information on the UAA devoted to the production of biomass and energy crops at EU Member States level was available due to specific support under the Common agricultural policy (CAP) .
Assessment
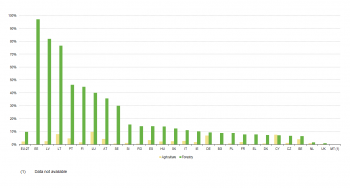
In 2010, the primary energy production of renewable energy from agriculture and forestry in the EU-27 represented 11.9 % of the total primary energy produced (Table 1 and Figure 1). While the production of renewable energy from the forestry sector accounts for 9.8 % of the total primary energy, the agricultural sector contributes only by 2.1 %. These shares differ considerably among Member States especially in the forestry sector. The absolute contribution of forestry to the total energy production is particularly high in Estonia (97 %), Latvia (81.9 %), Lithuania (76.5 %), Portugal (46.3 %), Finland (44.6 %), Luxembourg (40 %), Austria (35.7 %) and Sweden (30 %) whereas it is by far lower than the EU-27 average in United Kingdom (1 %) and Netherlands (1.5 %). On the other hand, the share of agriculture in the total production of primary energy is highest in Luxembourg (9.8 %), Lithuania (8 %), Cyprus (7.4 %) and Germany (6.8 %) whereas it is the lowest in the United Kingdom (0.2 %), Bulgaria (0.3 %), Estonia (0.3 %), Greece (0.3 %), Romania (0.4 %), and Poland (0.6 %).
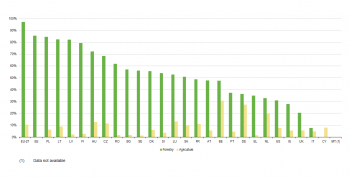
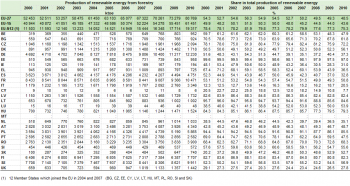
The production of renewable energy from agriculture in the EU-27 reached 17.6 million tonnes in 2010 and accounted for 10.6 % (data for Malta excluded) of the total renewable energy production (Table 2 and Figure 2) while the production of forestry accounted for 48.5 % of renewable energy, with 80.7 million tonnes (Table 3 and Figure 3).
In the agricultural sector in particular, the production of renewable energy is very unevenly distributed among countries, Germany (51 %) and France (13 %) produced 64 % of total renewable energy from the agricultural sector in EU-27 in 2010 (Figure 4). The share of the agricultural sector in the production of the total renewable energy is however highest in Belgium (30.8 %). It is lowest in Estonia (0.3 %) (Figure 1a). In the forestry sector, the differences among Member States in the production of renewable energy are less pronounced. Germany (15.1 %), France (13 %), Sweden (12.3 %), Finland (9.5 %) and Poland (7.3 %) contributed to 57 % of the total production of renewable energy from forestry in the EU-27 in 2010 (Figure 4). Furthermore, in 2010 the forestry sector contributed to 50 % or more of the total production of renewable energy in the majority of Member States, with the highest share in Estonia (97 %) and the lowest in Cyprus (7.7 %) (Figure 1a).
Although the production of renewable energy from forestry is by far more important in absolute term than agriculture, it has increased more rapidly in the agricultural sector than in the forestry sector. For the period 2004-2010, the production of renewable energy from agriculture in the EU-27 increased almost sevenfold (Figure 2) whilst the production from forestry increased by 54 % between 2000 and 2010 at an average annual growth rate of 4.4 % (Figure 3). The production of renewable energy from the forestry sector increased between 2000 and 2010 in all Member States, except in Greece, Cyprus and Portugal which experienced a slight decrease.
The contribution of agriculture to the total production of primary energy and to the total production of renewable energy increased by 1.8 percentage points between 2004 and 2010 (from 0.3 % to 2.1 %) and by 8.4 percentage points (from 2.2 % to 10.6 %) respectively (Table 2 and Figure 2). On the other hand, while the share of primary energy from forestry in the total primary energy increased by 4.2 percentage points between 2000 and 2010 (from 5.6 % to 9.8 %), the contribution of forestry to the total production of renewable energy decreased by 5.8 percentage points (from 54.3 % to 48.5 %) in the same period (Table 2 and Figure 2).
In the EU-27, 60 % of renewable energy from primary biomass sources in agriculture in 2010 consists of liquid bio fuels (48 % or 8 457 ktoe from biodiesel crops and 12.2 % or 2140.8 ktoe from ethanol crops) and 39.8 % of agricultural biogas (7008.7 ktoe) (Figure 5). Biogas is the only source of renewable energy from agriculture in Luxembourg and represents an important share of the total production of renewable energy in Germany (67.5 %), Slovenia (50.6 %), Denmark (40.5 %), Netherlands (35.5 %), Austria (28.9 %) and Czech Republic (33.6 %).
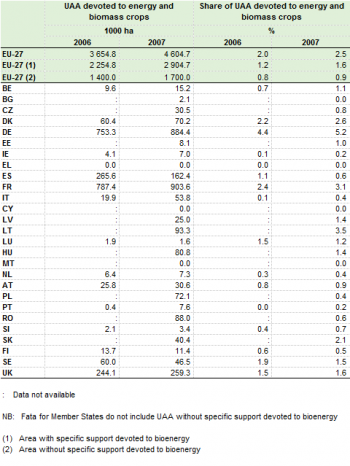
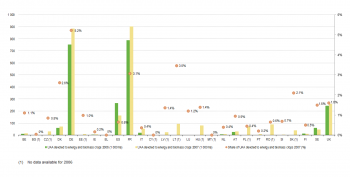
In 2007, an estimated 4.6 million ha of agricultural land in the EU-27, equivalent to 2.5 % of the total UAA, were directly devoted to the production of biomass and energy crops. A share of 63 % (2.9 million ha) of this area is represented by set-aside area devoted to the production of crops for non-food purposes (Set-aside area with non-food crops according to Regulation (EC) No 1251/1999) and by areas benefiting from the "Energy crop premium" for the production of renewable fuels and energy from biomass (Areas benefiting from the "Energy Crop Premium" according to Regulation (EC) No 1782/2003). 2007 was the first year in which the "Energy Crop Premium" was available to the 12 Member States which entered the EU in or after 2004. 2007 was also the last year when compulsory set-aside was applicable in the EU. Member States which entered the EU in or after 2004 (except Malta and Slovenia) never applied compulsory set-aside. The two regimes have been abolished by the Health Check reform of 2008. Moreover, 0.9 % of the total UAA devoted to renewable energy (1.7 million ha) was estimated to represent agricultural land used for the production of bioenergy, which was not covered by any specific support.
The total estimated area devoted to the production of biomass and energy crops was higher in 2007 (2.5 %) than in 2006 (2.0 %), with an increase of 26 % for the EU-27. In 2007, Member States with a higher-than-average share of land devoted to biomass and energy crops were Germany (5.2 %), Lithuania (3.5 %), France (3.1 %) and Denmark (2.6 %) (Table 4 and Figure 6). In absolute terms, Germany (884 000 ha) and France (904 000 ha) accounted for more than 60 % of the total area devoted to renewable energy under the two schemes in the EU-27. Between 2006 and 2007 the agricultural area under the two schemes increased in all Member States except in Spain (-39 %), Luxembourg (-17 %), Finland (-17 %) and Sweden (-23 %). Data at Member State level include only the agricultural area under the set-aside for non-food crops and the energy crop premium schemes.
Please note: Data currently available for the indicators related to the production of renewable energy in agriculture and forestry are subject to a number of limitations. Firstly they come from difference sources and therefore the degree of comparability is low. In addition the estimations of liquid biofuels and biogas production contain a considerable margin of error and do not permit to extrapolate the specific contribution of the agricultural sector to the production of renewable energy (e.g. data on biogas production contains not only biogas from agricultural sources but also biogas plants based on biowaste), since data from different sources are lumped together. In light of the above the results of the indicator have to be taken with caution.
Data sources and availability
Indicator definition
The indicator gives an indication of the importance of the agricultural and forestry sectors in the total production of energy.
Measurements
Main indicator:
- Share of primary energy production of renewable energy from agriculture and forestry to total energy production.
Supporting indicators:
- Share of primary energy production of renewable energy from agriculture and forestry to total renewable energy production.
- Production of renewable energy from agriculture, calculated by summing fuel bioethanol production, biodiesel production and biogas production.
- Production of renewable energy from forestry.
- Estimation of the agricultural area of energy crops (UAA devoted to the production of renewable energy).
Links with other indicators
The indicator "Production of renewable energy form agriculture and forestry" is linked to the following other indicators:
- AEI 05 - Mineral fertiliser consumption
- AEI 06 - Consumption of pesticides
- AEI 09 - Land use change
- AEI 10.1 - Cropping patterns
- AEI 12 - Intensification/Extensification
- AEI 19 - Greenhouse gas emissions
Data used and methodology
Main indicator:
The indicator is calculated as the share of primary energy from agriculture and forestry as of the total energy production. Data on the total energy production come from Eurostat energy statistics and cover all products (solid fuels, oil, gas, renewables). Given that data on the production of renewable energy from agriculture and forestry and those on the total energy production come from different sources (see Sub-indicators 2 and 3) the degree of comparability between the two variables is low and therefore the indicator has to be interpreted with caution.
Sub-indicator 1:
The indicator is calculated as the share of primary energy from agriculture and forestry as of total renewable energy production. Data on the total renewable energy production come from Eurostat energy statistics and cover primary production from renewables (RES) and wastes (hydro-power, geothermal energy, solar energy, tide/wave/ocean energy, wind energy, solid biomass, biogas, liquid biofuels and wastes. Given that data on the production of renewable energy from agriculture and forestry and those on the total renewable energy production (RES and wastes) come from different sources (see Sub-indicators 2 and 3) the degree of comparability between the two variables is low and therefore the indicator has to be interpreted with caution.
Sub-indicator 2:
The production of renewable energy from agriculture is calculated by summing fuel bioethanol production, biodiesel production and biogas production and cover in particular:
- Biodiesel from oilseeds crops;
- Ethanol from starch/sugar crops;
- Energy from agricultural biogas (livestock manure and energy crops, waste and residues).
It does not cover "other energy", like heat from cereal straw etc.
The indicator contains a considerable margin of errors: part of the EU biodiesel production is based on non-domestic sources (imported vegetable oils, oilseeds), therefore an ad-hoc quantification of domestic production is not possible. In addition, the category "energy from agricultural biogas", even though it predominantly covers agricultural biogas, also contains some biogas from municipal solid waste and biogas plants based on biowaste. Furthermore other sources not covered by the indicator (perennial grasses, short rotation forestry and short rotation coppice on agricultural land) will gain importance and should be included.
Data on bioethanol, biodiesel and biogas are available at MS level from:
- ePURE, the European Renewable Ethanol Association, who represents 80 % the European bioethanol fuel industry,
- The European Biodiesel Board (EBB), who represents European biodiesel fuel industry 75 % of all EU biodiesel.
- EurObservER, the "Observatoire des Energies Renouvelables", composed of engineers and experts who produce studies that are recognised on the national and European levels.
They deliver the yearly Eurobarometer reports combining data from EBB and ePURE and adding biogas from agricultural and non-agricultural sources. The production of renewable energy from agriculture is expressed in kilotonnes (1000 tons of oil equivalent - ktoe).
It should be noted that the conversion coefficients used to convert primary data in toe are the ones defined by the Directive 2009/28/EC on the promotion of the use of energy from renewable sources. They are: bioethanol 0.5016 toe per 1000 l and biodiesel 0.8837 toe per ton.
Sub-indicator 3:
Data on the production of renewable energy from forestry come from Eurostat energy statistics and cover the category wood, wood wastes and other solid wastes: purpose-grown energy crops (poplar, willow etc.), a multitude of woody materials generated by an industrial process (wood/paper industry in particular) or provided directly by forestry and agriculture (firewood, wood chips, bark, sawdust, shavings, chips, black liquor etc.) as well as wastes such as straw, rice husks, nut shells, poultry litter, crushed grape dregs etc. The production of renewable energy from agriculture is expressed in kilotonnes (1000 tons of oil equivalents - ktoe).
Sub-indicator 4:
Data on UAA used for renewable energy production by agriculture is not directly available. Until 2007 data were available on i) set-aside area with non-food crops (Council Regulation (EC) No 1251/1999) and ii) areas benefiting from the “Energy crop premium” (Council Regulation (EC) No 1782/2003). These two regimes have been abolished by the Health Check reform of 2008.
Based on DG AGRI's crop balances (oilseeds and cereals), an estimate of the area used for biomass production outside these two schemes (i.e. without any specific support), is provided for the EU-27. This estimate is conservative, as other crops for energy (and material use) are only partly covered (short rotation coppice, silage maize for biogas etc) due to lack of data.
2007 was the last year when compulsory set-aside was applicable in the EU. The Members States which joined the EU in 2004 or 2007 which opted for the Single Area Payment Scheme (all except Malta and Slovenia) never applied compulsory set-aside. 2007 was the first year in which the "Energy Crop Premium" was available in these Member States. The two regimes have been abolished by the Health Check reform of 2008. Therefore data for this indicator are only available until 2007.
The new calculation for estimating the area devoted to biomass and energy crops is based on the following data:
- Ethanol balances come from EU-27 ethyl alcohol balance Commission Regulation (EC) No 2336/2003.
- Biodiesel production comes from Eurostat Energy Statistics.
- Conversion factors: 3.9 hl ethanol from 1 tonne of cereals; 1.0 hl ethanol from 1 tonne of sugar beet; 0.95 tonnes of biodiesel from 1 tonne of rapeseed oil. Rapeseed contains 41.5 % of rapeseed oil and 54.5 % of rapeseed meal. 34 % of cereals are converted to distillers dried grains (DDGS) in the production of ethanol.
- Yields are taken from the DG AGRI balance sheets.
- Additional biomass area: Data for Germany from FNR (Fachargentur für nachwachsende Rohstoffe).
The methodology used for the calculation of those estimates is the following: for the production of ethanol DG AGRI publishes annual balances including the amount produced by different feed stocks. The figures are used to derive an area estimate by converting back to area with average yields and conversion factors. In the case of biodiesel, total production figures are taken from energy statistics and the conversion is made in a similar way, but with the assumption that all vegetable oil based biodiesel is produced from rapeseed oil. In both cases a gross area of energy crops is obtained. Therefore, an area is deduced for the production of by-products (oilmeals and distiller dried grains (DDG)) which are used in animal feed. In case of biogas only estimates for the area in selected Member States are available and are added to the overall gross area of biomass and energy crops. This methodology only derives a rough estimate and does not present statistics but it provides an indication of the overall share of biomass and energy crops in the UAA. The results for 2006 and 2007 derived from data directly reported by Member States are close to the more precise calculation described above.
Please note:
- Data on renewable energy production from agriculture and forestry include only bio-energy from primary sources. Renewable energy production from agriculture and forestry from other sources such as wind and solar, bio-energy from by-products and residues such as straw or pruning's and energy from agri-processing residues are not taken into account due to lack of data.
- For bio-ethanol, not all MS are covered. Data is provided only "to the best of knowledge".
- For biogas, the contribution of agriculture fall under the "Other" category and is thus mixed with municipal solid waste and industrial waste plant. However, the importance of small-scale agricultural methanisation in this category has been rising over the years.
- The wood and wood waste indicator for forestry sector overlap partly with agriculture, e.g; straw, short rotation coppice (SRC), which can lead to an overestimation.
- A new calculation method has been used to provide a rough estimate at EU level of the UAA devoted to the production of renewable energy. It should be noted that such an estimate does not reflect real figures but provides information of the importance of energy crops in land use.
- The indicator contains a considerable margin of errors: a) biodiesel is partly produced from imported vegetable oils and oilseeds, b) data on biogas contains not only biogas from agricultural sources but also biogas plants based on bio waste and c) other sources not covered by the indicator (perennial grasses, short rotation forestry and short rotation coppice on agricultural land) will gain importance in the future. Data from different sources are lumped together and in light of the above the results of the indicator have to be taken with caution.
Context
EU agriculture and forestry play an increasing role in supplying renewable energy. Currently the indicator only covers energy from biomass, also known as biofuels. Biofuels are expected to play an important role in achieving the EU targets. It helps also other sectors (such as transport) to reduce its dependence on fossil resources and to reduce green-house gas emissions.
Policy relevance and context
The production of renewable energy is currently one of the main EU priorities. The Directive on the promotion of the use of energy from renewable sources (2009/28/EC) sets a 20 % share of energy from renewable sources and a 10 % share of renewable energy specifically in the transport sector as targets for the EU, to be achieved by 2020. This will significantly affect the use of agricultural and forest land, the balance sheet of the main primary sector commodities as well as the importance of agriculture and forestry in the production of renewable energy. From the National Renewable Energy Action plans, the supply of biomass from forestry and agricultural (and fisheries) sectors by 2020 is summarised in Table 5.
From the above aggregate table, it can be seen that while in absolute value forestry biomass remains the dominating resource, in relative terms its growth is modest (19.4 %) compared to that from agricultural resources (159 %). In total, by 2020, 115.8 million tons of oil equivalent (Mtoe) biomass will be supplied from agriculture and forestry together. This represents 87 % of the total supply of 132.7 Mtoe. The Renewable Energy Directive (Directive 2009/28/EC) (RED) of the European Parliament and of the Council on the promotion of the use of energy from renewable sources, establishes the goal of reaching a minimum share of 10 % in every Member State in 2020 from renewable energy. Regarding the expand of biofuels use in the EU, the Directive aims to ensure the use of sustainable biofuels only which generate a clear and net greenhouse gas saving without negative impact on biodiversity and land use. In its articles 17, 18 and 19 the RED includes a set of mandatory sustainability criteria as part of an EU sustainability scheme and also monitoring and reporting requirements for biofuels and bioliquids. These criteria are related to greenhouse gas savings, land with high biodiversity value, land with high carbon stock and agro-environmental practices. The Fuel Quality Directive (Directive 2009/30/EC) also regulates the sustainability of biofuels using the same criteria as the RED. The Fuel Quality Directive applies to all petrol, diesel and biofuels used in road transport, as well as to gasoil used in non-road-mobile machinery. In the context of the RED biofuels are required to fulfil all sustainability criteria to count towards EU targets and to be eligible for financial support. The EU Member States are responsible for checking compliance with the sustainability criteria, but the European Commission can recognise voluntary sustainability certification schemes. Since 19 July 2011, the European Commission has recognized voluntary schemes that apply directly in 27 EU Member States. By the end of 2012, 13 voluntary schemes have been approved.
The RED excludes several land categories, which recognised high biodiversity value, from being used for biofuel production: (a) primary forests and other wooded land; (b) areas designated for nature protection or for the protection of rare, threatened or endangered ecosystems or species; (c) highly biodiverse grassland, either natural or non-natural. Biofuels should not be made from material from peatland and land with high carbon stock, such as: (a) wetlands; (b) continuously forested areas; (c) land covered by trees higher than 5 m and a canopy cover between 10 % and 30 %. For the biomass feedstock produced in the EU, the cross-compliance rules of the Common agricultural policy (CAP) apply, in accordance with the requirements for good agricultural and environmental conditions. The EU cross compliance regulations refer to preservation of soil and water quality, of biological diversity, careful use of fertilisers and pesticides and air pollution.
In the European Union, biofuels should meet a minimum requirement for greenhouse gas savings of 35 % relative to fossil fuels, to increase to 50 % in 2017 and 60 % in 2018 for new biofuel plants. Advanced, second-generation biofuels produced from residues, non-food cellulosic material and lignocellulosic material would be double credited towards the 10 % target. The EU sustainability scheme includes monitoring and reporting requirements. The EU Member States shall report on the impact of the biofuels and bioliquids on biodiversity, water resources, water quality and soil quality; the net greenhouse gas emission reduction and changes in commodity prices and land use associated with increased use of biomass. The fuel suppliers are required to report on the compliance with the sustainability criteria and on the measures taken for soil, water and air protection, the restoration of degraded land and the avoidance of excessive water consumption in areas with water deficit. Although there are no criteria for social sustainability included, the European Commission must report on the biofuels impact on social aspects and on the impact on the availability of food at affordable prices. The European Commission will monitor the origin of biofuels consumed in the EU and impacts of their production in the EU and third countries, land use and land use change, commodity prices and food security [2].
Agri-environmental context
There are important benefits and costs associated to biofuel production from agriculture depending on the feedstock used and the conversion technology. Benefits include:
- Reduction of greenhouse gas emissions relative to burning fossil fuels. The savings are depending on the feedstock used and the conversion technology. High greenhouse gas savings are recorded from biogas derived from manure and ethanol derived from agricultural and forest residues, as well as for biodiesel from wood. However according to UNEP Year Book 2009 negative greenhouse gas savings, i.e. increased emissions, may result in particular when production takes place on converted natural land and the associated mobilisation of carbon stocks is accounted for.
-Development of local energy production to reduce dependency on foreign energy imports.
- Providing new and diverse sources of income for farmers and agri-businesses in rural Europe. In addition, in cases where by-products such as straw or animal manure are used, conversion to energy may provide new options to generate revenue from agricultural by-products.
Biofuel production however can also have negative impacts:
- It can lead to a potential increase in intensive agriculture and land used for crop production, which may negatively impact on biodiversity and landscapes, or release additional carbon dioxide from soils when long-term fallow land is used for crop production.
- In addition, by-products and residues from agriculture often have important functions for soil organic matter and thus soil fertility and sustainable production.
Biomass crops grown for transport fuels are likely to be the most widespread use of agricultural biomass over the next 10 years, as a direct result of EU policy. Stimulating the market for transport biofuels could slow the transition to using biomass in other sectors, particularly the electricity sector, because there is only a finite amount of agricultural land available. When developing measures to stimulate the transport biofuels market, countries will have to consider the overall climate and environmental balance of the various types of biofuels, and give priority to those that show a cost-effective environmental balance. The overall goal is to expand the use of biofuels in a considered way, based on clear evidence of their environmental benefits, while taking into account competitiveness and security of supply. Recent proposals (2013) for amending the policy have put a 5 % cap on biofuels from food crops in order avoid undesired climate effects and to avoid competition between food and fuel.
Due to a lack of data, the indicator excludes solar and wind energy produced on farms, bioenergy from by-products and residues such as straw or prunings and energy from agri-processing residues. All these forms of renewable energy from agriculture may gain importance in the future. For example, a recent study on the impacts of renewable energy on European farmers shows that under different scenario assumptions the lion share of renewable electricity produced on farms by 2020 will be derived from wind energy installed on agricultural land.
See also
- Agri-environmental indicators (online publication)
- Renewable energy statistics
Further Eurostat information
Publications
- Agriculture, forestry and fishery statistics — 2016 edition (Statistical book)
- Environmental statistics and accounts in Europe- 2010 edition
- Farm data needed for agri-environmental reporting
- Renewable energy - Statistics in Focus 44/2012
Database
Dedicated section
Source data for tables, figures and maps (MS Excel)
Other information
- Commission Communication COM(2006)508 final - Development of agri-environmental indicators for monitoring the integration of environmental concerns into the common agricultural policy
- Agri-Environmental Indicators, see:
- Corresponding IRENA Fact sheet 27
External links
- Publications:
- European Commission - DG Energy
- EurObservER
- Database:
- ePURE, European Renewable Ethanol Association
- EurObservER, Observatoire des Energies Renouvelables
- European Biodiesel Board (EBB)
- Other external links:
- European Commission
- DG Agriculture and Rural Development
- DG Energy
Notes
- ↑ Please note that the 20 % target of energy from renewables (for more details see: here) is expressed in terms of final energy consumption. This has to be interpreted with caution for not causing confusion with this indicator which is a proxy to production.
- ↑ Nicolae Scarlat, Jean-François Dallemand, Recent developments of biofuels/bioenergy sustainability certification: A global overview, Energy Policy, Volume 39, Issue 3, March 2011, Pages 1630-1646, ISSN 0301-4215, 10.1016/j.enpol.2010.12.039.
