Archive:Agri-environmental indicator - farmers’ training and environmental farm advisory services
This Statistics Explained article is outdated and has been archived. For more recent articles on agriculture statistics see here.
- Data from January 2013. Most recent data: Further Eurostat information, Main tables and Database. Planned update: February 2018.
This article provides a fact sheet of the European Union (EU) agri-environmental indicator (AEI) farmer trainings level and use of environmental advisory services. It consists of an overview of recent data, complemented by all information on definitions, measurement methods and context needed to interpret them correctly. The farmer trainings level and use of environmental advisory services article is part of a set of similar fact sheets providing a complete picture of the state of the agri-environmental indicators in the EU.
The indicator gives indications of farmers' training levels by means of information on the number of participants from the farming, food and forestry sectors in environmental training actions supported by rural development policy and farmers' use of environmental advisory services by means of information on the number of farmers' applications for the use of environmental advisory services supported within the rural development policy. It is measured by the following indicators:
Main indicators:
- Number of participants from the farming, food industry and forestry sectors in vocational trainings and information actions devoted to the environment and its share out of the total participants in vocational trainings supported by rural development policy;
- Number of farmers' applications for the use of environmental farm advisory services and its share out of the total number of farmers' advisory service applications supported by rural development policy.
Supporting indicators:
- Number of economic actors supported by rural development policy for training and information actions addressing the maintenance of landscape and the protection of environment and its share out of the total number of economic actors supported for training and information related to activities covered by Axis 3 of the rural development policy;
- EU expenditures on training, information actions and use of advisory services devoted to the environment and supported within measures of the Rural Development Programmes (RDP);
- EU expenditures per participant from the farming, food industry and forestry sectors to trainings devoted to the environment and supported within measures of the Rural Development Programmes;
- Share (number) of farm managers having practical experience, basic training, and full agricultural training;
- Share of utilised agricultural area (UAA) (ha) managed by farm managers having practical experience, basic training, and full agricultural training.
Main statistical findings
Key messages
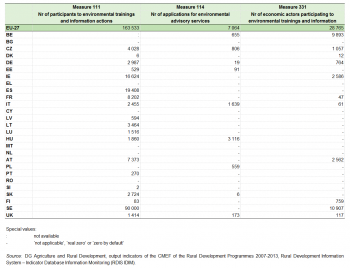
- In 2010 the total number of participants active in farming, food industry and forestry in vocational training and information actions specifically devoted to the maintenance of landscape and the protection of the environment, amounted to nearly 164 000 in EU-27 and represented 16 % of the total participants in vocational training and information actions supported under the rural development measure 111 (Vocational training and information actions). In Ireland, Luxembourg, France, Sweden, Slovakia and Latvia this share is even higher (Figure 1).
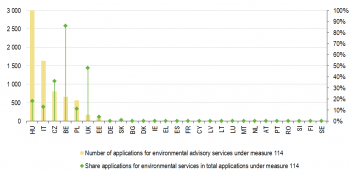
- The total number of applications of farmers to use advisory services on how to apply production processes compatible with the enhancement of landscape or the wider protection of the environment was 7 064 in 2010. At EU-27 level, 8.5 % of the advisory services supported by rural development policy are specifically devoted to the environment. In Belgium, the United Kingdom, the Czech Republic, Hungary, Italy and Poland this share is even higher, particularly in Belgium and the United Kingdom where it is 86 % and 48 % respectively) (Figure 2).
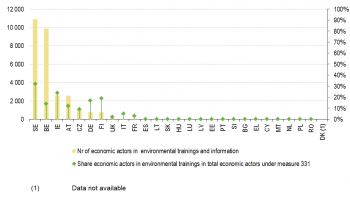
- The number of rural area economic actors supported to follow training or information actions in the fields of maintenance and enhancement of landscape and protection of the environment was almost 29 000 in the EU-27 (2010). At EU-27 level, training and information actions in the fields of landscape and environment represent, in term of number of economic actors, 17 % of the total training and information actions supported through this measure. This share is even higher in Sweden, Ireland, Germany and Finland with values between 19 and 32 % (Figure 3).
- The great diversity of implementation among Rural Development Programmes shows that the shared management of rural development measures enables their adaptation to the very diverse agricultural conditions across the EU and the targeting of the main issues of concern.
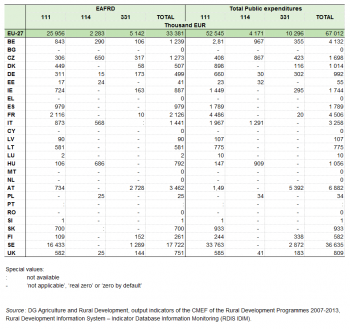
- The total public spending for all the above mentioned type of training, information and advisory services addressing the environment and the landscape was EUR 67 million in 2010 (EUR 26 million from the European Agricultural Fund for Rural Development - EAFRD). Sweden contributed for more than half (54 % or EUR 26 million) of the total public spending in the EU-27. On the other hand in 6 Member States none of those actions for environmental purposes have been implemented so far (Figure 4).
- The main indicators and some of the sub-indicators based on information and data coming from the monitoring system of the rural development measures only take into account actions supported under this scheme. Other typology of training, information actions and advisory services for farmers organized at national, regional or local level are not always included. For that reason these main and subindicators give only partial information about the training level and the use of environmental advisory services in the farming sector. Moreover the background data to the indicators based on RDP data refer not only to farmers but include also participants and economic actors (depending on the indicators) from different sectors and thus the results have to be taken with caution. Double counting may also be present in the total numbers of participants, applications and economic actors supported by measures 111, 114 and 331 (see for more information the section Data used and methodology).
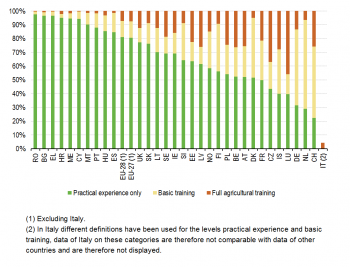
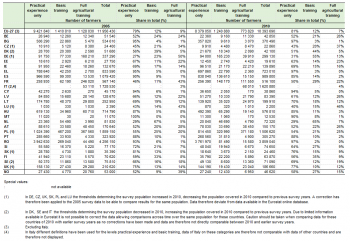
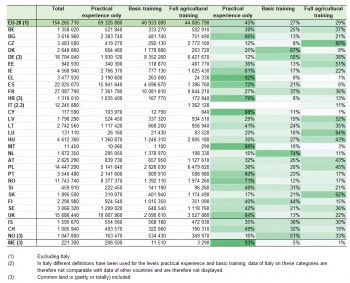
- In 2010 81 % of the farm managers in EU-27 (excluding Italy) had only practical experience while this was 80 % in 2005, 12 % of the farm managers had in 2010 as highest training level basic training (11 % in 2005) and only 7 % of the farm managers had full agricultural training in 2010 (9 % in 2005). In the Netherlands, Germany and Switzerland more than half of the farm managers had as highest training level basic training. Luxemburg has the highest share of farm managers with full agricultural training (46 %) followed by the Czech Republic (37 %). In Belgium. Latvia, Austria and Switzerland more than a quarter of the farm managers had full agricultural training (Figure 5 and Table 1).
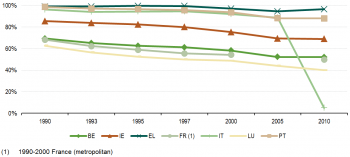
- In 2010 in most countries more than half of the farm managers had only practical experience. The shares of farm managers with only practical experience in 2010 were highest (97 %) in Romania, Bulgaria and Greece. The most significant changes in the share of farm managers having only practical experience between 2005 and 2010 (measured in percentage points) took place in Malta (where the share decreased from 100 % to 90 %), Slovenia (from 72 % to 64 %) and Norway (from 52 % to 58 %) (Figure 6). For some Belgium, France, Greece, Portugal and Ireland data are available over a longer period. Data show that between 1990 and 2010 the share of farm managers with only practical experience gradually decreased in these countries (Figure 7).
- Though in 2010 in EU-28 (excluding Italy) 81 % of the farm managers had only practical experience, the area these farmers managed was only 45 % of the utilised agricultural area (UAA) (excluding common land), while 12 % of the farm managers had basic training as highest training level they managed 27 % of the UAA (excluding common land) and though only 7 % of the farm managers had full agricultural training these managers managed 29 % of the UAA excluding common land. In the Czech Republic the share of the UAA (excluding common land) managed by farm managers with full agricultural training is the highest with 80 %, in Luxembourg and Slovakia this share is with 60 % also relatively high. In Montenegro and Greece more than 90 % of the UAA (excluding common land) is managed by farm managers with only practical experience, also in Croatia, Cyprus and Malta a relative large share is managed by farm managers with only practical experience. In the Netherlands and Denmark more than three-thirds of the area is managed by farm managers with as highest training basic training (Table 2).
Assessment
Data from Rural Development Programme
The 2010 data for the three indicators includes all new projects launched in 2007, 2008, 2009 and 2010 under Council Regulation 1698/2005. In 2010 7 Member States (Romania, Poland, the Netherlands, Malta, Greece, Cyprus and Bulgaria) have not used measure 111 to support trainings specifically addressing environmental issues. Figure 1 shows that the Member States which have the highest number of participants to environmental training are Sweden, Ireland, Spain, France and Austria, data were not available for Denmark and Belgium. Sweden represents more than 50 % of the total participants to environmental trainings and information actions under measure 111 in EU-27. Only 9 Member States (Belgium, the Czech Republic, Estonia, Germany, Hungary, Italy, Poland, Slovakia and the United Kingdom) reported the use of environmental advisory services (under measure 114) in 2010. The highest numbers of application for environmental advisory services are registered in Hungary, Italy and the Czech Republic (Figure 2) accounting all together for 79 % of the total number of applications for environmental advisory services under measure 114 in EU-27. Only 11 Member States (Belgium, Sweden, Ireland, Austria, Italy, the Czech Republic, Denmark, Germany, the United Kingdom, France and Finland) have reported information on economic actors supported by rural development to follow training or information actions in the fields of maintenance and enhancement of landscape and protection of the environment (under measure 331) . Among them, Sweden, Belgium, Austria and Ireland have been particularly active and accounts all together for 90 % of the total number of economic actors participating in environmental trainings and information in EU-27, data were not available for Denmark (Figure 3 and Table 3).
In 2010 the measure 111 is the most important with total public expenditures of EUR 53 000 000 (EUR 26 000 000 from the EAFRD) followed by the measure 331 with EUR 10 000 000 (EUR 5 000 000 EAFRD) and finally the measure 114 with EUR 4 000 000 (EUR 2 000 000 from the EAFRD). At EU-27 level, the average public expenditure per participant for training devoted to environment under measure 111 was EUR 321. The average public expenditure per application for environmental advisory services under measure 114 was EUR 590 and the average public expenditure per economic actor for actions devoted to the environment under measure 331 was EUR 358. There are however significant differences among Member States: for training devoted to the environment supported under the measure 111 for example, the average expenditure per participant varies from less than EUR 50 in Luxembourg and Estonia to more than EUR 2 500 in Finland (Figure 8 and Table 4).
Data from Farm structure survey
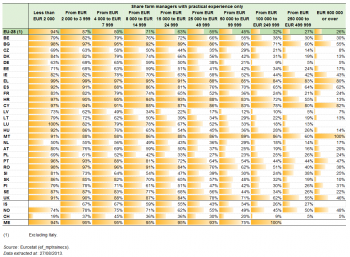
Figure 9 shows that the share of farm managers having only practical experience decreases when farm size increases: where 88 % of the farm managers of small holdings (standard output (SO) EUR 1 - EUR 14 999) in EU-28 (excluding Italy) in 2010 had only practical experience, this share was 26 % for large holdings (standard output EUR 250 000). Full agricultural training on the other hand increases with the size of the farm: the share of farm managers with highest training level full agricultural training was only 4 % on small farms and 34 % on large farms. Trends at country level show for most countries that the share of farm managers with only practical experience increases from younger generations to older generations while the share of farm managers with as highest training level full agricultural training decreases, similar to the trend noted at EU-28 level (Table 5).
Figure 10 shows that the share of farm managers with highest level full training decreases from younger generations to older generations of farm managers across Europe, promising a higher share of higher educated farm managers in the near future. The share of farm managers in EU-28 (excluding Italy) with only practical experience is between 72 % and 75 % for the generations under 35 years, 35 - 44 years old and 45 - 54 years old, while this share is 80 % for the generation 55 - 64 years old and 94 % for the generation 65 years old. The share of farm managers with basic training as highest level is highest for the generation 45 - 54 years old with 17 % and lowest for the generation 65 years old with 5 %. At country level in most countries the share of farm managers with full agricultural training decreases with increasing age classes of the farm manager (Table 6).
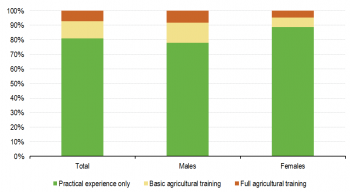
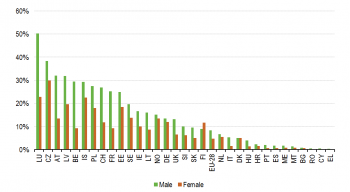
Figure 11 shows that a slightly higher percentage of male farm managers (8 %) have full agricultural training as highest training level than female farm managers (5 %), also the share of farm managers with only practical experience is higher under female farm managers (89 %) than male farm managers in 2010 (78 %) in EU-28 (excluding Italy). Table 7 shows the shares of male and female farm managers by training level. In many countries the same trend can be noted as at EU-28 level: the share of female farm managers with full agricultural training in total female farm managers is lower than the share of male farm managers with full agricultural training in total male farm managers. In Luxembourg, Belgium, France, Austria and Switzerland the difference between the share of female farm managers with full agricultural training and male farm managers with full training is the largest with a difference of more than 15 percentage points (Figure 12).
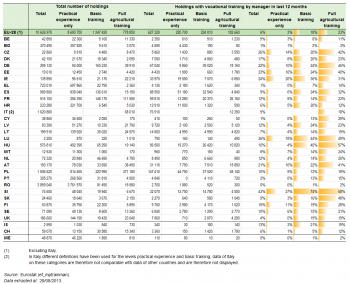
In EU-28 in 2010 6 % of the farm managers had vocational training in the last 12 months. This share varies across countries, while in Romania and Montenegro practically none of the farm managers had vocational training in the last 12 months, this percentage was 43 % in Slovenia (Figure 13). Table 8 shows that while only 3 % of the farm managers with only practical experience in EU-28 (excluding Italy) in 2010 had vocational training in the last 12 months, this share was 18 % among farm managers with basic training and 23 % among farm managers with full agricultural training. This trend that a relative high share of farm managers with full agricultural training or basic training had vocational training in the last 12 months is also noted at country level.
Reasons for differentiated uptake
The results above show that the compulsory nature of agri-environment measures has helped to ensure a wide application of the mentioned 3 measures throughout the EU farmland despite considerable differences in uptake between Member States and regions. The uneven implementation of environmental training and advisory services throughout the EU may be explained by contextual and institutional reasons which may have a great influence on the different level of rural development support. First of all the agricultural context and country specific needs (e.g. age and educational levels of farmers, intensity of agriculture, productivity and land values) differs between Member States. Secondly the need for improving environmental skills of farmers and other operators can be met by specific national/regional scheme outside the EU rural development framework.
Data sources and availability
Indicator definition
The indicator gives indications of farmer's training levels by means of information on the number of participants from the farming, food and forestry sectors in environmental training actions supported by rural development policy and farmers' use of environmental advisory services by means of information on the number of farmers' applications for the use of environmental advisory services supported within the rural development policy.
Measurements
Main indicators:
- Number of participants from the farming, food industry and forestry sectors in vocational trainings and information actions devoted to the environment and its share out of the total participants in vocational trainings supported by rural development policy;
- Number of farmers' applications for the use of environmental farm advisory services and its share out of the total number of farmers' advisory service applications supported by rural development policy.
Supporting indicators:
- Number of economic actors supported by rural development policy for training and information actions addressing the maintenance of landscape and the protection of environment and its share out of the total number of economic actors supported for training and information related to activities covered by Axis 3 of the rural development policy;
- EU expenditures on training, information actions and use of advisory services devoted to the environment and supported within measures of the Rural Development Programmes;
- EU expenditures per participant from the farming, food industry and forestry sectors to trainings devoted to the environment and supported within measures of the Rural Development Programmes;
- Share (number) of farm managers having practical experience, basic training, and full agricultural training;
- Share of UAA (ha) managed by farm managers having practical experience, basic training, and full agricultural training.
Links with other indicators
- AEI 01 – Agri-environmental commitments
- AEI 04 – Area under organic farming (see Organic farming statistics)
- AEI 05 – Mineral fertiliser consumption
- AEI 06 – Consumption of pesticides
- AEI 07 – Irrigation
- AEI 10.1 – Cropping patterns
- AEI 10.2 – Livestock patterns
- AEI 11.1 – Soil cover
- AEI 11.2 – Tillage practices
- AEI 11.3 – Manure storage
- AEI 23 – High nature value farmland
Data used and methodology
Rural Development Programme
The main indicators and some of the supporting indicators are built on the basis of administrative data reported by Member States in compliance with the reporting requirements of the Rural Development Programmes' monitoring system. Data for the programming period 2007-2013 are derived from the annual information reported to compile the Common Monitoring and Evaluation Framework (CMEF) output indicators linked to the measures 111 Vocational training and information actions, including diffusion of scientific knowledge and innovative practices for persons engaged in the agricultural, food and forestry sectors, 114 Use of advisory services by farmers and forest holders (Article 20, 21 and 24 of Regulation 1689/2005) and 331 Training and information for economic actors operating in the fields covered by Axis 3 (Article 52 of Regulation 1689/2005).
The output indicators of the CMEF measure activities directly realised within the Rural Development Programmes. These activities are the first step towards realising the operational objectives of the intervention and are measured in physical or monetary terms. Monitoring data are reported by Member States to DG Agriculture and Rural Development annually within the Annual Progress Report which is compiled for each programme. Data are reported and processed by means of the Rural Development Information System - Indicator Database Information Monitoring (RDIS IDIM).
- Main indicator Number of participants from the farming, food industry and forestry sectors in vocational trainings and information actions devoted to the environment and its share out of the total participants in vocational trainings supported by rural development policy:
Data come from the monitoring information of the output indicator Number of participants to training linked to the measure 111. For each Rural Development Programme, the information reported includes the "number of participants (unit of measure: unique number of persons) active in farming, food industry or forestry that participated in an (European Agricultural Fund for Rural Development) supported training activity (not being part of normal programmes or systems of agricultural and forestry education)". The number of participants is reported according to the content/type of the activity including the maintenance and enhancement of landscape and protection of the environment. The indicator gives only partial information on the training level in the farming sector: it covers only environmental trainings supported under the rural development policy and refers not only to farmers but includes also participants from the food industry and the forestry sector.
The indicator is also expressed as the share of the number of participants in environmental vocational trainings and information actions on the total number of participants in vocational trainings and information actions supported under the measure (including training and information actions on management, administrative and marketing skills, ICT trainings, product quality, etc.)
- Main indicator Number of farmers' applications for the use of environmental farm advisory services and its share out of the total number of farmers' advisory service applications supported by rural development policy:
Data come from the monitoring information of the output indicator Number of farmers supported linked to the measure 114. For each Rural Development Programme, the information reported includes the "number of farmers (unit of measure: unique number of farmers) who use advisory services for the improvement of the overall performance of their holding". The number of farmers which use environmental advisory services is not available. Only the number of application divided according to the type of advisory services given, including environment and agri-environment, is reported. The indicator is also expressed as the share of number of farmers' applications for the use of environmental advisory services on the total number of farmers advisory service applications supported under the measure (including advice for occupational safety standards, animal welfare, economic performance, etc.)
Given that one farmer can apply for more than one typology of advisory services there might be the possibility of double counting in the total number of applications for the use of any type of advisory services.
- Sub-indicator Number of economic actors supported by rural development policy for training and information actions addressing the maintenance of landscape and the protection of environment and its share out of the total number of economic actors supported for training and information related to activities covered by Axis 3 of the rural development policy:
Data come from the monitoring information of the output indicator Number of economic of participating economic actors to supported training activities linked to the measure 331. For each Rural Development Programme, the information reported includes the "number of economic actors (unit of measure: unique number of persons) that participated in an (EAFRD supported) training activity (not forming part of targeted programmes or systems related to rural development)". The number of economic actors is reported according to the content/type of the activity including the maintenance and enhancement of landscape and protection of the environment. The indicator gives only a partial information on the training level in the farming sector: it covers only environmental trainings supported under the rural development policy and refers not only to farmers but include also other economic actors such as micro-enterprises, individual farmers, other non farmers self-employed persons, non-profit organisations, etc. and therefore the information shown have to be interpreted with caution. The indicator is also expressed as the share of the number of economic actors who applied for environmental trainings on the total number of economic actors that participated to all type of trainings supported under the measure (including training and information actions on management, administrative and marketing skills, ICT trainings, etc.)
- Sub-indicator EU expenditures on training, information actions and use of advisory services devoted to the environment and supported within measures of the Rural Development Programmes:
The sub-indicator is calculated as the sum of total public funding (including funds from the European Agricultural Fund for Rural Development – EAFRD) spent under the measures, 111, 114 and 331 for trainings, information actions and advisory services addressing environment. Data come from the financial information reported under the output indicators mentioned above.
- Sub-indicator EU expenditures per participant from the farming, food industry and forestry sectors to trainings devoted to the environment and supported within measures of the Rural Development Programmes:
The sub-indicator is the average public expenditure per participant to trainings devoted to the environment and supported within the measure 111, the average public expenditure per application for the use of environmental farm advisory services under measure 114 and the average public expenditure per economic actor supported for training and information actions addressing the maintenance of landscape and the protection of environment under measure 331.
All the above mentioned indicators are based on data referred to 2010 and therefore include all new projects launched in 2007, 2008, 2009 for the programming period 2007-2013 according to Council Regulation (EC) 1698/2005.
Farm structure survey
Data on the highest training level (only practical experience, basic training, full training) obtained by farm managers of non-group agricultural holdings and vocational training by the farm manager in the last 12 months are collected through the Farm structure surveys (FSS) across the EU on a regular basis and with representativeness at regional levels (down to NUTS 3 level) providing comparable statistics across countries and time.
Definitions
Vocational training is a training measure or activity, provided by a trainer or a training institution which has as its primary objective the acquisition of new competencies related to the farm activities or activities related directly to the holding or the development and improvement of existing ones. Vocational courses are typically clearly separated from the active work place (learning takes place in locations specially assigned for learning, a class room or training centre). They exhibit a high degree of organisation (time, space and content) by a trainer or a training institution. The content is designed for a group of learners (e.g. a curriculum exists) (for more details see the article on the Vocational education and training statistics).
In Italy data on training level of farm managers were derived from administrative sources. A different definition was applied then the definition as described in Regulation 1200/2009 . In Table 9 the difference in definitions is presented, it shows that Italy applied a different definition for the categories practical experience only and basic training, data for these two categories are therefore not comparable to data of other countries and have therefore not been presented in this fact sheet. The definition of full agricultural training is in line with the definition in Regulation 1200/2009, data for this category is therefore comparable to data of other countries. Data on EU-aggregates have been presented excluding Italy. In Italy, practical experience refers to cases where the farmers has completed no type of education (primary school, secondary education, higher education) and basic training refers to all farmers that have completed a level of education but not directly related to agriculture.
The interpretation of the different levels may be different between different countries, limiting the comparability of data across countries.
Thresholds
It should however be noted that the thresholds used to determine the population covered by the survey changed in 2010 for some countries (see for more information the background article Farm structure survey – survey coverage). In Germany, the Czech Republic, United Kingdom, Slovakia, Poland and Luxembourg the threshold was higher in 2010 compared to previous editions, decreasing the population covered. In Denmark, Spain, Sweden, Norway, Italy and Croatia the thresholds lowered in 2010 compared to previous editions, increasing the population covered. These changes mainly affected the comparability across time of characteristics related to the holding, such as number of holdings, legal type of holding, characteristics related to the holder and manager, labour force and other gainful activities. The effect on the area covered, the number of livestock and the standard output is marginal. This means however that the first mentioned characteristics or indicators based on these characteristics cannot be directly interpreted from data published in the Eurobase online database, as the impact of the change in thresholds on the population covered by the survey significantly affects the results for these characteristics and indicators. To interpret trends for these indicators, a correction needs to be made to allow analysis on a similar population across time. To be able to compare results from the 2010 survey with results of the surveys in previous years, the results in previous years for Germany, Poland, the Czech Republic, United Kingdom, Slovakia and Luxembourg have been re-estimated with the thresholds as used in the 2010 survey for these countries. Due to limited information available in Eurostat corrections could not be made to 2010 data to allow comparisons with data of previous years for Denmark, Sweden and Italy; data of 2010 for these countries are not directly comparable with data from previous survey years, and trends noted should be interpreted with caution. The impact of the change in thresholds in Norway and Spain is considered negligible.
Common land
Common land is part of the utilised agricultural area (UAA) in several countries. The ownership and management of common land is very different from the ownership and management of other areas of UAA. In general terms, common land is utilised agricultural area (UAA) owned by a public authority or entity (state, parish, farmers' association etc.) over which another person is entitled to exercise rights of common, and these rights are generally exercisable in common with others. Common land can however be organised in other ways as well. To distinguish the area of UAA managed by farm managers in a more traditional sense, common land has been excluded from the analysis of the share of UAA managed by farm managers with different training levels in this fact sheet for as far as possible:
- For Cyprus, United Kingdom, Romania, Portugal, Greece, Austria, Bulgaria, Hungary, Ireland and Slovenia the area of common land has been excluded.
- For Croatia, Norway, Montenegro and Germany it was not possible to exclude common land from the UAA. The impact on the results is however considered negligible as common land in these countries is considered negligible.
- For Italy and Spain most (but not all) of the common land has been excluded. Some of the common land is allotted to individual holdings and this area cannot be distinguished.
Due to these corrections the data presented in this article may deviate from data available in the online database. In this article comparisons with data from other survey years have not been made. Comparisons across time excluding common land is not possible for Austria, Portugal, Romania, Cyprus and Spain, as only in 2010 the area on common land was flagged in the data recording. Comparisons across time for these countries are possible for UAA including common land. For more information on common land, see the background article Farm structure survey – common land.
Context
Introduction
Trainings, information actions and advisory services for farmers and other actors operating in rural areas are important tools foreseen in the EU Rural Development Policy Framework for the period 2007-2013 to meet the overall objectives of the policy. The evolution and specialisation of agriculture require in fact an appropriate level of technical and economic training, including expertise in new information technologies, adequate awareness in the fields of product quality, results of research and sustainable management of natural resources, including cross-compliance requirements and the application of production practices compatible with the maintenance and enhancement of the landscape and the protection of the environment. The use by farmers of advisory services would also allow and help them to improve the sustainable management of their holdings and to adapt, improve and facilitate the overall performance of the holdings by enhancing the human potential of the agricultural and forestry sector.
Policy relevance and context
In the current rural development programming period (2007-2013), training, information and advisory services measures are proposed by Member States or regions and submitted to the Commission for approval under Council Regulation 1698/2005, as part of their Rural Development Programmes (RDPs): measure 111 "vocational training and information actions", measure 114 "use of advisory services by farmers and forest holders" and measure 331 "training and information for economic actors operating in the field of Axis 3". In most cases, these measures may be used to address a broad range of scopes and objectives (i.e. improving the competitiveness of the agricultural and forestry sector, quality of life in rural areas and diversification of the rural economy) including land management and environmental objectives. Even if rural development measures related to training, information and advisory services have not been designed in the rural development framework as operations contributing primarily to the implementation of the objective "improving environment and the countryside by supporting land management", many of the actions implemented within those measures specifically address environmental issues and relate to trainings, information actions and advisory services expressly set up for improving environment and landscape management. These measures represent a useful tool for achieving EU level environmental objectives, such as those set out in the EU Biodiversity Action Plan for Agriculture.
The indicators contribute to measure the relative degree of policy priority that is given, at national/regional level to environmental knowledge and education programmes for farmers and other operators in rural areas. While information such as the number of participants to training addressing environment does not provide direct information about the environmental effectiveness of the measure, the share of training supported by rural development policy devoted to environment it is a good indicator of policy response at national/regional level. However, it should be also noted that other national schemes not reflected in this indicator might exist to support agri-environmental training or other information actions and advisory services.
Agri-environmental context
In the current rural development framework, the measures 111 "vocational training and information" and 114 "use of advisory services" are specifically designed for promoting knowledge and human potential thus contributing to the main objective of Axis 1 "improving the competitiveness of the agricultural and forestry sector".
Operations foreseen under measure 111 concern in particular vocational training and information actions, including diffusion of scientific knowledge and innovative practices, for persons engaged in the agricultural, food and forestry sectors. These operations respond to the need for new skills of all people involved in agricultural, food and forestry activities as a consequence of the economic, technological and environmental changes. In order to obtain these new required skills, general, technical and economic training activities (not forming part of normal programmes or systems of agricultural and forestry education at secondary or higher levels) need to be offered. The higher the educational level of farmers and forest holders, the higher their labour productivity will be in order to maintain or increase the competitiveness of farm and forestry holdings. Trainings and information actions of different types (i.e. courses, seminars, demonstration projects, information sessions and workshops) can cover several topics (i.e. technical issues, economic training, results of research and new information technologies (ICT)), including the sustainable management of natural resources, cross compliance and the application of production practices compatible with the maintenance and the enhancement of landscape.
Advisory services proposed under measure 114 should allow farmers and forest holders to improve the sustainable management of their holdings by assessing the performance of their agricultural holding and identifying necessary improvements with regard to statutory management requirements and Community standards relating to occupational safety.
Among others (e.g. advise on ensuring quality standards, on the use of sustainable forest practices, information on the latest research result of all kinds of technical processes), advises on how to apply production processes compatible with the enhancement of landscape or the wider protection of the environment can be supported under this measure.
Finally, a training and information measure for economic actor (measure 331) operating in the fields of Axis 3 is designed to contribute to the "quality of life in rural areas and diversification of the rural economy". Through diversification into non-agricultural activities, development of micro-enterprises, encouragement of the tourism sector, the provision of services etcetera, the negative trend of economic and social decline that many European rural areas are facing could be reversed. However, a successful implementation of these measures also requires training in adapted and new skills for the economic actors in the rural areas. The supported actions under this measure also include trainings which specifically address the maintenance and enhancement of landscape, and protection of the environment. The support under this measure does not include the courses of instruction or training which form part of normal education programmes or systems at secondary or higher levels.
See also
- Agri-environmental indicators (online publication)
Further Eurostat information
Publications
- Agriculture, forestry and fishery statistics — 2016 edition
- Environmental statistics and accounts in Europe - 2010 edition
Database
- Agriculture (agri), see:
- Farm structure (ef)
- Farm structure 2010 (ef_2010)
- Farm management and practises (ef_mp)
- Agricultural training of farm managers: number of farms, agricultural area, labour force and standard output (SO) by age and sex of the manager (ef_mptrainman)
- Agricultural training of farm managers: number of farms, agricultural area, labour force, standard output (SO) and livestock (LSU) by economic size of farm (SO in Euro) (ef_mptrainecs)
- Farm management and practises (ef_mp)
- Farm structure: historical data (1990-2007) (ef_h)
- Special interest topics (ef_so)
- Management and practises (ef_so_mp)
- Agricultural training of farm managers: Selected variables by economic size of farm (ESU) (ef_so_mptrain)
- Management and practises (ef_so_mp)
- Special interest topics (ef_so)
- Farm structure 2010 (ef_2010)
- Farm structure (ef)
Dedicated section
Methodology / Metadata
- Farm structure survey (ESMS metadata file — crim_esms)
Source data for tables and figures (MS Excel)
Other information
- Commission Communication COM(2006) 508 - Development of agri-environmental indicators for monitoring the integration of environmental concerns into the common agricultural policy
- Commission Staff working document accompanying COM(2006)508 final
- Corresponding IRENA Fact sheet: IRENA 6
External links
- European Commission

