Most linked-to files
Showing below up to 50 results in range #51 to #100.
View (previous 50 | next 50) (20 | 50 | 100 | 250 | 500)
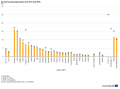
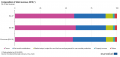
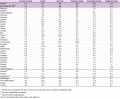
 Share of taxes and levies paid by household consumers for electricity, second half 2019 (%).png Used on 21 pages
1,267 × 780; 94 KB
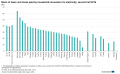
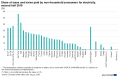 Share of taxes and levies paid by non-household consumers for the electricity, second half 2019 (%).png Used on 21 pages
1,080 × 689; 74 KB
 Top 15 airports in the EU-27, 2018 (million passengers carried).png Used on 21 pages
1,001 × 514; 45 KB
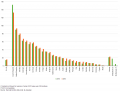
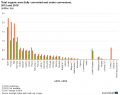 Total organic area (fully converted and under conversion), 2012 and 2018 (million ha) FP20.png Used on 21 pages
1,000 × 791; 43 KB
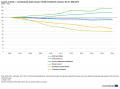
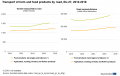 Transport of farm and food products by road, EU-27, 2010-2018 FP20.png Used on 21 pages
1,023 × 644; 36 KB
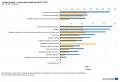
 Waste generation by economic activities and households, EU-27, 2016 (%) FP20.png Used on 21 pages
1,000 × 566; 37 KB

 Acquisitions of citizenship by group of previous citizenship, 2018.png Used on 20 pages
1,024 × 752; 79 KB
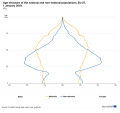 Age structure of the national and non-national populations, EU-27, 1 January 2019 (%).png Used on 20 pages
1,095 × 1,033; 65 KB
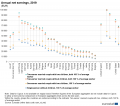

 Average utilised agricultural area per holding, 2010 and 2013 (¹) (hectares) YB16.png Used on 20 pages
1,005 × 760; 38 KB
 Causes of death — standardised death rate, 2017 (per 100 000 inhabitants) Health20.png Used on 20 pages
1,024 × 868; 84 KB
 Causes of death — standardised death rate, EU-27, 2016 (per 100 000 inhabitants) Health20.png Used on 20 pages
1,031 × 708; 37 KB
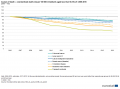
 Causes of death — standardised death rate per 100 000 inhabitants, females, EU-27, 2006-2016 (2006 = 100) Health20.png Used on 20 pages
1,015 × 749; 38 KB
 Causes of death — standardised death rate per 100 000 inhabitants, males, EU-27, 2006-2016 (2006 = 100) Health20.png Used on 20 pages
1,012 × 749; 36 KB
 Causes of death — standardised death rate per 100 000 inhabitants aged less than 65, EU-27, 2006-2016 (2006 = 100) Health20.png Used on 20 pages
1,013 × 748; 43 KB
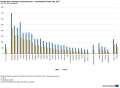
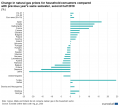 Change in natural gas prices for household consumers compared with previous year's same semester, second half 2019 (%).png Used on 20 pages
1,004 × 895; 64 KB
 Change in natural gas prices for non-household consumers compared with previous year's same semester, second half 2019 (%).png Used on 20 pages
978 × 874; 58 KB
 Change in the number of farms and utilised agricultural area by size class, EU-28, 2005–2016 (%).png Used on 20 pages
927 × 616; 47 KB
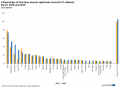 Citizenships of first-time asylum applicants (non-EU-27 citizens), EU-27, 2018 and 2019 (thousands).png Used on 20 pages
1,202 × 884; 68 KB
 Composition of total expenditure, 2019 (¹) (% of total expenditure).png Used on 20 pages
1,017 × 494; 37 KB
 Country of origin for outbound tourism trips, 2018 (average nights spent abroad per inhabitant aged 15 years or more).png Used on 20 pages
1,057 × 724; 55 KB

 Current account balance with selected partners, EU-28, 2015 (EUR billion) YB16.png Used on 20 pages
1,005 × 728; 17 KB
 Current account balance with the rest of the world, 2005–15 (¹) (EUR billion) YB16.png Used on 20 pages
1,006 × 719; 55 KB
 Current account transactions, EU-28, 2005–15 (¹) (EUR billion) YB16.png Used on 20 pages
1,005 × 744; 29 KB
 Current and capital accounts relative to GDP, 2015 (% of GDP) YB16.png Used on 20 pages
855 × 707; 40 KB
 Deaths from ischaemic heart diseases — standardised death rate, 2017 (per 100 000 inhabitants) Health20.png Used on 20 pages
1,528 × 1,125; 202 KB
 Deaths from suicide — standardised death rate, 2017 (per 100 000 inhabitants) Health20.png Used on 20 pages
1,022 × 720; 87 KB
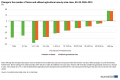
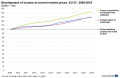 Development of income at current market prices, EU-27, 2009-2019 (2009 = 100).png Used on 20 pages
1,000 × 650; 47 KB
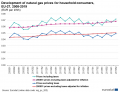 Development of natural gas prices for household consumers, EU-27, 2008-2019 (EUR per kWh).png Used on 20 pages
902 × 694; 62 KB
 Development of natural gas prices for non-household consumers, EU-27, 2008-2019 (EUR per kWh).png Used on 20 pages
1,057 × 631; 59 KB
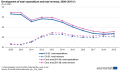 Development of total expenditure and total revenue, 2009–2019 (¹) (% of GDP).png Used on 20 pages
809 × 488; 41 KB
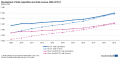 Development of total expenditure and total revenue, 2009–2019 (¹) (Billion EUR).png Used on 20 pages
1,000 × 488; 44 KB
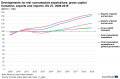 Developments for real consumption expenditure, gross capital formation, exports and imports, EU-27, 2009-2019 (2010 = 100).png Used on 20 pages
1,000 × 657; 58 KB
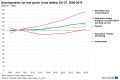 Developments for real gross value added, EU-27, 2009-2019 (2010 = 100).png Used on 20 pages
1,000 × 666; 54 KB
- Digital economy and society - households and individuals FP2020 tables and figures update.xlsx Used on 20 pages
; 118 KB
 Distribution of EU farms and utilised agricultural area according to farm size, 2016 (%).png Used on 20 pages
836 × 506; 33 KB
_SILC20.png)
_FP20.png)
.png)
.png)
.png)
,_2012_and_2018_(million_ha)_FP20.png)

_FP20.png)

.png)
.png)
.png)
_(hectares)_YB16.png)
_Health20.png)
_Health20.png)
_Health20.png)
_Health20.png)
_Health20.png)
.png)
.png)
.png)
,_EU-27,_2018_and_2019_(thousands).png)

_(%25_of_total_expenditure).png)
_(%25_of_total_revenue).png)

.png)

_YB16.png)
_(EUR_billion)_YB16.png)
_(EUR_billion)_YB16.png)
_YB16.png)
_YB16.png)
_Health20.png)
_Health20.png)
.png)
.png)
.png)
_(%25_of_GDP).png)
_(Billion_EUR).png)
.png)
.png)
.png)