Most linked-to files
Showing below up to 50 results in range #1 to #50.
View (previous 50 | next 50) (20 | 50 | 100 | 250 | 500)


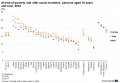
 Relative increases from 1960 of the all-countries average of the median age (in yellow) and its logistic curve (in blue).PNG Used on 44 pages
854 × 534; 73 KB
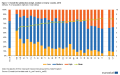
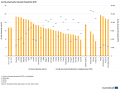
 Persons in employment by occupation and socio-economic group, aged 20-64, EU-27, 2019 (% of total employment).png Used on 41 pages
1,553 × 512; 149 KB

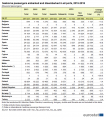
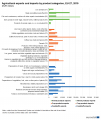 Agricultural exports and imports by product categories, EU-27, 2019 (EUR million) FP20.png Used on 21 pages
1,024 × 1,214; 89 KB
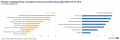
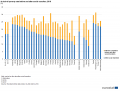
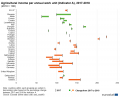 Agricultural income per annual work unit (Indicator A), 2017-2018 (2010 = 100) FP20.png Used on 21 pages
1,000 × 808; 45 KB
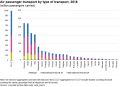 Air passenger transport by type of transport, 2018 (million passengers carried).png Used on 21 pages
884 × 644; 40 KB
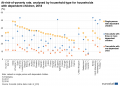 At-risk-of-poverty rate, analysed by household type for households with dependent children, 2018 (%) SILC20.png Used on 21 pages
1,001 × 717; 84 KB
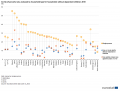 At-risk-of-poverty rate, analysed by household type for households without dependent children, 2018 (%) SILC20.png Used on 21 pages
1,005 × 765; 46 KB
 At-risk-of-poverty rate after social transfers, persons aged 16 years and over, 2018 (%) SILC20.png Used on 21 pages
1,001 × 694; 63 KB
 At-risk-of-poverty rate after social transfers by most frequent activity status, persons aged 18 years or over, 2018 (%) SILC20.png Used on 21 pages
1,023 × 822; 56 KB
 At-risk-of-poverty rate before and after social transfers, 2018 (%) SILC20.png Used on 21 pages
1,005 × 765; 63 KB
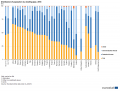
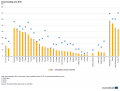
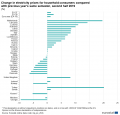 Change in electricity prices for household consumers compared with previous year, same semester, second half 2019.png Used on 21 pages
996 × 957; 69 KB
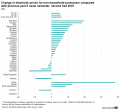 Change in electricity prices for non-household consumers compared with previous year, same semester, second half 2019.png Used on 21 pages
1,012 × 930; 67 KB
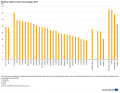
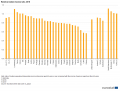
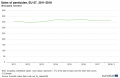
 Development of electricity prices for household consumers, 2008-2019 (EUR per kWh).png Used on 21 pages
1,575 × 996; 100 KB
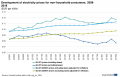 Development of electricity prices for non-household consumers, 2008-2019 (EUR per kWh).png Used on 21 pages
1,037 × 664; 62 KB

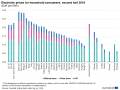 Electricity prices for household consumers, second half 2019 (EUR per kWh).png Used on 21 pages
1,001 × 753; 93 KB
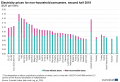 Electricity prices for non-household consumers, second half 2019 (EUR per kWh).png Used on 21 pages
1,003 × 684; 86 KB
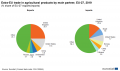 Extra-EU trade in agricultural products by main partner, EU-27, 2019 (% share of EU-27 exports imports) FP20.png Used on 21 pages
1,025 × 604; 39 KB
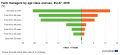

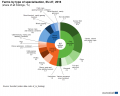 Farms by type of specialisation, EU-27, 2016 (share of all holdings, %) FP20.png Used on 21 pages
1,024 × 822; 63 KB
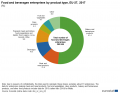 Food and beverages enterprises by product type, EU-27, 2017 (%) FP20.png Used on 21 pages
1,001 × 774; 47 KB
 Housing cost overburden rate, analysed by tenure status, 2018 (%) SILC20.png Used on 21 pages
1,026 × 837; 52 KB
 Inequality of income distribution — income quintile share ratio, 2018 SILC20.png Used on 21 pages
1,000 × 694; 79 KB
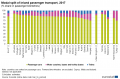 Modal split of inland passenger transport, 2017 (% share in passenger-kilometres).png Used on 21 pages
1,001 × 658; 100 KB
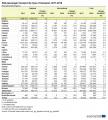 Rail passenger transport by type of transport, 2017-2018 (thousand passengers).png Used on 21 pages
764 × 849; 91 KB
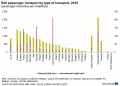 Rail passenger transport by type of transport, 2018 (passenger-kilometres per inhabitant).png Used on 21 pages
1,136 × 818; 81 KB
 Seaborne passengers embarked and disembarked in all ports, 2015-2018 (thousand passengers).png Used on 21 pages
705 × 794; 81 KB


_and_its_logistic_curve_(in_blue).PNG)

_FP20.png)
,_2017-2018_(2010_%3D_100)_FP20.png)
.png)
_SILC20.png)
_SILC20.png)
_SILC20.png)
_SILC20.png)

_SILC20.png)


.png)
.png)
_SILC20.png)
_SILC20.png)
.png)
.png)
_FP20.png)
_FP20.png)
_FP20.png)
_FP20.png)
_FP20.png)
_SILC20.png)

.png)
_SILC20.png)
.png)
.png)
_SILC20.png)

_FP20.png)
.png)
.png)