European Atlas of the Seas
Explore, collate and create your own sea map.
Learn more about Europe's seas and coasts, their environment, related human activities and European policies.
Go back to the Atlas
List of layers:
- Algae production
- Aquaculture
- Blue indicators
- Climate change
- Employment
- Energy
- Environment
- Europe
- Fisheries
- Governance
- Litter
- Nature
- Ocean literacy
- Oceanographic instruments
- Organisations and councils
- Pipelines and cables
- Population
- Satellite images
- Sea bottom
- Sea life
- Seabed habitats
- Security
- Spatial planning
- Tourism
- Trade
- Transport
- Water analysis
Algae production
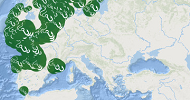
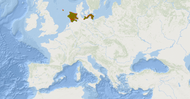
Macroalgae production facilities
Microalgae production facilities
Aquaculture
Aquaculture production
(2008-2019)
Aquaculture production by species
(2008-2018)
Freshwater finfish farms
Seawater finfish farms
Shellfish farms
Blue indicators
Employment in coastal tourism
Data owner: DG MARE
View dashboardsEmployment in marine extraction of minerals, oil and gas
Data owner: DG MARE
View dashboardsEmployment in marine fisheries, aquaculture and processing
Data owner: DG MARE
View dashboardsEmployment in maritime transport
Data owner: DG MARE
View dashboardsEmployment in ports, warehousing and water projects
Data owner: DG MARE
View dashboardsEmployment in shipbuilding and repair
Data owner: DG MARE
View dashboardsEmployment in the established blue economy
Data owner: DG MARE
View dashboardsClimate change
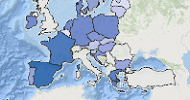
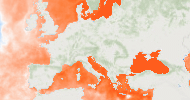
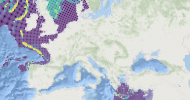
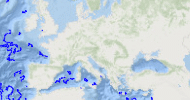
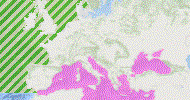
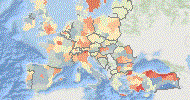
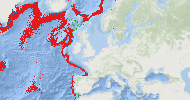
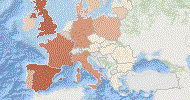
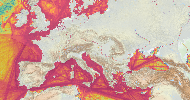
Global mean sea level regional trend
The time series shows that the average global sea level has risen by more than 8 cm since the early 1990’s and it continues to rise at a rate of 3.3 mm each year. New calculations reveal that global mean sea level rise is accelerating, with this rate increasing by 0.12 ± 0.073 mm each year.
Sea levels do not rise homogeneously and thus some regions are more threatened than others. The map shows the spatial distribution of sea level trends since 1993. It reveals that sea level is rising for the vast majority of the global ocean but there is large-scale variation with regions like the western tropical Pacific Ocean reaching amplitudes of up to +8 mm/year. In this area, the regional trends are mainly due to thermal expansion. The regional sea level trend uncertainty is on the order of 2-3 mm/year with values as low as 0.5 mm/year or as high as 5.0 mm/year depending on the region.
This sea level ocean monitoring indicator is derived from the DUACS delayed-time (DT-2018 version). These products are distributed by the Copernicus Climate Change Service and also available in the Copernicus Marine Service catalogue.
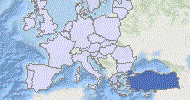
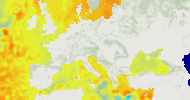
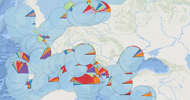
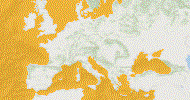
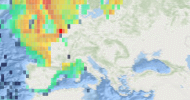
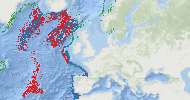
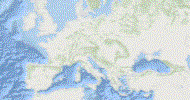
Global sea surface temperature regional trend
The time series shows that the average global sea surface temperature has risen by more than 0.3 °C since the early 1990s and continues to rise at an unprecedented rate of 0.014 ± 0.001 °C per year. The past four years we observed the warmest ocean surface temperatures since records began.
Sea Surface Temperature does not rise homogeneously and thus some regions are more threatened than others. The map shows the spatial distribution of the mean sea surface temperature trends over the Global Ocean since 1993. It reveals that warming is occurring for the vast majority of the globe between 1993 and 2018. One of the exceptions to this trend is the North Atlantic, particularly the region south of Greenland where a cooling trend is observed.
This sea surface temperature ocean monitoring indicator is based on daily, global climate sea surface temperature (SST) analyses generated by the European Space Agency (ESA), SST Climate Change Initiative (CCI) and the Copernicus Climate Change Service (C3S) and is available from the Copernicus Marine Service catalogue.
Employment
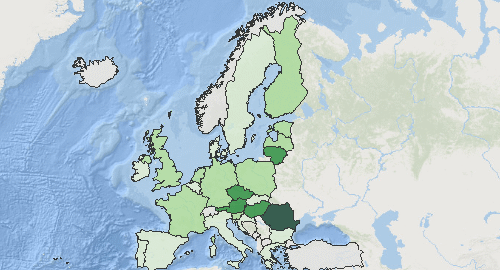
Business demography and high growth enterprise by coastal/non-coastal regions
Employment by coastal/non-coastal regions
Employment in fisheries and aquaculture
Employment in the primary sector
Employment in the secondary sector
Employment in the tertiary sector
Gross domestic product (GDP)
Gross domestic product (GDP) by coastal/non-coastal regions
Gross value added at basic prices by coastal/non-coastal regions
Maritime impact
Energy
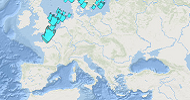
Average wind speed and direction
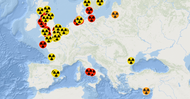
Coastal nuclear power plants
Locations of wind farms
Locations of wind farms (polygons)
Ocean energy - Project locations
Ocean energy - Test sites
Offshore installations (oil & gas)
Tidal amplitude

Wave height and direction
Environment
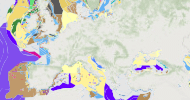
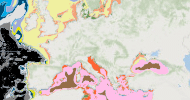
Coastal geology
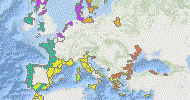
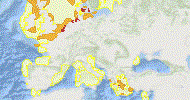
Coastline changes based on satellite data (2019)
Drifting buoy temperature tracks (Monthly)
Integrated coastal zone management (ICZM)
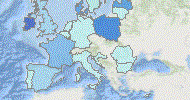
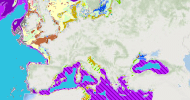
This map presents information on Integrated Coastal Zone Management (ICZM) across Europe. These data are the outcomes of the European project OURCOAST. Integrated coastal zone management is a process for the management of the coast using an integrated approach, regarding all aspects of the coastal zone, including geographical and political boundaries. This allows an assessment and adaptation to the risks and impacts of climate change and helps to promote sustainable solutions to their coastal management practices.
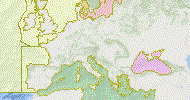
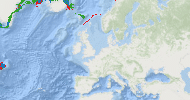
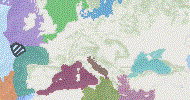
Large marine ecosystems
www.oceansatlas.org - This map shows the world’s oceans divided into Large Marine Ecosystems (LMEs) that each have distinct seafloor, physical and biological characteristics. The size of an LME is about 200,000 km2 or more and focuses on coastal areas connecting estuaries and river basins seaward to the edge of continental margins. LMEs are useful to help sustainable management of ocean resources (e.g. fish).
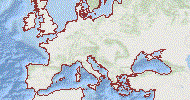
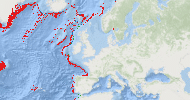
Marine Natura 2000 sites
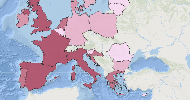
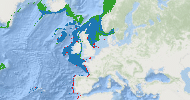
Marine protected areas (by country)
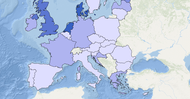
(2011-2019)
Spatial prioritization for conserving the deep-sea ecosystems
Europe
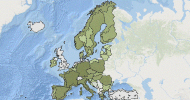
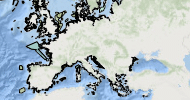
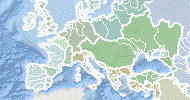
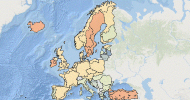
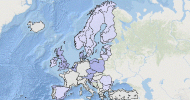
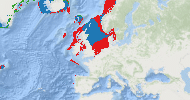
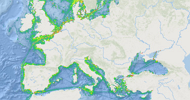
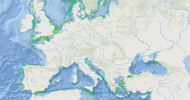
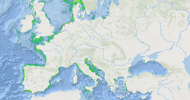
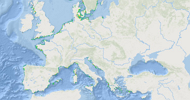
Coastline
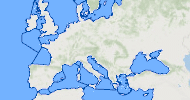
The EEA - The coastline is the area where the land meets the sea or the ocean. This coastline map for highly detailed analysis, e.g. 1:100.000 map scale, for geographical Europe, has been created by the European Environment Agency (EEA). The data is obtained from satellite imagery (e.g. EUHYDRO and GSHHG). A few manual amendments were necessary to meet requirements from EU Nature Directives, Water Framework Directive and Marine Strategy Framework Directive.
Countries
Country borders

Geographic grid lines
Sea names
Undersea relief names

National Geospatial-Intelligence Agency - The bottom surface of the ocean shows complex and varied geographical features, formed due to tectonic, volcanic, erosional and depositional processes and their interactions. This map shows the names of undersea reliefs (Mid-ocean ridges, Trenches, Submarine canyons, Seamounts, etc.).
Fisheries
Catches by country
(2000-2019)
Catches by fishing zone

More info
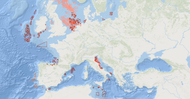
European structural aid (EFF-EMFF)
AXE1: Adjustments and improvements to the fishing fleet.
AXE2: Development of environmentally friendly aquaculture and inland fishing, diversification of aquaculture species as well as processing and marketing of fisheries and aquaculture products.
AXE3: Measures of common interest like the protection of aquatic fauna and flora, the development of ports, improving fishing products traceability, etc.
AXE4: Sustainable development of fisheries areas and communities (e.g. adding value to fisheries products, development of tourism infrastructure, environmental protection) in order to reduce their economic dependency on fish catches.
AXE5: Technical assistance in the form of studies, reports and actions to assist the implementation of operational programs.
Fisheries and aquaculture product consumption
Fisheries local action groups (FLAGs)
Fishing fleet - Engine power by ports
Fishing fleet - Number of vessels by ports
Fishing fleet - Tonnage by ports
Fishing fleet by engine power
(1990-2018)
Fishing fleet by gross tonnage
(1990-2018)
Fishing fleet by type of gear
(1990-2018)
Fishing intensity
Fishing ports equipped with electronic recording & Reporting System (ERS)
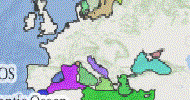
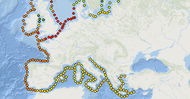
Fishing zones (FAO)
FAO - This map shows the international fishing zones defined by the Food and Agriculture Organization (FAO) of the United Nations. For statistical purposes, 27 major fishing zones have been internationally established to date. These comprise eight major inland fishing zones covering the inland waters of the continents, and nineteen major marine fishing zones covering the waters of the Atlantic, Indian, Pacific and Southern Oceans, with their adjacent seas. The fishing zones, inland and marine, are identified by their names and by two-digit codes.)
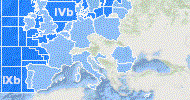
Fishing zones (ICES)
Landings of fishery products
(2000-2018)
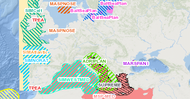
Quotas by country and fishing zone
Cooperation between EU and non-EU countries is important to fight IUU activities, ensure food security and compliance with international rules. The Common Fisheries Policy (CFP) is the fisheries policy of the European Union (EU). It sets quotas for the amount of a specific fish species each country is allowed to catch.
This map presents the catch limits (expressed in tonnes) that are set for most commercial fish stocks. The Commission prepares the proposals, based on scientific advice on the stock status from advisory bodies such as ICES and STECF. By clicking on the map, you will see the corresponding quotas by species, as fixed by Council Regulations.
Quotas by species
Stocks by fishing zone
Governance
Conference of Peripheral Maritime Regions
European Maritime Day
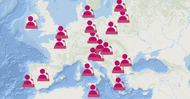
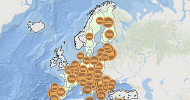
European Maritime Day in My Country 2021
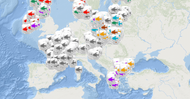
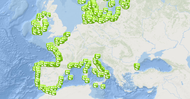
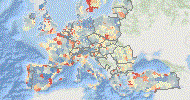
EMD In My Country is an important part of the wave of ocean awareness and activism that has been rising steadily in recent years, and the events under its brand have become more and more popular, attracting more than 30.000 participants every year. Local activities such as beach clean-ups, guided tours of ports, art exhibitions, workshops, conferences, seminars, exhibitions on maritime themes, ocean literacy actions, eco-tours and walks in areas with significant maritime heritage, boat excursions, visits to maritime museums, ships, aquaria, shipyards etc. aim to a wide audience across Europe, with a 'fun and game' component directly appealing to a younger public. These activities enable the many European regions with a maritime culture to join in the celebrations and highlight the vital role of the seas and oceans for the local societies.
As the COVID-19 crisis is not yet over, EMD In My Country this year includes both virtual and, where possible, physical events that take place in 2021.
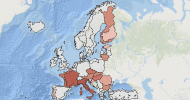
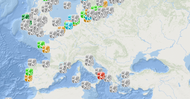
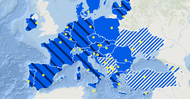
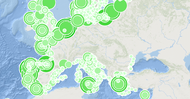
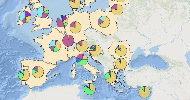
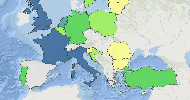
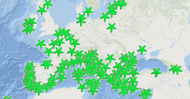
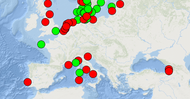
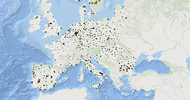
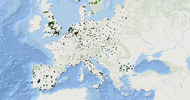
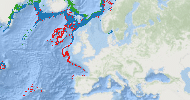
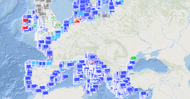
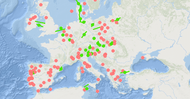
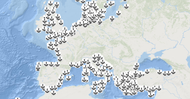
This map offers an overview of the 232 EMD in my Country 2021 local events in 25 different countries (21 EU and 4 non-EU). Many organisers also use their events to demonstrate the European Atlas of the Seas to students and pupils across the EU!
To make this map even more unique, we have hidden something special in it. Join the celebrations, explore the map and try to solve the EMD in My Country 2021 treasure hunt.
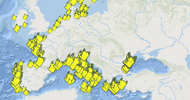
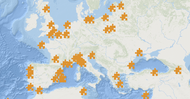
European Maritime Day in My Country 2022
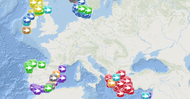
EMD In My Country is an important part of the wave of ocean awareness and activism that has been rising steadily in recent years, and the events under its brand have become more and more popular, attracting more than 50.000 participants every year. Local activities such as beach clean-ups, guided tours of ports, art exhibitions, workshops, conferences, seminars, exhibitions on maritime themes, ocean literacy actions, eco-tours and walks in areas with significant maritime heritage, boat excursions, visits to maritime museums, ships, aquaria, shipyards etc. aim to a wide audience across Europe, with a 'fun and game' component directly appealing to a younger public. These activities enable the many European regions with a maritime culture to join in the celebrations and highlight the vital role of the seas and oceans for the local societies.
As the COVID-19 crisis is not yet over, EMD In My Country this year includes both virtual and, where possible, physical events that take place in 2022.
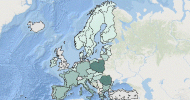
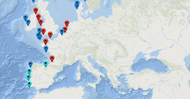
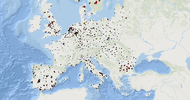
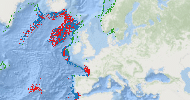
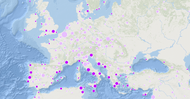
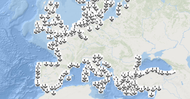
This map offers an overview of the EMD in my Country 2022 local events in 29 different countries (22 EU and 7 non-EU). Many organisers also use their events to demonstrate the European Atlas of the Seas to students and pupils across the EU!
To make this map even more unique, we have hidden something special in it. Join the celebrations, explore the map and try to solve the EMD in My Country 2022 Boat Race.
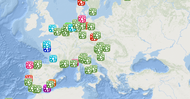
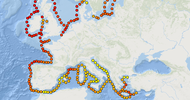
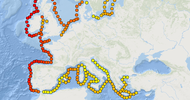
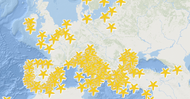
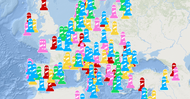
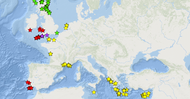
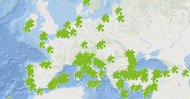
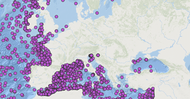
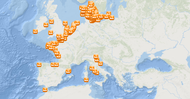
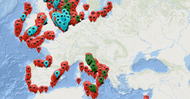
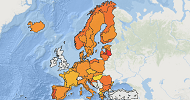
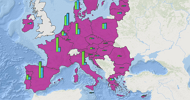
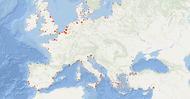
European Maritime Day in My Country 2023
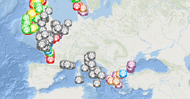
EMD In My Country is an important part of the wave of ocean awareness and activism that has been rising steadily in recent years, and the events under its brand have become more and more popular, attracting more than 50.000 participants every year. Local activities such as beach clean-ups, guided tours of ports, art exhibitions, workshops, conferences, seminars, exhibitions on maritime themes, ocean literacy actions, eco-tours and walks in areas with significant maritime heritage, boat excursions, visits to maritime museums, ships, aquaria, shipyards etc. aim to a wide audience across Europe, with a 'fun and game' component directly appealing to a younger public. These activities enable the many European regions with a maritime culture to join in the celebrations and highlight the vital role of the seas and oceans for the local societies.
EMD In My Country this year includes physical, virtual and hybrid events.
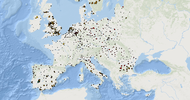
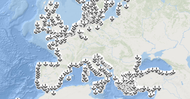
This map offers an overview of the EMD in my Country 2023 local events in different countries. Many organisers also use their events to demonstrate the European Atlas of the Seas to citizens, students and pupils across the EU!
To make this map even more unique, we have hidden something special in it. Join the celebrations, explore the map and try to solve the Atlas Geocaching Game.
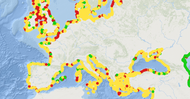
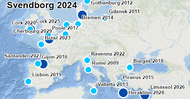
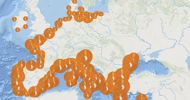
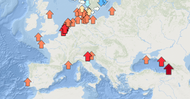
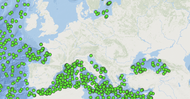
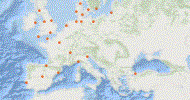
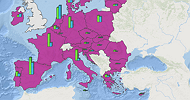
European Maritime Day in My Country 2024
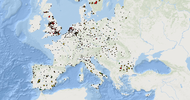
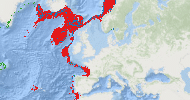
Since the first edition in 2018, the number of European Maritime Day in My Country events has increased significantly, with a wide range of activities such as beach clean-ups, guided tours, art exhibitions, workshops, and conferences. In 2023, 494 events were organised in 31 countries, both in the EU and outside the EU.
EMD In My Country this year includes physical, virtual and hybrid events.
This map offers an overview of the EMD in my Country 2024 local events in different countries. Many organisers also use their events to demonstrate the European Atlas of the Seas to citizens, students and pupils across
To make this map even more unique, we have hidden something special in it. Join the celebrations, explore the map and try to solve the Blue Economy Challenge.
European Maritime Day in my country (2019)
Macro-Regional Strategies and the Atlantic Strategy
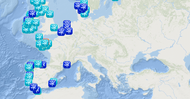
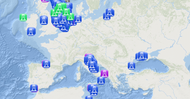
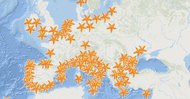
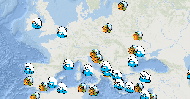
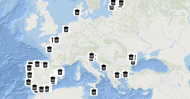
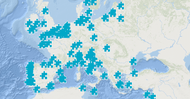
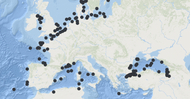
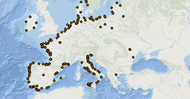
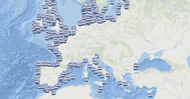
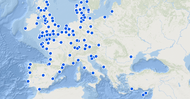
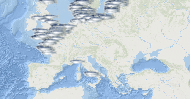
Marine installations
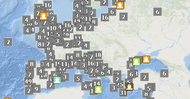
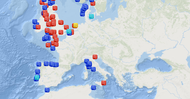
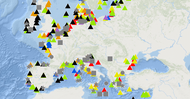
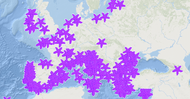
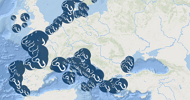
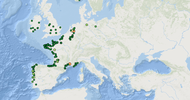
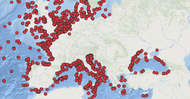
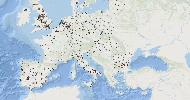
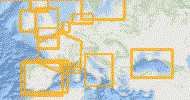
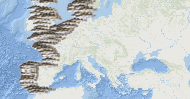
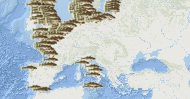
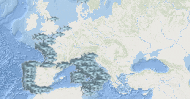
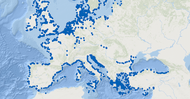
 Europe has an extensive network of marine research infrastructure which incorporates a wide range of facilities including research vessels and embarkable equipment, on-land and offshore research and test facilities in the physical, biological and chemical domain as well as numerous remote and in-situ observation facilities. This map shows the different facilities based on the Marine Research Infrastructures database from EurOcean . Click on the map to see the key characteristics for each facility, including links and contacts in order to access further details provided by the operators of these facilities.
Mission Actions - EU Mission Restore our Ocean and Waters
1. Protect and restore marine and freshwater ecosystems and biodiversity, in line with the EU Biodiversity Strategy 2030;
2. Prevent and eliminate pollution of our ocean, seas and waters, in line with the EU Action Plan Towards Zero Pollution for Air, Water and Soil;
3. Make the sustainable blue economy carbon-neutral and circular, in line with the proposed European Climate Law and the holistic vision enshrined in the Sustainable Blue Economy Strategy.
To reach these objectives the Mission is also putting in place two enablers:
- Digital Ocean and Water Knowledge System;
- Public mobilisation and engagement.
(2021-2030)
Regional sea conventions
Litter
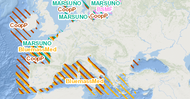
Beach Clean Up Events
Beach Litter - Composition of litter according to material categories - Official monitoring
Beach Litter - Median number of Cigarette related items per 100m & to 1 survey - without UNEP_MARLIN - Official monitoring
Beach Litter - Median number of Plastic bags related items per 100m & to 1 survey - Official monitoring
Beach Litter - Median number of fishing and aquaculture related plastic items per 100m & to 1 survey - Official monitoring
Beach Litter - Median total number of litter items per 100m & to 1 survey - Official monitoring
Dredge spoil dumping (points)
Dredge spoil dumping sites (polygons)
Dumped munitions (points)
Dumped munitions (polygons)
Seabed Litter - Material categories percentage per year
Seabed litter - Density (Nb. Items/km2)
Seabed litter - Fishing related items density (Nb. Items/km2)
Seafloor litter - Plastic bags density (Nb. items/km2)
Waste discharged in ports
Nature
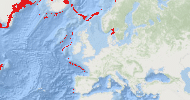
Coasts affected by tsunamis
Global sea-basins
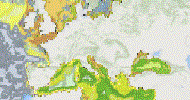
Land cover
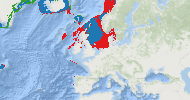
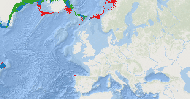
Relative sea level trends
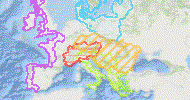
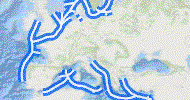
River basins
River runoff trends
Rivers and lakes
Sea level anomalies
Sea level change
Tsunamis origin points
Underwater noise indicator
Ocean literacy
EU4Ocean Coalition for Ocean Literacy – EU4Ocean Platform members
The EU4Ocean Platform brings together a wide diversity of stakeholders spanning the areas of marine research, science-policy, blue economy industry and the private sector, civil society, arts, education, youth and media. This includes multiple scales from local and national organisations to regional sea and European initiatives. Platform Member Pages.
Platform members can share ideas, build partnerships and collaborate to ensure a more coordinated approach to ocean literacy in Europe and develop concrete activities that creates real awareness, engagement and momentum across society for action and change. The members are mobilised around three Working Groups (WGs) themes: Climate and Ocean, Food from the Ocean and Healthy and Clean Ocean. More information.
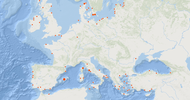
Education for Climate: Water surface temperature measured by students
(September 2022 – March 2023)
European Atlas of the Seas Ambassadors
Network of European Blue Schools
Projects of Young Ocean Advocates
Oceanographic instruments
Argo floats
Drifting buoy tracks (Monthly)
Drifting buoys
Ferrybox
High Frequency Radar
Mooring platforms
River gauging stations
Underwater glider
Organisations and councils
Advisory Councils
Organisations of producers
- guide producers towards sustainable fishing and aquaculture, in particular by collectively managing the activities of their members
- help them match supplies with market demands, and
- support them in creating added value.
Regional fisheries management organisations (highly-migratory species)
Regional fisheries management organisations (non highly-migratory species)
Pipelines and cables
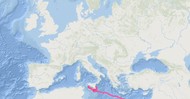
Offshore pipelines routes
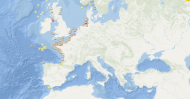
Telecommunication cables - Germany
Telecommunication cables - Malta
Telecommunication cables - SIGCables routes
Population
Active population
Culture and tourism - cities and greater cities
(2000-2018)
Education - cities and greater cities
(1991-2018)
Fertility and mortality - cities and greater cities
(1991-2018)
Labour market - cities and greater cities
(2000-2018)
Living conditions - cities and greater cities
(2000-2018)
Population aged 65 years and more
Population by citizenship and country of birth - cities and greater cities

(2004-2018)
Population change
Population change by coastal/non-coastal regions
Population density
Population density by coastal/non-coastal regions
Population on 1 January by age groups and sex - cities and greater cities
(1990-2018)
Population settlement

Population structure - cities and greater cities
(1990-2018)
Unemployment
Urban-rural typology
Satellite images
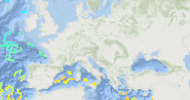
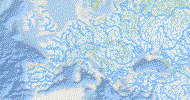
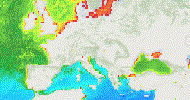
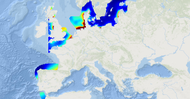
Chlorophyll concentration (satellite-derived)
Chlorophyll concentration anomalies (satellite-derived)

Global Ocean Chlorophyll (daily)
Global Ocean Chlorophyll (monthly-mean)
Sea surface temperature (satellite-derived)
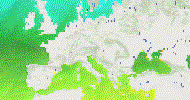
Sea surface temperature anomalies (satellite-derived)
Water Transparency
Sea bottom
Active offshore hydrocarbon licences
Deep-sea mineral resources

Dredging areas
Hydrocarbon reservoir
Marine sediment extraction
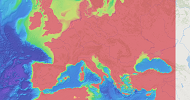
Mean underwater depth
Offshore hydrocarbon extraction boreholes
Seabed sediment accumulation rates

Seabed sediments
Seabed substrates
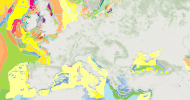
Seafloor lithology
Seafloor stratigraphy
Submarine fluid emissions

Submarine landslides
Submarine volcanoes
Submerged landscapes
Tectonic lines
Underwater depth contours
Sea life
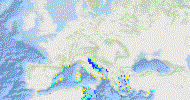
Marine bird observations
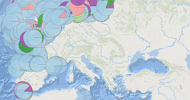
Marine species observed per sea region
Zooplankton (Acartia) abundance in winter
Zooplankton (Acartia) abundances in autumn

Zooplankton (Acartia) abundances in spring

Zooplankton (Acartia) abundances in summer
Zooplankton (Calanus finmarchicus) abundance in autumn
Zooplankton (Calanus finmarchicus) abundance in spring
Zooplankton (Calanus finmarchicus) abundance in summer
Zooplankton (Calanus finmarchicus) abundance in winter
Zooplankton (Temora longicornis) abundance in autumn
Zooplankton (Temora longicornis) abundance in spring
Zooplankton (Temora longicornis) abundance in summer
Zooplankton (Temora longicornis) abundance in winter
Seabed habitats
Coralligenous Habitats
Habitat Descriptors - Biological zones
Habitat classification by EUNIS 2019
Maerl Habitats
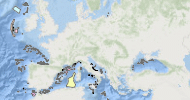
Posidonia oceanica distribution (seagrass species)

Predicted climate change impact on the American plaice habitat
Predicted climate change impact on the Atlantic cod habitat
Predicted climate change impact on the Greenland halibut habitat
Predicted climate change impact on the armoured sea fan coral habitat
Predicted climate change impact on the blackbelly rosefish habitat
Predicted climate change impact on the bonsai bamboo coral habitat
Predicted climate change impact on the bubblegum coral habitat
Predicted climate change impact on the cockscomb cup coral habitat
Predicted climate change impact on the deepwater redfish habitat
Predicted climate change impact on the rock grenadier fish habitat
Predicted climate change impact on the white coral habitat
Predicted climate change impact on the white stony coral habitat
Predictive habitat map (MSFD)
Security
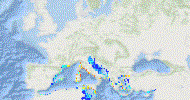
Accident density
Integrated maritime surveillance projects
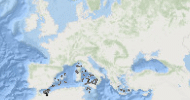
Major oil spill incidents
Oil spill response vessels
Spatial planning
Coastal and maritime atlases
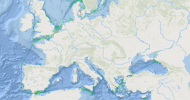
Marine Regions of Europe
Maritime spatial planning projects
(2009-2022)
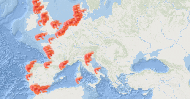
Tourism
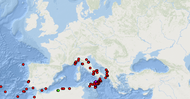
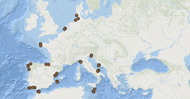
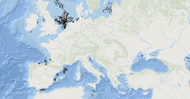
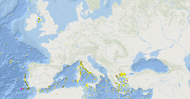
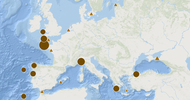
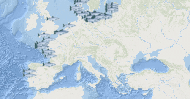
Maritime museums
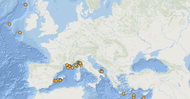
European Maritime Heritage - This map shows the main European maritime museums including the ones listed by European Maritime Heritage (EMH). European maritime museums offer unique experiences to discover our maritime history. They ensure that ancient and historical artefacts, and vessels are preserved in optimum conditions, and are accessible for general interest, for academic study and for public education.
Nights spent at tourist accommodation establishments by coastal/non-coastal areas
Number of beds per square kilometre (1990-2011)
Number of establishments, bedrooms and bed-places by coastal/non-coastal areas
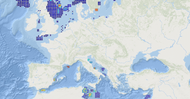
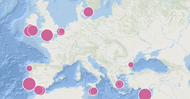
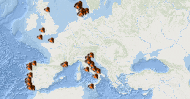
Public aquariums
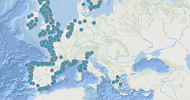
International Aquarium Forum - This map shows over 100 public aquariums in Europe, listed by the International Aquarium Forum (IAF) for Europe. A trip to the aquarium is always an enriching experience. Histories of seafarers, physiology of marine animals, ecological facts about different marine habitats and the importance of keeping our seas clean are just some examples of the kind of information you can find there.
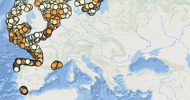
State of bathing waters
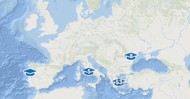
UNESCO world heritage
UNESCO - In this map you will find the location of maritime and coastal UNESCO World Heritage sites to visit in Europe and all around the world. There, you can learn about history and travel back in time to understand our societies from a cultural, social, environmental, and economic point of view, and the rich legacies they have left. These sites which are part of the World Heritage List are considered by the World Heritage Committee as having outstanding universal value.
Trade
First Sales of Fish (Alaska Pollock)
First Sales of Fish (Cod)
First Sales of Fish (Herring)
First Sales of Fish (Mussel)
First Sales of Fish (Salmon)
First Sales of Fish (Shrimps)
First Sales of Fish (Tuna)
Fisheries products processing sector
EUMOFA - This map shows the production value of the fisheries product processing sector.
Trade of fisheries and aquaculture products (value)
(2004-2021)
Trade of fisheries and aquaculture products (volume)
(2004-2021)
Transport
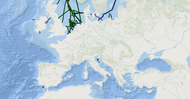
Electricity trans-european networks
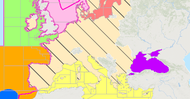
This map shows the Trans-European Energy Networks (TEN-Es) for electricity. The Trans-European Networks for Energy (TEN-E) strategy is focused on linking the energy infrastructure of EU countries. TEN-Es are integral to the European Union's overall energy policy objectives, increasing competitiveness in the electricity and gas markets, reinforcing security of supply, and protecting the environment.
Ferry routes
Main ports (goods traffic)
Main ports (locations)
Main ports (passengers traffic)
Main ports (vessels traffic)
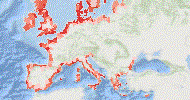
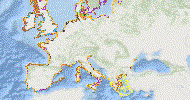
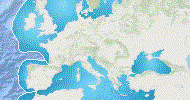
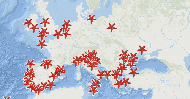
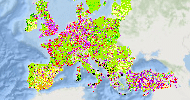
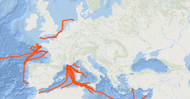
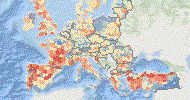
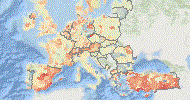
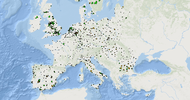
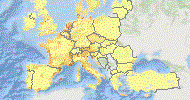
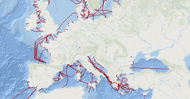
Marine traffic density map
MarineTraffic.com - The European seas are a major hub of maritime traffic. Knowledge of where the vessel traffic is taking place is pivotal for marine spatial planning (e.g. for offshore wind energy parks and subsea cables and pipelines) and for assessing the impact of human activities (e.g. fishing, offshore construction) on marine ecosystems. This map shows accumulated data collected on ship positions so as to enable the creation of density maps so that anyone can get a picture of the most traveled sea routes around the globe.
Motorways of the sea
Ports
Traffic of goods by port
Traffic of passengers by port
Transport - cities and greater cities

(2000-2018)
Vessel density 2021 (all)
Vessel density 2021 (cargo)
Vessel density 2021 (dredging or underwater ops)
Vessel density 2021 (fishing)
Vessel density 2021 (high speed craft)

Vessel density 2021 (military and law enforcement)

Vessel density 2021 (other)
Vessel density 2021 (passenger)
Vessel density 2021 (pleasure craft)

Vessel density 2021 (sailing)
Vessel density 2021 (service)
Vessel density 2021 (tanker)
Vessel density 2021 (tug and towing)
Vessel density 2021 (unknown types)
Water analysis
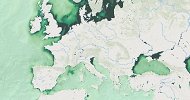
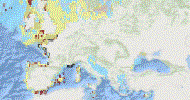
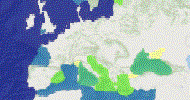
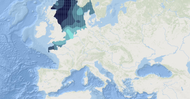
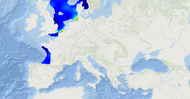
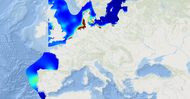
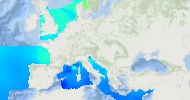
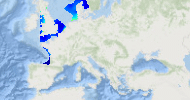
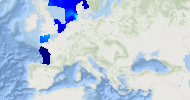
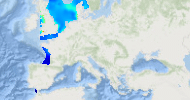
Concentration of chlorophyll-a (summer 2012-2017)
Concentration of chlorophyll-a (autumn 2012-2017)
Concentration of chlorophyll-a (spring 2012-2017)
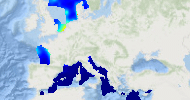
Concentration of chlorophyll-a (winter 2012-2017)
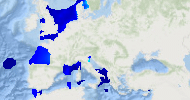
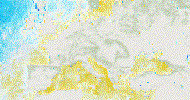
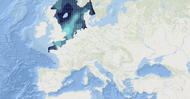
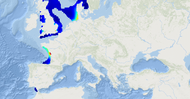
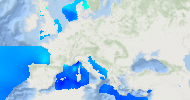
Surface water dissolved inorganic nitrogen concentration (autumn 2012-2017)
Surface water dissolved inorganic nitrogen concentration (spring 2012-2017)
Surface water dissolved inorganic nitrogen concentration (summer 2012-2017)
Surface water dissolved inorganic nitrogen concentration (winter 2012-2017)
Water body ammonium 2010 in autumn
Water body ammonium 2010 in spring
Water body ammonium 2010 in summer

Water body ammonium 2010 in winter
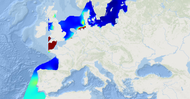
Water body dissolved oxygen concentration 2012-2017 in autumn
Water body dissolved oxygen concentration 2012-2017 in spring
Water body dissolved oxygen concentration 2012-2017 in summer
Water body dissolved oxygen concentration 2012-2017 in winter
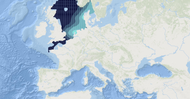
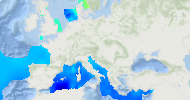
Water body phosphate 2012-2017 in autumn
Water body phosphate 2012-2017 in spring
Water body phosphate 2012-2017 in summer

Water body phosphate 2012-2017 in winter
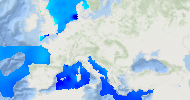
Water body silicate 2012-2017 in autumn
Water body silicate 2012-2017 in spring
Water body silicate 2012-2017 in summer
Water body silicate 2012-2017 in winter
© European Union, 1995-2020 English български čeština dansk Deutsch ελληνικά español eesti suomi français Gaeilge hrvastski magyar Italiano lietuvių latviešu Malti Nederlands polski português română slovenčina slovenščina svenska