Unused files
The following files exist but are not embedded in any page. Please note that other web sites may link to a file with a direct URL, and so may still be listed here despite being in active use.
Showing below up to 500 results in range #1 to #500.
View (previous 500 | next 500) (20 | 50 | 100 | 250 | 500)
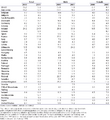
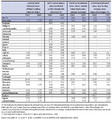
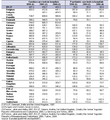
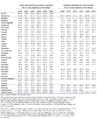
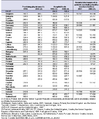 Healthcare indicators (per 100 000 inhabitants).PNG 572 × 690; 40 KB
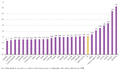
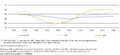
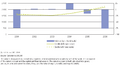
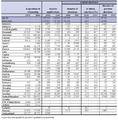
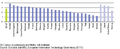
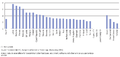
 Minimum wages in EU Member States and Turkey.PNG 947 × 721; 65 KB
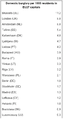
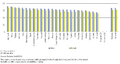
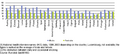 Daily smokers, 2003 (1) (% of male female population).PNG 556 × 250; 10 KB
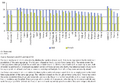
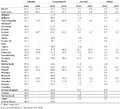 Gross domestic expenditure on R&D by source of funds.PNG 927 × 842; 81 KB
 20090304152555!GDP per capita at current market prices, 2007.PNG 716 × 336; 25 KB
 Daily smokers among the population aged 15-24, 2003 (1).PNG 919 × 469; 40 KB
 Farm labour force, 2005.PNG 927 × 1,058; 129 KB
 Life expectancy at 65, 2006 (1)(years).PNG 675 × 301; 23 KB
 Net migration (including corrections), EU-27 (1)(1 000).PNG 673 × 302; 18 KB
 Pupil-teacher ratio in primary, lower and upper secondary education (1).PNG 932 × 1,139; 119 KB
 Student mobility in tertiary education, 2005 (1).PNG 930 × 467; 39 KB
 Tax rate on low wage earners- tax wedge on labour cost, 2006 (%).PNG 677 × 287; 20 KB
 Total catches in all fishing regions(1 000 tonnes live weight).PNG 682 × 695; 77 KB
 Utilisation of milk, EU, 2007(%) (1).PNG 395 × 169; 5 KB
 Agricultural production of crops, 2006.PNG 926 × 1,100; 141 KB
 Relative median at-risk-of-poverty gap, 2006(%).PNG 682 × 327; 21 KB
 Total aquaculture production(1 000 tonnes live weight).PNG 688 × 676; 65 KB
 Unemployment rates by duration, 2006.PNG 915 × 562; 60 KB
 Agricultural output and value added (EUR million).PNG 485 × 371; 20 KB
 Breakdown of labour costs, business economy, 2006 (1).PNG 556 × 263; 11 KB
 Expenditure on care for elderly, 2005 (1)(% of GDP).PNG 695 × 344; 24 KB
 Maastricht criterion rates, annual average for 2007.PNG 938 × 544; 41 KB
 Resource productivity (GDP per DMC).PNG 846 × 422; 28 KB
 State aid, 2005.PNG 920 × 615; 62 KB
 20090303130830!GDP per capita at current market prices, 2007.PNG 489 × 209; 7 KB
 Science and technology graduates.PNG 925 × 1,007; 106 KB
 20090304140335!Exchange rates against the euro (1).PNG 901 × 414; 36 KB
 Current account transactions, EU-27 (1).PNG 906 × 489; 35 KB
 Interest rates (%).PNG 680 × 726; 82 KB
 Labour cost growth, EU-27.PNG 918 × 514; 41 KB
 Labour productivity.PNG 681 × 680; 97 KB
 Overweight people, 2003 (1)(% of total population).PNG 679 × 317; 22 KB
 Protected areas for biodiversity, habitats Directive, 2007.PNG 919 × 422; 26 KB
 Acquisition of citizenship and asylum applications(persons).PNG 682 × 695; 90 KB
 Hospital beds (per 100 000 inhabitants).PNG 572 × 623; 35 KB
 Minimum wage and proportion of employees earning the minimum wage.PNG 928 × 814; 102 KB
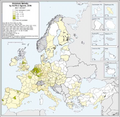
 Total population change, by NUTS 2 regions, average 2001 to 2005.PNG 755 × 871; 519 KB
 Agricultural area by land use, EU (1).PNG 902 × 443; 27 KB
 International trade for services, EU-27 (1).PNG 914 × 430; 24 KB
 Live births and deaths in the EU-27.PNG 468 × 343; 12 KB
 Price indices of agricultural output (nominal), EU-27 (2000=100).PNG 447 × 278; 14 KB
 Production sold in value terms, selected products, EU-27, 2007.PNG 690 × 862; 106 KB
 Volume of inland passenger transport, 2004.PNG 914 × 412; 20 KB
 20090304153653!GDP per capita at current market prices, 2007.PNG 673 × 307; 24 KB
 Burglary 2004.PNG 348 × 659; 25 KB
 Healthy life years at birth, 2005 (1).PNG 931 × 498; 147 KB
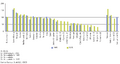
 Net migration (including corrections)(1 000).PNG 677 × 659; 65 KB
 Debt by Maturity, 2007.PNG 771 × 316; 24 KB
 Information technology expenditure, 2006 (1) (% of GDP).PNG 556 × 226; 8 KB
 20090205140359!Total financing for developing countries, EU-15.PNG 904 × 588; 66 KB
 20090303101401!Waste treatment (non-hazardous), recovery, 2006.PNG 1,023 × 1,023; 68 KB
 20090304151336!GDP per capita at current market prices, 2007.PNG 679 × 341; 28 KB
 Employment rate by gender, 2006.PNG 911 × 627; 78 KB
 Labour productivity per hour worked.PNG 924 × 496; 40 KB
 Production of cereals, EU-27, 2006 (1).PNG 648 × 421; 21 KB
 Price of fixed telecommunications, 2006.PNG 915 × 540; 49 KB
 Production of cereals (including rice), EU-27, 2007 (%) (1).PNG 395 × 160; 3 KB
 20090203121320!Daily smokers, 2003 (1).PNG 921 × 596; 64 KB
 Index of production, construction, EU-27 (1).PNG 908 × 431; 28 KB
 Population age groups 2004.PNG 343 × 317; 17 KB
 International price competitiveness (real effective exchange rate).PNG 929 × 813; 126 KB
 Trade integration, EU-27.PNG 914 × 512; 33 KB
 Unemployment rate 2004.PNG 365 × 260; 22 KB
 19465n9sddqfzi5g2p61271ag2dfutm.jpg 614 × 313; 35 KB
 20090303122402!Waste treatment (non-hazardous), recovery, 2006.PNG 813 × 753; 58 KB
 Average number of persons per private household, 2005 (1).PNG 922 × 478; 43 KB
 Kdgu8vx7mgeorwl3pfjrn1685mpuwp5.jpg 620 × 327; 38 KB
 Tax rate on low wage earners, tax wedge on labour cost, 2006.PNG 914 × 463; 40 KB
 20090203124054!World population.PNG 581 × 286; 15 KB
 20090217150402!Labour productivity.PNG 930 × 1,144; 164 KB
 Agricultural producer and purchaser prices, EU-27.PNG 902 × 522; 43 KB
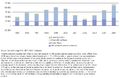
 GDP at current market prices 1998-2007 (EUR 1 000 million).PNG 527 × 618; 27 KB
 Stocks of foreign direct investment in the EU-25, 2004 (1).PNG 728 × 368; 23 KB
 Telecommunications expenditure, 2006.PNG 925 × 442; 37 KB
 20090304125957!Public balance, general government debt.PNG 573 × 543; 24 KB
 Age related dependency ratios(%).PNG 684 × 678; 87 KB
 Thhndwmy40gc7ufzq9acp3y4ir2hb3a.png 912 × 450; 31 KB
 Value added, 2004.PNG 927 × 906; 130 KB
 20090203123905!World population.PNG 581 × 286; 15 KB
 8743qyi7e6gxlwjsallsflj4uphwx4y.jpg 629 × 744; 91 KB
 9n8ih94eckiy7966zlceumx8jqmsp0s.png 888 × 462; 30 KB
 Development of external trade, EU-27 (1) (EUR 1 000 million).PNG 679 × 289; 14 KB
 Hospital beds(per 100 000 inhabitants).PNG 684 × 714; 80 KB
 Human resources in science and technology (1), 2006.PNG 801 × 845; 90 KB
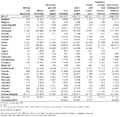
 Minimum wages in EU Member States.PNG 668 × 774; 61 KB
 Relative median at-risk-of-poverty gap, 2005.PNG 913 × 489; 42 KB
 Road fatalities by type of user, EU-25, 2004.PNG 518 × 426; 25 KB
 Total greenhouse gas emissions (1).PNG 916 × 637; 85 KB
 Utilisation of milk, EU, 2005 (1).PNG 640 × 435; 27 KB
 Country of origin for outbound holidays, 2006.PNG 924 × 463; 26 KB
 Government revenue and expenditure, 2007 (1) (% of GDP).PNG 693 × 298; 23 KB
 Main players for external trade (EUR 1 000 million).PNG 669 × 230; 18 KB
 Mean age of women at childbearing (1)(years).PNG 677 × 337; 25 KB
 Old age dependency ratio(%).PNG 669 × 307; 25 KB
 Venture capital investments, expansion and replacement, 2006.PNG 923 × 442; 30 KB
 Water resources.PNG 929 × 946; 121 KB
 20090312094956!Leading tourism indicators.PNG 681 × 743; 104 KB
 Agricultural area by land use, EU (1)(% of land area).PNG 669 × 311; 19 KB
 Air and sea passenger transport.PNG 928 × 853; 70 KB
 EU farmland bird index (1).PNG 914 × 438; 25 KB
 Minimum wage (EUR-month, as of 1 January).PNG 682 × 531; 54 KB
 Mortality 2007.PNG 961 × 1,401; 134 KB
 Motorway density, by NUTS 2 regions, 2006.PNG 926 × 906; 614 KB
 Expenditure components of GDP, EU-27 (EUR 1 000 million).PNG 469 × 180; 6 KB
 Foreign direct investment intensity.PNG 928 × 628; 70 KB
 20090305095125!Taxes and social contributions, 2007 (% of GDP).PNG 678 × 348; 28 KB
 Dispersion of regional employment rates (1).PNG 901 × 613; 65 KB
 Expenditure on pensions, 2005 (1)(% of GDP).PNG 670 × 326; 25 KB
 Tax rate on low wage earners, unemployment trap, 2006.PNG 918 × 496; 53 KB
 Under construction icon-blue.jpg 600 × 500; 29 KB
 20090310145253!Air pollutants, 2006.PNG 692 × 741; 75 KB
 Expenditure on pensions, 2004 (1).PNG 919 × 537; 55 KB
 I1nog0d8eoe1xi0av6l5r17zh92q0ji.png 911 × 498; 36 KB
 Incidence of serious accidents at work, by gender, 2004.PNG 923 × 453; 30 KB
 Innovative enterprises which introduced new or improved products.PNG 928 × 770; 84 KB
 Market share of the incumbent in fixed telecommunications, 2005.PNG 911 × 539; 50 KB
 Offi cial development assistance.PNG 687 × 597; 74 KB
 Perception of safety in selected Urban Audit cities, 2006.PNG 1,318 × 1,637; 124 KB
 Tenure status of households, 2006 (1)(%).PNG 674 × 313; 23 KB
 Wood production (1).PNG 683 × 785; 84 KB
 20090203120638!Overweight people, 2003 (1).PNG 535 × 202; 7 KB
 20090330101306!Perception of safety in selected Urban Audit cities, 2006.PNG 987 × 1,230; 79 KB
 Number of deaths in road traffic accidents, by NUTS 2 regions, 2006.PNG 925 × 906; 652 KB
 Value added, 2005(EUR million).PNG 678 × 619; 72 KB
 Share of goods and services in GDP, 2006.PNG 934 × 999; 92 KB
 Number of enterprises, 2004.PNG 929 × 899; 105 KB
 Stocks of foreign direct investment abroad, EU-25, 2004 (1).PNG 721 × 385; 23 KB
 Causes of death – standardised death rate, EU-27, 2004 (1).PNG 925 × 446; 34 KB
 Gender breakdown of tertiary students, 2005 (1).PNG 933 × 536; 60 KB
 Minimum wage - Synthesis table 1.PNG 1,074 × 680; 70 KB
 Income, EU-27 (1).PNG 911 × 429; 27 KB
 Total fertility rate in the EU-25, 1960–2005.PNG 675 × 389; 14 KB
 20090304154435!GDP per capita at current market prices, 2007.PNG 673 × 307; 24 KB
 20090305093239!Labour productivity.PNG 682 × 708; 99 KB
 Expenditure on labour market policy measures, 2005.PNG 906 × 672; 67 KB
 Total expenditure on social protection.PNG 929 × 862; 122 KB
 20090304152508!GDP per capita at current market prices, 2007.PNG 687 × 311; 25 KB
 Current account, balance by components, 2006.PNG 931 × 740; 67 KB
 Infant mortality.PNG 932 × 965; 119 KB
 Job vacancy rate, 2006.PNG 916 × 482; 31 KB
 Value added by enterprise size class, EU-27, 2004 (1).PNG 921 × 408; 35 KB
 5hvz64m3wrbbe7tyjozbeuch8pqx1or.png 936 × 520; 57 KB
 E5zb8nu71jep0759gpis31b5n5r0pgz.png 867 × 853; 596 KB
 Unemployment rate(%).PNG 683 × 629; 67 KB
 44gzi9do1t8to1b68b98t04lwo3rej7.jpg 628 × 670; 60 KB
 Expenditure components of GDP, EU-27.PNG 683 × 277; 23 KB
 Inland freight transport, 2007.PNG 688 × 759; 86 KB
 Total paper and paperboard production(1 000 tonnes).PNG 682 × 695; 90 KB
 Aggregate replacement ratio, 2006 (1)(%).PNG 684 × 338; 22 KB
 Breakdown of Debt by Debt Holder, 2007.PNG 745 × 285; 19 KB
 GDP per capita at current market prices, (PPS, EU-27=100).PNG 516 × 540; 25 KB
 Comparative price levels.PNG 928 × 943; 152 KB
 20090306135618!Official development assistance.PNG 583 × 514; 27 KB
 3-month money market rates in the euro area, the US and Japan.PNG 924 × 454; 25 KB
 Healthy life years at age 65, 2005 (1) (years).PNG 556 × 225; 8 KB
 Impact of consolidation, 2007.PNG 364 × 273; 14 KB
 Top 30 NUTS 2 regions.PNG 798 × 1,570; 150 KB
 9kkb3v2i5kiripo9tze5s57z4vwmjxw.png 486 × 978; 72 KB
 Annual growth rates for industry(%).PNG 694 × 683; 69 KB
 Average personnel costs, 2005(EUR 1 000 per employee).PNG 679 × 622; 61 KB
 Total expenditure on social protection per capita, 2005 (1)(PPS).PNG 668 × 331; 24 KB
 Tourism intensity, 2006.PNG 899 × 409; 28 KB
 Central bank interest rates, official lending rates for loans.PNG 903 × 412; 22 KB
 Nights spent by non-residents in hotels, 2006.PNG 893 × 396; 30 KB
 Place of Internet use by individuals, 2006.PNG 925 × 751; 59 KB
 Population change 1999–2004.PNG 350 × 321; 20 KB
 20090305093716!Expenditure components of GDP, EU-27.PNG 680 × 328; 27 KB
 Fishing fleet, 2006 (1).PNG 918 × 580; 71 KB
 GDP at current market prices - (EUR 1 000 million).PNG 666 × 275; 14 KB
 Healthy life years at birth.PNG 936 × 885; 80 KB
 N9rjacmz304gsirs7q96tcwh9p945ht.png 535 × 202; 7 KB
 Population connected to urban wastewater treatment, 2003 (1).PNG 1,071 × 494; 31 KB
 Production of cereals, 2006.PNG 912 × 466; 30 KB
 Catches by fishing region, EU-27, 2005.PNG 736 × 602; 55 KB
 Divorces(per 1 000 persons).PNG 682 × 641; 62 KB
 Producer price indices, total industry.PNG 1,034 × 556; 34 KB
 20090304151634!GDP per capita at current market prices, 2007.PNG 685 × 291; 24 KB
 Agricultural holdings with another gainful activity, 2005.PNG 916 × 478; 41 KB
 Air and sea passenger transport (1).PNG 683 × 680; 63 KB
 Life expectancy at birth(years).PNG 691 × 641; 85 KB
 Daily smokers, 2003 (1).PNG 535 × 202; 7 KB
 Rail passenger transport, 2006 (1)(passenger-km per inhabitant).PNG 667 × 295; 23 KB
 Agricultural output and value added, EU-27.PNG 899 × 404; 29 KB
 EU-27 credits for services (%).PNG 665 × 491; 36 KB
 Unemployment rates by duration, 2007(%).PNG 676 × 279; 20 KB
 Air freight transport, 2005.PNG 905 × 498; 26 KB
 Fertility 2007.PNG 983 × 1,435; 156 KB
 Index of turnover, selected service activities, EU-27 (1).PNG 901 × 785; 59 KB
 Railway lines density, by NUTS 2 regions, 2006.PNG 922 × 905; 609 KB
 Agricultural holdings with another gainful activity, 2007 (1)(%).PNG 673 × 310; 20 KB
 Forest trees damaged by defoliation, 2006 (1)(%).PNG 679 × 310; 18 KB
 20090330091444!Perception of safety in selected Urban Audit cities, 2006.PNG 987 × 1,230; 79 KB
 Eco-label awards, 2006.PNG 908 × 523; 48 KB
 International investment position reporters.PNG 924 × 388; 13 KB
 Volume of inland passenger transport (1).PNG 931 × 972; 116 KB
 20090306133233!Foreign direct investment (1).PNG 865 × 1,173; 168 KB
 G7xc9cdmi2846nm2qmh61amlo3azku8.jpg 629 × 668; 73 KB
 Groundwater and surface water abstraction.PNG 687 × 638; 45 KB
 Infant mortality (1).PNG 915 × 511; 42 KB
 Inflation rate.PNG 905 × 480; 41 KB
 20090304153503!GDP per capita at current market prices, 2007.PNG 716 × 336; 25 KB
 20090305094116!Distribution of income, 2007 (% share of GDP).PNG 706 × 361; 30 KB
 At-risk-of-poverty rate, 2006(%).PNG 681 × 336; 28 KB
 Comparison of producer and consumer prices.PNG 722 × 525; 37 KB
 Consumption expenditure of households on transport, 2005.PNG 920 × 447; 37 KB
 Crude birth rate(‰).PNG 688 × 336; 43 KB
 Greenhouse gas emissions.PNG 926 × 977; 122 KB
 Gross operating rate for industrial activities, EU-27, 2004.PNG 918 × 615; 67 KB
 I28rcd5nsio024w834k86s3zrqqf5h5.png 927 × 766; 114 KB
 Life expectancy at birth, 2006 (1)(years).PNG 692 × 300; 23 KB
 Lifelong learning (1).PNG 935 × 955; 110 KB
 Mortality.png 656 × 787; 70 KB
 Official development assistance per capita.PNG 928 × 743; 106 KB
 Real GDP growth, EU-27.PNG 906 × 485; 38 KB
 Social protection receipts, EU-27, 2005 (1)(% of total receipts).PNG 520 × 289; 15 KB
 Top 15 airports, passengers carried, EU-27, 2006.PNG 925 × 450; 23 KB
 Tourism destinations, 2006.PNG 920 × 443; 26 KB
 Earnings in industry and services.PNG 929 × 769; 112 KB
 Emissions of carbon dioxide, 2006 (kg per capita).PNG 685 × 229; 13 KB
 Energy intensity of the economy, 2006(kgoe per EUR 1 000 of GDP).PNG 668 × 293; 18 KB
 Evolution of fatalities in air accidents, EU-25, 1996-2005.PNG 773 × 565; 39 KB
 Foreign direct investment flows, EU-25.PNG 919 × 404; 23 KB
 Internet access of households.PNG 922 × 505; 43 KB
 Main players for external trade, 2007 (EUR 1 000 million).PNG 662 × 303; 12 KB
 Pigs, by NUTS 2 regions, 2005 Pigs per hectare of total area.PNG 829 × 952; 847 KB
 Sites having implemented EMAS or ISO 14001, 2006.PNG 918 × 538; 54 KB
 Total catches in all fishing regions.PNG 930 × 1,024; 128 KB
 Air pollutants, EU-27.PNG 866 × 1,079; 159 KB
 Employment rates for selected population groups(%).PNG 684 × 662; 66 KB
 Fishing fl eet, 2007 (1).PNG 685 × 314; 28 KB
 GDP per capita at current market prices, 2006.PNG 918 × 539; 53 KB
 Official development assistance, EU-15 (% share of GNI).PNG 563 × 221; 5 KB
 PhD students (ISCED level 6), 2005.PNG 929 × 939; 115 KB
 Population by age class, EU-27(1997=100).PNG 672 × 282; 18 KB
 Public balance.PNG 927 × 483; 42 KB
 Public expenditure on labour market policy interventions, 2005.PNG 918 × 525; 38 KB
 Rail passenger transport, 2005.PNG 914 × 472; 28 KB
 Sawnwood production per capita, 2005.PNG 911 × 414; 26 KB
 Structural employment indicators (Top 10).PNG 349 × 265; 20 KB
 T5npbr9ngfmr773fttabaxo8l9r3g6q.jpg 622 × 334; 32 KB
 Unemployment rates, EU-27.PNG 929 × 370; 54 KB
 Voter turnout(%).PNG 664 × 360; 41 KB
 20090304141704!Interest rates (%).PNG 581 × 620; 31 KB
 Debt by Sub-sector, 2007.PNG 760 × 288; 22 KB
 Enterprise birth rates in the business economy, 2004.PNG 918 × 571; 53 KB
 Graduates from tertiary education, by field of education, 2005 (1).PNG 933 × 1,005; 96 KB
 Greenhouse gas emissions, EU-27 (1).PNG 900 × 575; 53 KB
 Hospital discharges of in-patients by diagnosis, 2005.PNG 934 × 1,004; 104 KB
 Motorway density.PNG 926 × 906; 614 KB
 Net imports of primary energy(million tonnes of oil equivalent).PNG 684 × 644; 80 KB
 Resistance to antibiotics, 2005 (1).PNG 918 × 528; 49 KB
 Resource productivity, EU-15 (1995=100).PNG 673 × 277; 13 KB
 Share of temporary employees, 2006.PNG 913 × 453; 29 KB
 Top 30 NUTS 2 regions with highest number of air passengers, 2006.PNG 798 × 1,570; 150 KB
 Youth education attainment level, 2006.PNG 923 × 411; 37 KB
 20090305084940!GDP at current market prices (EUR 1 000 million).PNG 672 × 741; 82 KB
 Bed places in hotels and similar establishments, EU-27.PNG 885 × 308; 20 KB
 Contribution to intra EU-27 trade in services, 2006.PNG 668 × 538; 34 KB
 Euro27Population.JPG 548 × 461; 89 KB
 Final energy consumption, EU-27 (1)(1996=100).PNG 680 × 316; 24 KB
 GDP at current market prices (EUR 1 000 million).PNG 683 × 726; 84 KB
 General government expenditure by COFOG function, 2005 (1).PNG 922 × 550; 46 KB
 Gross domestic expenditure on R&D.PNG 927 × 1,062; 144 KB
 Gross value added at basic prices.PNG 930 × 1,005; 141 KB
 Hospital beds, 2005.PNG 918 × 498; 33 KB
 Proportion of innovative enterprises.PNG 925 × 441; 32 KB
 St3v4o6l96o3bzv5iw3puz4uy0zs7a0.png 922 × 423; 36 KB
 Tax rate on low wage earners tax wedge on labour cost, 2006.PNG 556 × 226; 8 KB
 Total public expenditure on education, 2005 (1)(% of GDP).PNG 678 × 339; 25 KB
 Tourism receipts and expenditure.PNG 683 × 733; 87 KB
 4uqnokfi38zg8z5vn33qc9j0fs900x5.jpg 618 × 326; 37 KB
 Air pollutants, 2006.PNG 692 × 741; 75 KB
 Debt by Issuing Currency, 2007.PNG 754 × 262; 19 KB
 Energy consumption by transport mode, EU-27 (1)(1996=100).PNG 667 × 294; 17 KB
 Expenditure components of GDP, EU-27, 2006.PNG 765 × 412; 24 KB
 Foreign direct investment stocks, EU-25.PNG 922 × 403; 22 KB
 GDP at current market prices.PNG 900 × 411; 19 KB
 Generation of waste by origin, EU-27, 2004 (1).PNG 917 × 414; 17 KB
 Industrial value added by enterprise size class, EU-27, 2004 (1).PNG 917 × 465; 45 KB
 Number of persons employed, 2004.PNG 928 × 903; 111 KB
 Proportion of research and development personnel by sector, 2005.PNG 912 × 743; 83 KB
 Protected areas for biodiversity - habitats Directive, 2007 (1).PNG 674 × 294; 17 KB
 Rail accidents by type of victim and accident, EU-25, 2005.PNG 928 × 335; 27 KB
 Students in tertiary education, 2006 (1).PNG 681 × 779; 86 KB
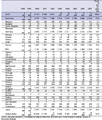
 20090203122618!Healthcare indicators.PNG 937 × 1,216; 157 KB
 20090309122910!Breakdown of Debt by Debt Holder, 2007.PNG 745 × 285; 19 KB
 Area by land use, 2006.PNG 927 × 912; 121 KB
 Biodiversity.PNG 930 × 980; 117 KB
 Crude rates of population change 2007.PNG 974 × 1,426; 148 KB
 Emissions of carbon dioxide, 2005.PNG 916 × 427; 30 KB
 Gross domestic expenditure on R&D (GERD) (% of GDP).PNG 794 × 864; 84 KB
 Gross national savings.PNG 915 × 464; 37 KB
 H043mbghs3n1vr8l268a0ioefadpepp.png 613 × 620; 31 KB
 Kumu.PNG 300 × 300; 205 KB
 Labour costs, 2005.PNG 918 × 479; 36 KB
 Municipal waste, EU-27.PNG 815 × 410; 16 KB
 Public procurement.PNG 918 × 557; 52 KB
 Top 30 NUTS 2 regions with highest volume of air freight in 2006.PNG 800 × 1,270; 124 KB
 Total expenditure on social protection(% of GDP).PNG 692 × 617; 73 KB
 World population(million).PNG 687 × 323; 43 KB
 20090304153621!GDP per capita at current market prices, 2007.PNG 673 × 307; 24 KB
 20090312161317!Environmental and agricultural indicators, 2005.PNG 926 × 1,034; 128 KB
 Dispersion of employment and unemployment rates, NUTS level 2.PNG 693 × 716; 62 KB
 Earnings in industry and services, 2005.PNG 913 × 539; 44 KB
 Immigration by age, 2006 (1)(%).PNG 664 × 321; 21 KB
 Offi cial development assistance, EU-15(% share of GNI).PNG 676 × 227; 13 KB
 Paper and paperboard production per capita, 2005 (1).PNG 915 × 390; 23 KB
 Production and domestic output price indices for industry, EU-27.PNG 928 × 415; 27 KB

.PNG)
,_2006_(per_100_000_inhabitants).PNG)

.PNG)
_(%25_of_male_female_population).PNG)
.PNG)

(million).PNG)
(%25,_based_on_acid_equivalents).PNG)

_(fi_nal_consumption_by_private_households_including_indirect_taxes,_EU-27%3D100).PNG)
.PNG)


(years).PNG)
,_EU-27_(1)(1_000).PNG)
.PNG)
.PNG)
.PNG)
.PNG)
_(1).PNG)

.PNG)
.PNG)

.PNG)
.PNG)
(%25_of_GDP).PNG)

_in_total_nonfinancial_business_economy_employment,_by_NUTS_2_regions,_2005_Percentage.PNG)
.PNG)

(%25_of_sectoral_total).PNG)

.PNG)
_(1998%3D100,_based_on_the_number_of_serious_accidents_per_100_000_persons_employed).PNG)

(%25_of_sectoral_total).PNG)
.PNG)
.PNG)
(1_000).PNG)
.PNG)


(%25_of_total_population).PNG)
.PNG)

.PNG)
.PNG)
.PNG)
.PNG)

_(%25_of_enterprises).PNG)

_(%25_of_male_female_population).PNG)
.PNG)
.PNG)
.PNG)

,_EU-27_(2000%3D100).PNG)


.PNG)
_in_terms_of_unemployment,_at_NUTS_level_2.PNG)
(1_000).PNG)
,_2007_(1)_(per_million_inhabitants).PNG)
(%25_of_total,_based_on_tonnes).PNG)
,_2006_(1)_son.PNG)
.PNG)
_(%25_of_GDP).PNG)

.PNG)

,_recovery,_2006.PNG)


.PNG)
.PNG)
.PNG)
_(1_000_m%C2%B3_per_inhabitant).PNG)


(2000%3D100).PNG)
.PNG)
.PNG)
(%25_of_total_number_of_tertiary_students).PNG)
(2000%3D100).PNG)
.PNG)
(%25_of_male-female_population_aged_15_years_and_over).PNG)

.PNG)
.PNG)


,_recovery,_2006.PNG)
.PNG)
_(%25_share_of_total_gross_value_added).PNG)
.PNG)


.PNG)
,_EU-27_and_Norway,_2005_Percentage_of_total_non-financial_business_economy_employment_of_the_region_and_the_median_and_average_share_of_all_regions_(%25).PNG)
.PNG)
.PNG)

_(base_year%3D100;_for_EU-27,_Cyprus_and_Malta,_1990%3D100).png)

_(%25_of_enterprises).PNG)
.PNG)
_(%25_of_total_credits).PNG)
_(EUR).PNG)
(EUR_1_000_million).PNG)


_(EUR_1_000_million).PNG)
.PNG)
,_2006.PNG)


.PNG)
.PNG)

_(%25_of_GDP).PNG)
(years).PNG)
.PNG)
_by_level_of_educational(%25).PNG)

(%25).PNG)

(%25_of_total).PNG)


(%25_of_land_area).PNG)

.PNG)
.PNG)


.PNG)

.PNG)
_(aggregated_index_of_population_estimates_of_a_selected_group_of_breeding_bird_species_dependent_on.PNG)
.PNG)
(%25_of_GDP).PNG)
(%25_of_respective_gender_aged_18-59_who_are_living_in_households_where_no-one_works).PNG)


.PNG)
.PNG)


(%25).PNG)
_1996-2006.PNG)
_(1)(%25_of_the_total_population).PNG)
(average_number_of_pupils_per_teacher).PNG)

.PNG)


.PNG)
_(%25_of_gross_national_disposable_income).PNG)

(%25).PNG)

.PNG)
(%25).PNG)
.PNG)
.PNG)
(2000%3D100).PNG)

.PNG)
(%25).PNG)


.PNG)


(%25_of_the_population_aged_25_to_64_participating_in_education_and_training).PNG)
.PNG)
(%25_of_extra_EU-27_FDI).PNG)
.PNG)


,_by_NUTS_2_regions,_average_2001_to_2005_Per_1_000_inhabitants.PNG)
_(%25,_based_on_data_in_million_tonnes_CO2_equivalent).png)
.PNG)
.PNG)
.PNG)


.PNG)

(%25).PNG)
.PNG)
.PNG)
_(%25_of_total_researchers).PNG)
.PNG)


.PNG)


.PNG)
.PNG)

(%25_of_total_immigrants).PNG)
(PPS).PNG)


.PNG)
.PNG)

(%25_of_respective_age_group_living_in_households_where_no-one_works).PNG)


.PNG)
.PNG)
.PNG)

_(%25_of_gross_household_disposable_income).PNG)

.PNG)

(%25_of_total_population).PNG)


.PNG)

.PNG)


.PNG)
.PNG)

(passenger-km_per_inhabitant).PNG)
_(%25_of_GDP).PNG)

.PNG)
.PNG)
.PNG)


.PNG)
.PNG)
_by_age_bigger_than_64-15_to_64.PNG)


(%25).PNG)
(%25).PNG)
,_2006_(1).PNG)


.PNG)


_(EUR_1_000_million).PNG)
.PNG)
.PNG)
,EU-27_and_Norway,_by_NUTS_2_regions,_2005.PNG)


,_EU-27_(number_of_applications).PNG)
_(1_EUR_%3D%E2%80%A6_national_currency).PNG)
.PNG)
(%25).PNG)
.PNG)

,_2006_(1).PNG)

.PNG)
.PNG)

.PNG)
_(%25_share_of_total_labour_costs).PNG)
(%25_of_total,_based_on_tonnes).PNG)


.PNG)
,by_NUTS_2_regions,_2005.PNG)
.PNG)
.PNG)


(years).PNG)
.PNG)


(%25_of_total_receipts).PNG)


(persons).PNG)
(%25_of_industrial_and_construction_value_added_and_employment).PNG)

.PNG)


.PNG)


.PNG)
_(%25_of_total_researchers).PNG)

1997-2007.PNG)
,_2006_and_2007.PNG)
.PNG)
.PNG)

.PNG)


,_2005.PNG)
.PNG)
.PNG)
.PNG)


(%25_of_total).PNG)


.PNG)

.PNG)
.PNG)
.PNG)
(%25_of_male-female_population_aged_15-24).PNG)
(coeffi_cient_of_variation_of_employment_rates_(of_the_age_group_15-64)_across_regions_(NUTS_2_level)).PNG)
,_2006_(1)_(EUR).PNG)

.PNG)
.PNG)
.PNG)


.PNG)
(%25_of_GDP).PNG)
.PNG)


.PNG)

.PNG)

(%25_of_net_imports_in_gross_inland_consumption_and_bunkers,_based_on_tonnes_of_oil_equivalent).PNG)

(1996%3D100).PNG)
.PNG)

.PNG)

.PNG)


.PNG)
,_2006_(1)_(EUR).PNG)
_and_natural_population_change,_2002-2007_(1)(1_000).PNG)
(%25_of_sectoral_total).PNG)


(%25_of_GDP).PNG)


_-_standardised_death_rate,_2006_(1)(per_100_000_inhabitants).PNG)


(1996%3D100).PNG)


.PNG)
.PNG)
.PNG)
_in_non-financial_business_economy_employment,_EU-27_and_Norway,_2005_Percentage_of_regional_total.PNG)


.PNG)
.PNG)

.PNG)


_(%25_of_GDP).PNG)

_(%25_share_of_total_gross_value_added).PNG)


.PNG)

(kg_of_active_ingredient_per_hectare_of_utilised_agricultural_area).PNG)
(%25).PNG)

.PNG)
(at_1_January,_million).PNG)
.PNG)
.PNG)

.PNG)


,_by_NUTS_2_regions,_2006_Percentage_of_the_labour_force.PNG)
(%25).PNG)
,_2006-2007.PNG)
(%25_of_total_generation).PNG)
.PNG)
,_share_of_largest_regions_in_total_employment,_EU-27_and_Norway,_2005_Percentage_of_sectoral_total.PNG)

.PNG)

.PNG)
_(%25_share_of_total_gross_value_added).PNG)
.PNG)
).PNG)
.PNG)
.PNG)
,_2007.PNG)
_(%25_of_GDP).PNG)
_(%25_of_GDP).PNG)
,_EU-27,_2007_(%25)_(1).PNG)
(%25).PNG)
.PNG)
.PNG)
.PNG)
.PNG)
.PNG)
).PNG)
(%25).PNG)
.PNG)
.PNG)
_(years).PNG)
,_EU-27(1995%3D100,_based_on_tonnes_of_oil_equivalent).PNG)
_(%25).PNG)
.PNG)
.PNG)
_(%25_of_total_credits).PNG)
.PNG)
,_EU-27_(2000%3D100).PNG)
.PNG)
.PNG)
_(%25).PNG)
.PNG)
(average_annual_change,_million).PNG)
.PNG)
.PNG)