Gallery of new files
This special page shows the last uploaded files.
 Final energy consumption in the residential sector by fuel, EU, 2022 .png Mellaga
17:16, 31 May 2024
944 × 518; 35 KB
 Visual Figure 1 Final energy consumption in the residential sector by fuel, EU, 2022 .png Mellaga
16:52, 31 May 2024
943 × 519; 40 KB
 Investments for environmental protection by institutional sector, EU, 2006–2023 (€ billion and % of total investments).png Remonis
16:48, 31 May 2024
1,000 × 707; 62 KB
 Environmental protection investments of general government and NPISH by environmental domain, EU, 2006-2023 (€ billion).png Remonis
16:48, 31 May 2024
1,000 × 567; 38 KB
 Environmental protection investments of corporations by environmental domain, EU, 2006-2023 (€ billion).png Remonis
16:47, 31 May 2024
1,000 × 662; 41 KB
 Figure 1 Final energy consumption in the residential sector by fuel, EU, 2022 .png Mellaga
16:47, 31 May 2024
943 × 519; 40 KB
 Environmental protection investments of corporations other than specialist producers by environmental domain, EU, 2023.png Remonis
16:43, 31 May 2024
1,000 × 483; 32 KB
 Investments for environmental protection by environmental domains, EU, 2023 (€ billion).png Remonis
16:42, 31 May 2024
1,000 × 662; 38 KB
 Environmental protection investments of corporations, by type of producer and by economic activity, EU, 2006-2023 (€ billion).png Remonis
16:42, 31 May 2024
1,103 × 840; 59 KB
 Environmental protection investments and total investments of overall economy, EU, 2006-2023 (2006 = 100; percentage).png Remonis
16:41, 31 May 2024
1,001 × 608; 43 KB
 Visual Final energy consumption in the residential sector by fuel, EU, 2022 .png Mellaga
15:44, 31 May 2024
943 × 519; 40 KB

 The 25 NUTS 1 regions with the highest share of women in HRST occupation, 2023.png Challva
15:18, 31 May 2024
1,501 × 980; 92 KB
 Distribution of HRST by occupation by age group, 2023.png Challva
15:15, 31 May 2024
1,500 × 1,325; 91 KB
 The 25 NUTS 2 regions with the highest shares of employment in HRST occupations in the active population, 2023.png Challva
15:13, 31 May 2024
1,500 × 1,008; 86 KB


 Figure 3 Distribution of HRST by occupation by age group, 2023.png Challva
14:22, 31 May 2024
1,500 × 1,325; 92 KB
 Table 1 Employment statistics on women aged 25-64 employed in science and technology (HRST by occupation), in 2023.png Challva
14:19, 31 May 2024
1,788 × 1,461; 655 KB
 Figure 2 The 25 NUTS 2 regions with the highest shares of employment in HRST occupations in the active population, 2023.png Challva
14:18, 31 May 2024
1,500 × 970; 83 KB

 T3Nights spent in tourist accommodation establishments, peak and low month,2023.png Maphoto
11:06, 31 May 2024
570 × 849; 57 KB
 Euro area annual inflation and its main components, 2024, May 2023 and December 2023 May 2024 (estimated).png Santosv
11:05, 31 May 2024
758 × 410; 25 KB
 Euro area annual inflation and its main components, May 2022 - May 2024 (estimated).png Santosv
11:04, 31 May 2024
806 × 501; 37 KB
 Euro area annual inflation and its main components, May 2014 - May 2024 (estimated).png Santosv
11:03, 31 May 2024
829 × 459; 38 KB
 Generation of waste, by hazardousness, EU, 2004-2020.png N00coqda
16:25, 30 May 2024
1,251 × 867; 40 KB

 Raw material consumption, by material, EU, 2000-2022 (billion tonnes).png N00coqda
16:25, 30 May 2024
1,250 × 906; 78 KB
 Gross value added in the environmental goods and services sector, EU, 2000-2021.png N00coqda
16:25, 30 May 2024
1,251 × 910; 57 KB
 Consumption footprint, by country, 2017 and 2022.png N00coqda
16:25, 30 May 2024
1,250 × 867; 104 KB


 Raw material consumption, by country, 2017 and 2022 (tonnes per inhabitant).png N00coqda
16:24, 30 May 2024
1,251 × 934; 100 KB

 Gross value added in the environmental goods and services sector evaluation 2024.png N00coqda
16:24, 30 May 2024
175 × 362; 9 KB
 Gross value added in the environmental goods and services sector, by country, 2016 and 2021.png N00coqda
16:24, 30 May 2024
1,250 × 1,003; 108 KB


 Consumption of hazardous chemicals, EU, 2004-2022.png N00coqda
16:24, 30 May 2024
1,250 × 866; 50 KB


 Circular material use rate, by country, 2017 and 2022.png N00coqda
16:24, 30 May 2024
1,250 × 875; 77 KB
 ENPE24 Median equivalised annual net income, 2012-2022 (€ per capita) .png EXT-K-Utvik
16:22, 30 May 2024
925 × 358; 26 KB
 F1Monthly arrivals and nights spent in tourist accommodation, EU, 2023.png Maphoto
16:17, 30 May 2024
1,038 × 613; 37 KB
 F4Monthly nights spent in tourist accommodation, selected countries, 2023.png Maphoto
16:17, 30 May 2024
1,086 × 614; 47 KB
 F3bMonthly nights spent in tourist accommodation, 2023.png Maphoto
16:17, 30 May 2024
1,000 × 600; 63 KB
 F6Monthly nights spent in tourist accommodation, by origin of the guest, EU, 2023.png Maphoto
16:17, 30 May 2024
1,162 × 743; 47 KB
 F5Monthly nights spent in tourist accommodation, by type of accommodation, EU, 2023.png Maphoto
16:17, 30 May 2024
1,230 × 712; 46 KB
 T5 Nights spent in tourist accommodation establishments by origin of the guest and quarter, 2023 (%).png Demunch
15:50, 30 May 2024
656 × 847; 281 KB
 T4 Nights spent in tourist accommodation establishments by type of accommodation and quarter, 2023 (%).png Demunch
15:50, 30 May 2024
899 × 855; 362 KB
 T3 Nights spent in tourist accommodation establishments, peak and bottom month, 2023.png Demunch
15:50, 30 May 2024
586 × 832; 268 KB
 T2 Nights spent in tourist accommodation establishments, share of busiest and slowest months of the year, 2023 (%).png Demunch
15:50, 30 May 2024
733 × 874; 332 KB
 T1 Nights spent in tourist accommodation establishments, distribution per month, 2023.png Demunch
15:50, 30 May 2024
881 × 852; 472 KB
- Monthly nights spent in tourist accommodation, by type of accommodation, EU, 2023v2.xlsx Maphoto
15:31, 30 May 2024
; 14 KB
- Monthly nights spent in tourist accommodation, by type of accommodation, EU, 2023 Interactive.xlsx Maphoto
15:23, 30 May 2024
; 14 KB
 T2Price level indices for GDP and AIC , 2021 (EU=100).png Maphoto
13:53, 30 May 2024
492 × 665; 29 KB

 F4 Monthly nights spent in tourist accommodation, selected countries, 2023 (share in the entire year).png Demunch
13:31, 30 May 2024
1,001 × 619; 46 KB
 F3c Monthly nights spent in tourist accommodation, 2023, seasonal deviation.png Demunch
13:31, 30 May 2024
1,001 × 601; 56 KB
 F3b Monthly nights spent in tourist accommodation, 2023, share of the two busiest months.png Demunch
13:31, 30 May 2024
1,001 × 599; 63 KB
 F3a Monthly nights spent in tourist accommodation, 2023, Gini coefficient.png Demunch
13:31, 30 May 2024
1,001 × 600; 56 KB
 F2 Seasonality in nights spent, EU, 2023 Lorenz curve and Gini coefficient.png Demunch
13:31, 30 May 2024
1,001 × 612; 42 KB
 F1 Monthly arrivals and nights spent in tourist accommodation, EU, 2023 (share in the entire year).png Demunch
13:31, 30 May 2024
1,001 × 616; 37 KB
 F6 Monthly nights spent in tourist accommodation, by origin of the guest, EU, 2023 (share in the entire year).png Demunch
13:31, 30 May 2024
1,000 × 619; 44 KB
 F5 Monthly nights spent in tourist accommodation, by type of accommodation, EU, 2023 (share in the entire year).png Demunch
13:31, 30 May 2024
1,000 × 615; 43 KB
 Fig4d EU final services by BEC items, partner extra-EU, imports-2023 n.PNG Savovil
13:18, 30 May 2024
681 × 614; 42 KB
 Fig4c EU final services by BEC items, partner extra-EU, exports-2023 n.PNG Savovil
13:18, 30 May 2024
684 × 616; 42 KB
 Fig4b EU intermediate services by BEC items, partner extra-EU, imports-2023 n.PNG Savovil
13:18, 30 May 2024
673 × 610; 46 KB
 Fig4a EU intermediate services by BEC items, partner extra-EU, exports-2023 n.PNG Savovil
13:17, 30 May 2024
682 × 607; 48 KB


 ENPE24 Gas prices for households, 2012-2022 (€ per gigajoule).png EXT-K-Utvik
10:47, 30 May 2024
1,010 × 625; 42 KB
 Youth unemployment rates, EU and EA, seasonally adjusted, January 2011 - April 2024 02-10-2023.png Cholane
10:28, 30 May 2024
1,222 × 763; 52 KB
 Unemployment rates, EU and EA, seasonally adjusted, January 2011 - April 2024 02-10-2023 v2.png Cholane
10:27, 30 May 2024
991 × 631; 38 KB
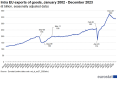 Intra EU exports of goods, January 2002 - December 2023.png Roodhan
09:36, 30 May 2024
1,499 × 1,075; 295 KB
 Registered unemployed refugees from Ukraine by age and sex (in thousands) 30-05-2024 v2.png Cholane
09:03, 30 May 2024
2,137 × 1,528; 152 KB
 Registered unemployed refugees from Ukraine per month (in thousands) 30-05-2024.png Cholane
09:03, 30 May 2024
1,205 × 1,467; 132 KB
 Persons at risk of poverty or social exclusion, EU, 2015-2022 (million persons).png Nhametma
00:23, 30 May 2024
1,419 × 584; 61 KB
 Long-term unemployment rate, by country, 2018 and 2023.png N00coqda
22:19, 29 May 2024
1,250 × 922; 87 KB

 Investment share of GDP, by institutional sector, EU, 2002-2023.png N00coqda
22:18, 29 May 2024
1,251 × 867; 54 KB
 Young people neither in employment nor in education and training (NEET), by country, 2018 and 2023.png N00coqda
22:18, 29 May 2024
1,250 × 956; 104 KB

 Young people neither in employment nor in education and training (NEET) evaluation 2024.png N00coqda
22:18, 29 May 2024
175 × 361; 10 KB
 Young people neither in employment nor in education and training (NEET), by sex, EU, 2009-2023.png N00coqda
22:18, 29 May 2024
1,251 × 902; 61 KB


.png)
.png)
.png)


.png)
.png)
.png)


,_in_2023.png)


.png)
.png)
.png)


.png)


.png)


.png)
.png)

.png)

.png)
.png)
.png)


.png)
.png)
.png)


.png)

,_seasonally_adjusted,_January_2011_-_April_2024_02-10-2023.png)


_30-05-2024_v2.png)
_30-05-2024.png)


,_by_country,_2018_and_2023.png)

_evaluation_2024.png)
,_by_sex,_EU,_2009-2023.png)

_.png)
.png)