Most linked-to files
Showing below up to 500 results in range #1 to #500.
View (previous 500 | next 500) (20 | 50 | 100 | 250 | 500)


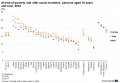
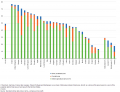
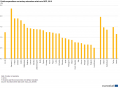
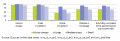
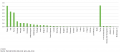
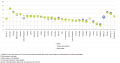
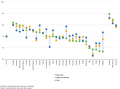
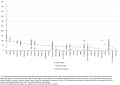
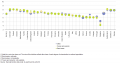
 Relative increases from 1960 of the all-countries average of the median age (in yellow) and its logistic curve (in blue).PNG Used on 44 pages
854 × 534; 73 KB
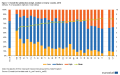
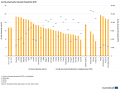
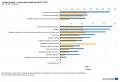
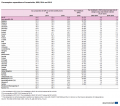
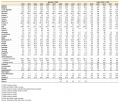
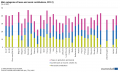
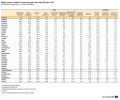
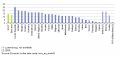
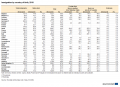
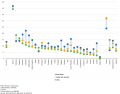
 Persons in employment by occupation and socio-economic group, aged 20-64, EU-27, 2019 (% of total employment).png Used on 41 pages
1,553 × 512; 149 KB

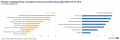
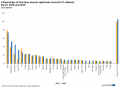
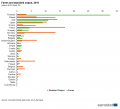
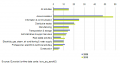
 Agricultural exports and imports by product categories, EU-27, 2019 (EUR million) FP20.png Used on 21 pages
1,024 × 1,214; 89 KB
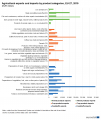
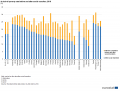
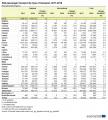
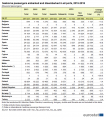
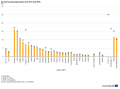
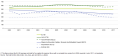
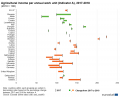 Agricultural income per annual work unit (Indicator A), 2017-2018 (2010 = 100) FP20.png Used on 21 pages
1,000 × 808; 45 KB
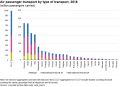 Air passenger transport by type of transport, 2018 (million passengers carried).png Used on 21 pages
884 × 644; 40 KB
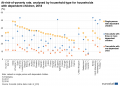 At-risk-of-poverty rate, analysed by household type for households with dependent children, 2018 (%) SILC20.png Used on 21 pages
1,001 × 717; 84 KB
 At-risk-of-poverty rate, analysed by household type for households without dependent children, 2018 (%) SILC20.png Used on 21 pages
1,005 × 765; 46 KB
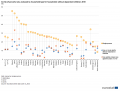
 At-risk-of-poverty rate after social transfers, persons aged 16 years and over, 2018 (%) SILC20.png Used on 21 pages
1,001 × 694; 63 KB
 At-risk-of-poverty rate after social transfers by most frequent activity status, persons aged 18 years or over, 2018 (%) SILC20.png Used on 21 pages
1,023 × 822; 56 KB
 At-risk-of-poverty rate before and after social transfers, 2018 (%) SILC20.png Used on 21 pages
1,005 × 765; 63 KB
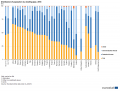
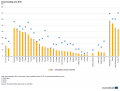
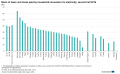
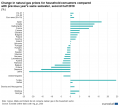
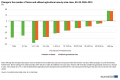
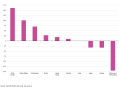
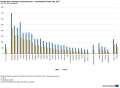
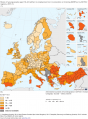
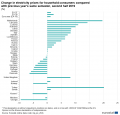 Change in electricity prices for household consumers compared with previous year, same semester, second half 2019.png Used on 21 pages
996 × 957; 69 KB
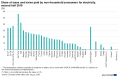
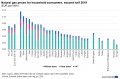
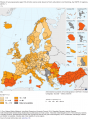
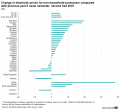 Change in electricity prices for non-household consumers compared with previous year, same semester, second half 2019.png Used on 21 pages
1,012 × 930; 67 KB
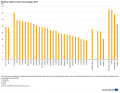
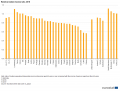
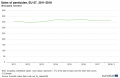
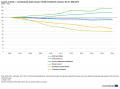
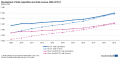
 Development of electricity prices for household consumers, 2008-2019 (EUR per kWh).png Used on 21 pages
1,575 × 996; 100 KB
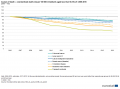
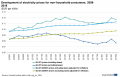 Development of electricity prices for non-household consumers, 2008-2019 (EUR per kWh).png Used on 21 pages
1,037 × 664; 62 KB

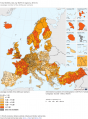
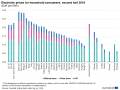 Electricity prices for household consumers, second half 2019 (EUR per kWh).png Used on 21 pages
1,001 × 753; 93 KB
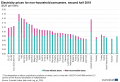 Electricity prices for non-household consumers, second half 2019 (EUR per kWh).png Used on 21 pages
1,003 × 684; 86 KB
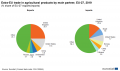 Extra-EU trade in agricultural products by main partner, EU-27, 2019 (% share of EU-27 exports imports) FP20.png Used on 21 pages
1,025 × 604; 39 KB
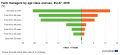

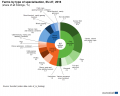 Farms by type of specialisation, EU-27, 2016 (share of all holdings, %) FP20.png Used on 21 pages
1,024 × 822; 63 KB
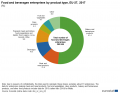 Food and beverages enterprises by product type, EU-27, 2017 (%) FP20.png Used on 21 pages
1,001 × 774; 47 KB
 Housing cost overburden rate, analysed by tenure status, 2018 (%) SILC20.png Used on 21 pages
1,026 × 837; 52 KB
 Inequality of income distribution — income quintile share ratio, 2018 SILC20.png Used on 21 pages
1,000 × 694; 79 KB
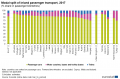 Modal split of inland passenger transport, 2017 (% share in passenger-kilometres).png Used on 21 pages
1,001 × 658; 100 KB
 Rail passenger transport by type of transport, 2017-2018 (thousand passengers).png Used on 21 pages
764 × 849; 91 KB
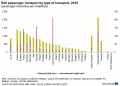 Rail passenger transport by type of transport, 2018 (passenger-kilometres per inhabitant).png Used on 21 pages
1,136 × 818; 81 KB
 Seaborne passengers embarked and disembarked in all ports, 2015-2018 (thousand passengers).png Used on 21 pages
705 × 794; 81 KB
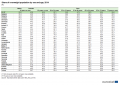
 Share of taxes and levies paid by household consumers for electricity, second half 2019 (%).png Used on 21 pages
1,267 × 780; 94 KB
 Share of taxes and levies paid by non-household consumers for the electricity, second half 2019 (%).png Used on 21 pages
1,080 × 689; 74 KB
 Top 15 airports in the EU-27, 2018 (million passengers carried).png Used on 21 pages
1,001 × 514; 45 KB
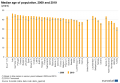
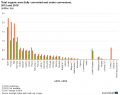 Total organic area (fully converted and under conversion), 2012 and 2018 (million ha) FP20.png Used on 21 pages
1,000 × 791; 43 KB
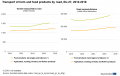 Transport of farm and food products by road, EU-27, 2010-2018 FP20.png Used on 21 pages
1,023 × 644; 36 KB
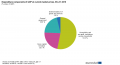
 Waste generation by economic activities and households, EU-27, 2016 (%) FP20.png Used on 21 pages
1,000 × 566; 37 KB
 Acquisitions of citizenship by group of previous citizenship, 2018.png Used on 20 pages
1,024 × 752; 79 KB
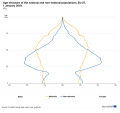 Age structure of the national and non-national populations, EU-27, 1 January 2019 (%).png Used on 20 pages
1,095 × 1,033; 65 KB

 Average utilised agricultural area per holding, 2010 and 2013 (¹) (hectares) YB16.png Used on 20 pages
1,005 × 760; 38 KB
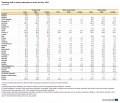
 Causes of death — standardised death rate, 2017 (per 100 000 inhabitants) Health20.png Used on 20 pages
1,024 × 868; 84 KB
 Causes of death — standardised death rate, EU-27, 2016 (per 100 000 inhabitants) Health20.png Used on 20 pages
1,031 × 708; 37 KB
 Causes of death — standardised death rate per 100 000 inhabitants, females, EU-27, 2006-2016 (2006 = 100) Health20.png Used on 20 pages
1,015 × 749; 38 KB
 Causes of death — standardised death rate per 100 000 inhabitants, males, EU-27, 2006-2016 (2006 = 100) Health20.png Used on 20 pages
1,012 × 749; 36 KB
 Causes of death — standardised death rate per 100 000 inhabitants aged less than 65, EU-27, 2006-2016 (2006 = 100) Health20.png Used on 20 pages
1,013 × 748; 43 KB
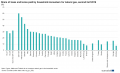
 Change in natural gas prices for household consumers compared with previous year's same semester, second half 2019 (%).png Used on 20 pages
1,004 × 895; 64 KB
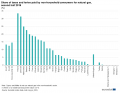
 Change in natural gas prices for non-household consumers compared with previous year's same semester, second half 2019 (%).png Used on 20 pages
978 × 874; 58 KB
 Change in the number of farms and utilised agricultural area by size class, EU-28, 2005–2016 (%).png Used on 20 pages
927 × 616; 47 KB
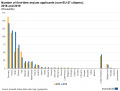
 Citizenships of first-time asylum applicants (non-EU-27 citizens), EU-27, 2018 and 2019 (thousands).png Used on 20 pages
1,202 × 884; 68 KB
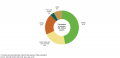
 Composition of total expenditure, 2019 (¹) (% of total expenditure).png Used on 20 pages
1,017 × 494; 37 KB
 Country of origin for outbound tourism trips, 2018 (average nights spent abroad per inhabitant aged 15 years or more).png Used on 20 pages
1,057 × 724; 55 KB

 Current account balance with selected partners, EU-28, 2015 (EUR billion) YB16.png Used on 20 pages
1,005 × 728; 17 KB
 Current account balance with the rest of the world, 2005–15 (¹) (EUR billion) YB16.png Used on 20 pages
1,006 × 719; 55 KB
 Current account transactions, EU-28, 2005–15 (¹) (EUR billion) YB16.png Used on 20 pages
1,005 × 744; 29 KB
 Current and capital accounts relative to GDP, 2015 (% of GDP) YB16.png Used on 20 pages
855 × 707; 40 KB
 Deaths from ischaemic heart diseases — standardised death rate, 2017 (per 100 000 inhabitants) Health20.png Used on 20 pages
1,528 × 1,125; 202 KB
 Deaths from suicide — standardised death rate, 2017 (per 100 000 inhabitants) Health20.png Used on 20 pages
1,022 × 720; 87 KB
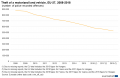
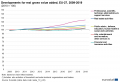
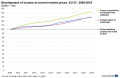 Development of income at current market prices, EU-27, 2009-2019 (2009 = 100).png Used on 20 pages
1,000 × 650; 47 KB
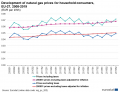 Development of natural gas prices for household consumers, EU-27, 2008-2019 (EUR per kWh).png Used on 20 pages
902 × 694; 62 KB
 Development of natural gas prices for non-household consumers, EU-27, 2008-2019 (EUR per kWh).png Used on 20 pages
1,057 × 631; 59 KB
 Development of total expenditure and total revenue, 2009–2019 (¹) (% of GDP).png Used on 20 pages
809 × 488; 41 KB
 Development of total expenditure and total revenue, 2009–2019 (¹) (Billion EUR).png Used on 20 pages
1,000 × 488; 44 KB
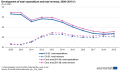
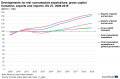 Developments for real consumption expenditure, gross capital formation, exports and imports, EU-27, 2009-2019 (2010 = 100).png Used on 20 pages
1,000 × 657; 58 KB
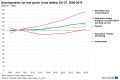 Developments for real gross value added, EU-27, 2009-2019 (2010 = 100).png Used on 20 pages
1,000 × 666; 54 KB
- Digital economy and society - households and individuals FP2020 tables and figures update.xlsx Used on 20 pages
; 118 KB
 Distribution of EU farms and utilised agricultural area according to farm size, 2016 (%).png Used on 20 pages
836 × 506; 33 KB
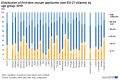 Distribution of first-time asylum applicants (non-EU-27 citizens) by age group, 2019 (%).png Used on 20 pages
1,013 × 678; 101 KB
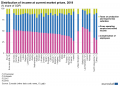
 Distribution of first instance decisions on asylum applications (from non-EU-27 citizens) by outcome, 2019 (%) 1.png Used on 20 pages
1,428 × 1,105; 217 KB
 Distribution of immigrants by citizenship, 2018 (% of all immigrants).png Used on 20 pages
1,089 × 636; 98 KB
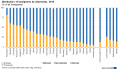
 Distribution of income at current market prices, 2019 (% share of GDP).png Used on 20 pages
1,000 × 714; 117 KB
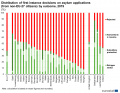
 Distribution of minor asylum applicants (non-EU-27 citizens) by status, 2019 (%) 1.png Used on 20 pages
1,427 × 1,175; 194 KB
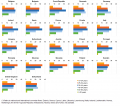
 Distribution of tertiary education students by field and sex, EU-28, 2016 (%) ET18.png Used on 20 pages
1,005 × 717; 39 KB
 Distribution of tertiary graduates by field and sex, EU-28, 2016 (%) ET18.png Used on 20 pages
1,005 × 717; 39 KB


 Energy dependency rate, EU-27, 2008-2018 (% of net imports in gross available energy, based on tonnes of oil equivalent).png Used on 20 pages
1,001 × 677; 45 KB
 Energy dependency rate for all products, 2008 and 2018 (% of net imports in gross available energy, based on tonnes of oil equivalent).png Used on 20 pages
1,001 × 655; 86 KB


 Expenditure components of GDP at current market prices, EU-27, 2019 (% share of GDP) FP20.png Used on 20 pages
1,000 × 539; 24 KB
 Farms by type of specialisation, EU-28, 2016 (share of all EU farms, %).png Used on 20 pages
805 × 726; 83 KB
 Five main citizenships of first-time asylum applicants (non-EU-27 citizens), 2019 (number, rounded figures).png Used on 20 pages
1,031 × 1,161; 129 KB
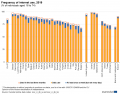 Frequency of internet use, 2019 (% of individuals aged 16 to 74).png Used on 20 pages
1,049 × 825; 95 KB


 GDP per capita at current market prices, 2009 and 2019 (EU-27 = 100; based on PPS per inhabitant).png Used on 20 pages
1,000 × 666; 71 KB
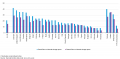
 General government debt, 2018 and 2019 (¹) (General government consolidated gross debt, % of GDP).png Used on 20 pages
1,000 × 538; 56 KB

 Gross fixed capital formation at current market prices, 2019 (% share of GDP).png Used on 20 pages
1,000 × 731; 93 KB
 Gross value added at current basic prices, 2009 and 2019 (% share of total gross value added).png Used on 20 pages
1,021 × 1,044; 156 KB
 Hazardous waste generated, 2010 and 2016 (% share of total waste weight).png Used on 20 pages
1,398 × 790; 91 KB


 Homicides, average per year, 2007–09 and 2010–12 (per 100 000 inhabitants) YB14.png Used on 20 pages
1,005 × 442; 20 KB


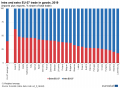
 Immigrants from outside EU-27 and emigrants to outside EU-27, EU-27, 2013–2018 (million).png Used on 20 pages
987 × 989; 50 KB
 Increase in the share of the population aged 65 years or over between 2009 and 2019 (percentage points).png Used on 20 pages
1,001 × 816; 86 KB
 Individuals who did not provide any personal information over the internet, 2016 (% of individuals who used internet within the last year).png Used on 20 pages
1,500 × 1,169; 126 KB
 Individuals who used the internet for participation in social networking, 2019 (% of individuals aged 16 to 74).png Used on 20 pages
1,052 × 832; 96 KB
 Intentional homicide, 2008-2018 (number of police-recorded offences).png Used on 20 pages
870 × 885; 90 KB
 Intentional homicide, 2018 (police-recorded offences per hundred thousand inhabitants).png Used on 20 pages
901 × 1,021; 97 KB
 Internet access and broadband internet connections of households, EU-27, 2009-2019 (% of all households).png Used on 20 pages
1,500 × 1,194; 70 KB
 Internet access in households by degree of urbanisation, 2019 (% of all households).png Used on 20 pages
1,054 × 860; 67 KB
 Internet access of households, 2014 and 2019 (% of all households).png Used on 20 pages
1,051 × 742; 112 KB
 Investment at current market prices, 2009, 2014 and 2019 (% share of GDP) FP20.png Used on 20 pages
1,027 × 850; 73 KB

 Land belonging to farms by type of land, 2016 (% share on total land area).png Used on 20 pages
917 × 581; 56 KB
 Main categories of taxes and social contributions, 2019 (¹) (% of GDP).png Used on 20 pages
1,001 × 600; 73 KB
 Main categories of taxes and social contributions, EU-27, 2009–2019 (¹) (% of GDP).png Used on 20 pages
1,010 × 446; 33 KB
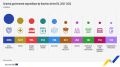
 Main components of government expenditure, 2019 (¹) (% of total expenditure).png Used on 20 pages
1,002 × 658; 87 KB
 Main components of government revenue, 2019 (¹) (% of total revenue).png Used on 20 pages
973 × 615; 77 KB
 Main origin of primary energy imports, EU-27, 2008-2018 (% of extra EU-27 imports).png Used on 20 pages
1,172 × 1,023; 474 KB
 Major causes of death for persons aged less than 65 years, 2017 (standardised death rates per 100 000 inhabitants) Health20.png Used on 20 pages
1,023 × 852; 79 KB
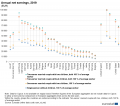
 Median gross hourly earnings, all employees (excluding apprentices), 2014.png Used on 20 pages
1,093 × 863; 104 KB
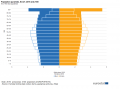
 Min. wages as a proportion of median gross monthly earnings, 2014 (%).png Used on 20 pages
1,089 × 874; 105 KB
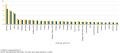
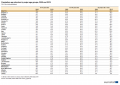
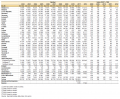
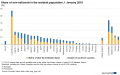
 Minimum wages, January 2010 and January 2020 (EUR per month and %).png Used on 20 pages
1,063 × 1,247; 109 KB


 Natural gas prices for household consumers, second half 2019 (EUR per kWh).png Used on 20 pages
1,001 × 663; 72 KB
 Natural gas prices for non-household consumers, second half 2019 (EUR per kWh).png Used on 20 pages
1,047 × 727; 83 KB
 Naturalisation rate (acquisition of citizenship per 100 resident foreigners), 2018.png Used on 20 pages
1,508 × 1,018; 115 KB

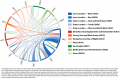
 Number of EU-27 citizens that are usual residents in the rest of the EU-27 as of 1 January 2019(million).png Used on 20 pages
1,250 × 688; 78 KB
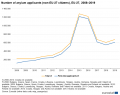 Number of asylum applicants (non-EU-27 citizens), EU-27, 2008–2019.png Used on 20 pages
1,001 × 790; 71 KB
 Number of first-time asylum applicants (non-EU-27 citizens), 2018 and 2019 (thousands).png Used on 20 pages
1,001 × 757; 56 KB
 Number of first instance and final decisions on asylum applications (from non-EU-27 citizens), 2019 (thousands) 1.png Used on 20 pages
1,427 × 902; 103 KB
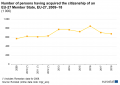 Number of persons having acquired the citizenship of an EU-27 Member State, EU-27, 2009–18(1 000).png Used on 20 pages
1,037 × 731; 50 KB
 Number of tertiary education students by level and sex, 2016 (thousands) ET18.png Used on 20 pages
1,027 × 789; 110 KB
 Offences recorded by the police, EU-28, 2007–12 (1) (2007 = 100) YB14.png Used on 20 pages
1,005 × 543; 25 KB

 Police officers, average per year, 2007–09 and 2010–12 (per 100 000 inhabitants) YB14.png Used on 20 pages
1,005 × 490; 38 KB
 Population age structure by major age groups, 2009 and 2019 (% of the total population).png Used on 20 pages
1,134 × 806; 78 KB

 Population pyramids, EU-27, 2004 and 2019 (% of the total population).png Used on 20 pages
1,056 × 783; 31 KB
 Population structure by major age groups, EU-27, 2019-2100 (% of total population).png Used on 20 pages
939 × 750; 72 KB
 Prison population, average per year, 2007–09 and 2010–12 (per 100 000 inhabitants) YB14.png Used on 20 pages
1,005 × 442; 28 KB
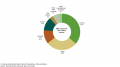
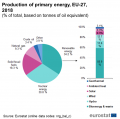 Production of primary energy, EU-27, 2018 (% of total, based on tonnes of oil equivalent).png Used on 20 pages
743 × 739; 107 KB
 Production of primary energy by fuel type, EU-27, 2008-2018 (2008 = 100, based on tonnes of oil equivalent).png Used on 20 pages
1,001 × 644; 63 KB
 Projected total-age and old-age dependency ratio, EU-27, 2019-2100 (%).png Used on 20 pages
1,012 × 664; 43 KB
 Prop. of employees earning less than 105 % of the minimum wage, October 2010 and 2014 (%).png Used on 20 pages
1,001 × 826; 91 KB
 Public balance, 2018 and 2019 (¹) (Net borrowing or lending of the general government sector, % of GDP).png Used on 20 pages
999 × 558; 51 KB
 Public balance and general government debt, 2016-2019 (¹) (% of GDP).png Used on 20 pages
1,023 × 700; 73 KB
 Public expenditure on tertiary education relative to GDP, 2015 (%) ET18.png Used on 20 pages
1,005 × 749; 60 KB
 Real GDP rate of change, 2009-2019 (% change compared with the previous year).png Used on 20 pages
1,000 × 698; 62 KB
 Real annual rate of change in expenditure components of GDP, EU-27, 2009-2019 (%) FP20.png Used on 20 pages
1,000 × 657; 60 KB

 Real labour productivity, EU-27, 2009, 2014 and 2019 (thousand EUR per person employed) FP20.png Used on 20 pages
1,000 × 680; 47 KB

 Robbery, average 2016-2018 (police-recorded offences per hundred thousand inhabitants).png Used on 20 pages
1,015 × 629; 66 KB
 Robbery (police-recorded offences), EU-27, 2008-2018 (number of offences).png Used on 20 pages
1,153 × 632; 39 KB
 Selected items of the financial account balance, 2015 (¹) (EUR billion) YB16.png Used on 20 pages
1,055 × 769; 51 KB
 Selected items of the financial account balance relative to GDP, 2015 (% of GDP) YB16.png Used on 20 pages
1,002 × 753; 50 KB
 Share of energy from renewable sources, 2004-2018 (% of gross final energy consumption).png Used on 20 pages
1,485 × 859; 152 KB
 Share of energy from renewable sources, 2018 (% of gross final energy consumption).png Used on 20 pages
1,001 × 765; 76 KB
 Share of energy from renewable sources for heating and cooling, 2004-2018 (%).png Used on 20 pages
971 × 819; 102 KB
 Share of energy from renewable sources in gross electricity consumption, 2004-2018 (%).png Used on 20 pages
958 × 818; 111 KB
 Share of energy from renewable sources in transport, 2004-2018 (% of gross final energy consumption).png Used on 20 pages
1,018 × 814; 96 KB
 Share of energy from renewable sources in transport, 2018 (% of gross final energy consumption).png Used on 20 pages
1,001 × 764; 70 KB
 Share of male first time asylum applicants (non-EU-27 citizens) by age group, EU-27, 2019 (%).png Used on 20 pages
1,011 × 836; 43 KB
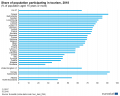 Share of population participating in tourism, 2018 (% of population aged 15 years or more).png Used on 20 pages
1,501 × 1,200; 106 KB
 Share of regular workers in the farm labour force and distribution by work intensity, 2013 (%) YB16.png Used on 20 pages
1,005 × 744; 63 KB
 Share of taxes and levies paid by household consumers for natural gas, second half 2019 (%).png Used on 20 pages
1,287 × 786; 80 KB
 Share of taxes and levies paid by non-household consumers for natural gas, second half 2019 (%).png Used on 20 pages
1,156 × 900; 84 KB
 Student-academic staff ratios in tertiary education, 2016 (number of students per member of academic staff) ET18.png Used on 20 pages
1,025 × 852; 70 KB
 Tax rate indicators on low wage earners — single person without children, 2019 (%).png Used on 20 pages
1,000 × 886; 91 KB
 Teaching staff in tertiary education by level and sex, 2016 (thousands) ET18.png Used on 20 pages
1,027 × 884; 89 KB
 Theft of a motorized land vehicle, EU-27, 2008-2018 (number of police recorded offences).png Used on 20 pages
1,002 × 653; 46 KB
 Theft of a motorized land vehicle, average 2016-2018 (police recorded offences per hundred thousand inhabitants).png Used on 20 pages
1,000 × 666; 71 KB
 Tourism destinations — nights spent at tourist accommodation establishments, 2018 (million nights spent in the country by non-residents).png Used on 20 pages
1,233 × 980; 80 KB
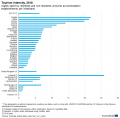 Tourism intensity, 2018 (nights spent by residents and non-residents at tourist accommodation establishments per inhabitant).png Used on 20 pages
1,001 × 988; 74 KB

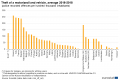
 Travel receipts and expenditure in balance of payments, 2013–2018.png Used on 20 pages
1,030 × 862; 99 KB
 Trends in nights spent at EU-27 tourist accommodation establishments, EU-27, 2005-2018 (index 2005=100).png Used on 20 pages
1,293 × 804; 77 KB
 Use of cookies and browser settings, 2016 (% of individuals who used internet within the last year).png Used on 20 pages
1,030 × 826; 91 KB
 Utilised agricultural area by land use, EU-28, 2013 (¹) (% share of utilised agricultural area) YB16.png Used on 20 pages
1,005 × 744; 26 KB

 Waste generation, excluding major mineral wastes, 2006 and 2016 (kg per inhabitant).png Used on 20 pages
1,001 × 609; 70 KB
 Waste generation, excluding major mineral wastes, EU-28, 2004-2016 (million tonnes).png Used on 20 pages
986 × 334; 36 KB
 Waste generation by economic activities and households, 2016 (%).png Used on 20 pages
1,019 × 827; 64 KB
 Waste generation by economic activities and households, EU-28, 2016 (%).png Used on 20 pages
639 × 590; 47 KB


 Agricultural production of crops, 2013 (thousand tonnes) YB15.png Used on 19 pages
1,020 × 715; 42 KB
 Agricultural production related to animals, 2013 (thousand tonnes) YB15.png Used on 19 pages
1,033 × 651; 41 KB

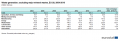
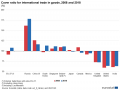 Cover ratio for international trade in goods, 2008 and 2018 (%) FP2020.png Used on 19 pages
1,000 × 754; 47 KB
 Crude birth rate, by NUTS 2 regions, 2014 (¹) (number of live births per 1 000 inhabitants) RYB2016.png Used on 19 pages
1,005 × 805; 38 KB
 Crude death rate, by NUTS 2 regions, 2014 (¹) (number of deaths per 1 000 inhabitants) RYB2016.png Used on 19 pages
1,005 × 790; 43 KB
 Crude rate of net migration (plus statistical adjustment), by NUTS 3 regions, 2014 (¹) (per 1 000 inhabitants) RYB2016.png Used on 19 pages
1,009 × 1,370; 614 KB
 Crude rate of total population change, by NUTS 3 regions, 2014 (¹) (per 1 000 inhabitants) RYB2016.png Used on 19 pages
1,009 × 1,370; 612 KB
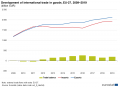 Development of international trade in goods, EU-27, 2009-2019 FP2020.png Used on 19 pages
1,000 × 726; 42 KB
 Developments for real gross value added, EU-27, 2009-2019 (2010 = 100) B FP20.png Used on 19 pages
1,000 × 680; 57 KB

 Disposable income of private households, by NUTS 2 regions, 2008 (1) (PPCS per inhabitant).png Used on 19 pages
1,010 × 850; 79 KB
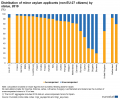
 Distribution of final decisions on asylum applications (from non-EU-27 citizens) by outcome, 2019 (%) 1.png Used on 19 pages
1,496 × 1,033; 196 KB
 Distribution of tertiary education graduates by field, 2016 (%) ET18.png Used on 19 pages
1,027 × 916; 89 KB
 Distribution of the total population by broad age groups, selected NUTS 3 regions, 1 January 2015 (¹) (%) RYB2016.png Used on 19 pages
1,103 × 744; 49 KB
 Enterprise turnover from e-commerce, 2010 (1) (% of total turnover).png Used on 19 pages
539 × 254; 8 KB
 Enterprise use of RFID technologies by purpose, NACE and size class, EU-27, January 2011 (1) (% of enterprises using RFID).png Used on 19 pages
562 × 336; 15 KB
 Enterprise use of information technology, January 2011 (% of enterprises).png Used on 19 pages
571 × 576; 36 KB
 Enterprise use of information technology, by size class, EU-27, January 2011 (% of enterprises).png Used on 19 pages
527 × 180; 6 KB
 Enterprise use of mobile broadband connections to the internet, January 2010 and January 2011 (% of enterprises).png Used on 19 pages
526 × 244; 9 KB
 Enterprises selling and buying online or having a website or homepage, EU-27, 2010 (1) (% of enterprises).png Used on 19 pages
525 × 283; 12 KB
 Enterprises using the internet in contact with public authorities, by purpose of use, January 2011.png Used on 19 pages
571 × 621; 38 KB
 Extra EU-27 trade by main products, EU-27, 2014 and 2019 FP2020.png Used on 19 pages
1,000 × 698; 55 KB

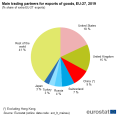
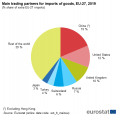
 Extra EU-27 trade in goods by main trading partners, EU-27, 2009 and 2019 FP2020.png Used on 19 pages
1,026 × 811; 139 KB
 Frequency of internet use, 2011 (% of individuals aged 16 to 74).png Used on 19 pages
573 × 284; 11 KB
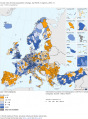
 Gross domestic product (GDP) per inhabitant, in purchasing power standard (PPS), by NUTS 2 regions, 2009 (% of the EU-27 average, EU-27=100).png Used on 19 pages
1,371 × 1,828; 145 KB
 Gross domestic product (GDP) per inhabitant, in purchasing power standard (PPS), by NUTS 3 regions, 2009 (1) (% of the EU-27 average, EU-27=100) map.png Used on 19 pages
1,371 × 1,828; 179 KB
 Gross value added per person employed in relation to the EU-28 average, by NUTS 2 regions, 2014 (¹) (% of the EU-28 average, EU-28 = 100) RYB2016.png Used on 19 pages
1,009 × 1,370; 464 KB


 Internet access and broadband internet connections by households, EU-27, 2006-2011 (% of all households).png Used on 19 pages
525 × 199; 4 KB
 Internet access of households, 2010 and 2011 (% of all households).png Used on 19 pages
539 × 264; 8 KB

 Life expectancy at birth, by NUTS 2 regions, 2014 (¹) (years) RYB2016.png Used on 19 pages
1,009 × 1,370; 482 KB
 Life expectancy at birth, females, by NUTS 2 regions, average 2006–08.PNG Used on 19 pages
835 × 851; 201 KB
 Life expectancy at birth, males, by NUTS 2 regions, average 2006–08.PNG Used on 19 pages
831 × 853; 203 KB


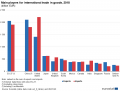 Main players for international trade in goods, 2018 (billion EUR) FP2020.png Used on 19 pages
1,000 × 757; 58 KB

 Net migration (including statistical adjustment), by NUTS 3 regions, 2008.PNG Used on 19 pages
838 × 842; 264 KB
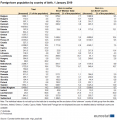
 Non-national population by group of citizenship, 1 January 2019.png Used on 19 pages
1,170 × 969; 525 KB
 Number of tertiary education graduates by field, 2016 (thousands) ET18.png Used on 19 pages
1,027 × 916; 88 KB


 Place of internet use, 2011 (% of internet users aged 16 to 74).png Used on 19 pages
570 × 604; 27 KB

 Primary income of private households per inhabitant (in PPCS), by NUTS 2 regions, 2008 (1) (% of the EU-27 average, EU-27=100).png Used on 19 pages
1,371 × 1,828; 146 KB
 Production of main agricultural crops, EU-28, 2012 and 2013 (¹) (thousand tonnes) YB15.png Used on 19 pages
981 × 372; 13 KB

 Share in the total population of the working age population (aged 20–64), by NUTS 3 regions, 1 January 2015 (¹) (%) RYB2016.png Used on 19 pages
1,009 × 1,370; 616 KB
 Share of non-nationals in the resident population, 1 January 2019 (%).png Used on 19 pages
1,093 × 687; 71 KB
 Share of persons aged 30–34 with tertiary education (ISCED levels 5–8) attainment, by NUTS 2 regions, 2015 (¹) (%) RYB2016.png Used on 19 pages
1,009 × 1,370; 489 KB
 Share of young people aged 18–24 neither in employment nor in education or training (NEETs), by NUTS 2 regions, 2015 (¹) (%) RYB2016.png Used on 19 pages
1,009 × 1,370; 487 KB
 Share of young people aged 18–24 who were early leavers from education and training, by NUTS 2 regions, 2015 (¹) (%) RYB2016.png Used on 19 pages
1,009 × 1,370; 502 KB


 Total fertility rate, by NUTS 2 regions, 2014 (¹) (average number of live births per woman) RYB2016.png Used on 19 pages
1,005 × 790; 38 KB

 Total fertility rate, by NUTS 3 regions, 2014 (¹) (average number of live births per woman) RYB2016.png Used on 19 pages
1,009 × 1,370; 612 KB
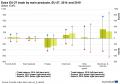
 Trade balance for international trade in goods, 2008 and 2018 FP2020.png Used on 19 pages
1,000 × 754; 45 KB
 Use of ICTs and use of online services, 2009-2011 (% of individuals aged 16 to 74).png Used on 19 pages
570 × 591; 33 KB

 Frequency of internet use, 2014 (% of individuals aged 16 to 74) YB15.png Used on 18 pages
1,005 × 503; 51 KB
 Individuals who used the internet away from home or work, 2012 and 2014 (¹) (% of individuals aged 16 to 74) YB15.png Used on 18 pages
1,005 × 544; 39 KB
 Individuals who used the internet for participation in social networking, 2014 (% of individuals aged 16 to 74) YB15.png Used on 18 pages
1,005 × 480; 30 KB
 Internet access and broadband internet connections of households, EU-28, 2007–14 (% of all households) YB15.png Used on 18 pages
1,005 × 408; 12 KB
 Internet access in households by income quartile, 2014 (¹) (% of all households) YB15.png Used on 18 pages
1,005 × 533; 28 KB
 Internet access of households, 2009 and 2014 (% of all households) YB15.png Used on 18 pages
1,005 × 533; 48 KB


 Production of cereals, EU-28, 2013 (¹) (%, based on tonnes) YB15.png Used on 18 pages
1,005 × 485; 19 KB
 Use of internet storage space for saving and sharing files, 2014 (¹) (% of individuals aged 16 to 74) YB15.png Used on 18 pages
1,005 × 496; 35 KB


 LUCAS geo-referenced point in a field and pictures to the north south east and west.png Used on 4 pages
996 × 725; 1.29 MB


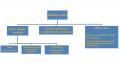
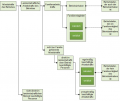
 Summary regarding the names of the different typologies and items.png Used on 4 pages
1,081 × 338; 43 KB
- Error creating thumbnail: File with dimensions greater than 30 MP


 Average satisfaction with accommodation, by degree of urbanisation, 2013 (¹) (scale, 0–10) RYB15.png Used on 3 pages
1,005 × 528; 36 KB
 Average satisfaction with commuting time, by degree of urbanisation, 2013 (¹) (scale, 0–10) RYB15.png Used on 3 pages
1,005 × 528; 36 KB
 Average satisfaction with time use, by degree of urbanisation, 2013 (¹) (scale, 0–10) RYB15.png Used on 3 pages
1,005 × 528; 35 KB
 Average trust in others, by degree of urbanisation, 2013 (¹) (scale, 0–10) RYB15.png Used on 3 pages
1,005 × 528; 35 KB


 Cities and commuting zones compared with the degree of urbanisation on the Polish–Slovakian border.png Used on 3 pages
2,340 × 3,306; 2.96 MB


 Commuter flows within, into and out of London, by NUTS 2 regions, 2015 (¹) (based on number of persons in employment) RYB2016.png Used on 3 pages
1,007 × 674; 456 KB
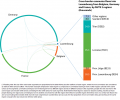 Commuter flows within, into and out of Luxembourg, 2015 (¹) (thousands) RYB2016.png Used on 3 pages
1,006 × 835; 279 KB
 Commuter outflows, by NUTS 2 regions, 2015 (¹) (% of total employment) RYB2016.png Used on 3 pages
1,009 × 1,370; 521 KB
 Competitiveness for selected dimensions of basic competitiveness sub-index, 2013 (EU-28 = 0) RYB14.png Used on 3 pages
1,019 × 539; 33 KB
 Crude rate of net migration, by coastal and aggregates of non-coastal regions, 2016 (per 1 000 inhabitants)-RYB18.png Used on 3 pages
1,710 × 2,421; 215 KB
 Defining a city — high-density cells, urban centre and city (Graz, Austria).png Used on 3 pages
1,321 × 790; 68 KB
 Distribution by age group of persons commuting out of NUTS 2 regions, 2015 (¹) (% of commuters) RYB2016.png Used on 3 pages
1,007 × 887; 138 KB
 Distribution by economic activity of persons commuting out of NUTS 2 regions, 2015 (¹) (% of commuters) RYB2016.png Used on 3 pages
1,008 × 722; 120 KB
 Distribution by educational attainment of persons commuting out of NUTS 2 regions, 2015 (¹) (% of commuters) RYB2016.png Used on 3 pages
1,007 × 889; 137 KB
 Distribution of the population, by degree of urbanisation, 2013 (% of total) RYB15.png Used on 3 pages
1,005 × 497; 42 KB
 Distribution of the population, by degree of urbanisation, 2015 (%) RYB17.png Used on 3 pages
1,005 × 1,051; 81 KB
 Distribution of the population, by type of dwelling and degree of urbanisation, EU-28, 2015 (% of total population) RYB17.png Used on 3 pages
1,005 × 744; 18 KB
 Early leavers from education and training, by degree of urbanisation, 2013 (¹) (% of 18–24 year-olds) RYB15.png Used on 3 pages
1,005 × 592; 42 KB
 Employment rate, persons aged 20–64, by degree of urbanisation, 2013 (¹) (%) RYB15.png Used on 3 pages
1,005 × 528; 38 KB
 Employment rate, persons aged 20–64, by degree of urbanisation, 2015 (%) RYB17.png Used on 3 pages
1,005 × 742; 36 KB
 Employment rate developments, 2008-2018 (2008 = 100, by NUTS 2 regions) RYB19.png Used on 3 pages
1,029 × 1,382; 4.08 MB
 Employment rates for border and non-border regions, 2016 (% share of people aged 20-64)-RYB18.png Used on 3 pages
1,005 × 765; 32 KB


 Fastest and slowest ageing regions in the EU — projected change in median age, by NUTS 2 regions, 2015–50 (¹) (years) RYB2016.png Used on 3 pages
1,058 × 744; 37 KB
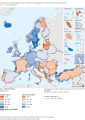
 GDP per inhabitant, 2017 (PPS; %, average change per annum of this ratio between 2008 and 2017; by NUTS 2 regions) F1 RYB19.png Used on 3 pages
1,005 × 1,101; 92 KB
 GDP per inhabitant, 2017 (PPS; %, average change per annum of this ratio between 2008 and 2017; by NUTS 2 regions) RYB19.png Used on 3 pages
1,024 × 1,449; 541 KB
 GDP per inhabitant, by urban-rural typology, 2016 (thousand purchasing power standards (PPS) per inhabitant)-RYB18.png Used on 3 pages
1,005 × 829; 44 KB
 Gender gap for core human resources in science and technology (HRSTC), by NUTS level 1 region, 2013 (percentage points difference) RYB15.png Used on 3 pages
1,021 × 1,361; 375 KB
 Gender gap for life expectancy at birth, by NUTS level 2 region, 2012 (¹) (years, female life expectancy - male life expectancy) RYB15.png Used on 3 pages
1,021 × 1,361; 407 KB
 Groundwater abstraction for public water supply, by NUTS 2 regions, 2011 (1) (cubic metres per inhabitant) RYB14.png Used on 3 pages
1,005 × 712; 39 KB
 Groundwater abstraction for public water supply, by river basin, 2011 (1) (million cubic metres) RYB14.png Used on 3 pages
1,028 × 1,370; 372 KB

 Household disposable income, 2016 (EUR per inhabitant; overall change of this ratio between 2008 and 2016; by NUTS 2 regions) RYB19.png Used on 3 pages
1,024 × 1,449; 480 KB
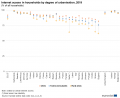
 Housing cost overburden rate, by degree of urbanisation, 2015 (%) RYB17.png Used on 3 pages
1,005 × 787; 37 KB

 Individuals accessing the internet on a daily basis, by degree of urbanisation, 2016 (% of all individuals) RYB17.png Used on 3 pages
1,005 × 772; 41 KB


 Landscape diversity expressed by the Shannon evenness index, by NUTS 2 regions, 2012 (1) (index, range = 0–1) RYB14.png Used on 3 pages
1,005 × 696; 37 KB
 Landscape diversity expressed by the Shannon evenness index, by NUTS 2 regions, 2012 (index, range = 0–1) RYB14.png Used on 3 pages
1,027 × 1,370; 390 KB

 Metro and non-metro regions compared with the urban–rural typology on the Polish–Slovakian border.png Used on 3 pages
1,753 × 2,478; 812 KB

 Municipal waste generated per inhabitant, by NUTS 2 regions, 2011 (1) (kg per inhabitant) RYB14.png Used on 3 pages
1,027 × 1,370; 396 KB
 Municipal waste generated per inhabitant, selected capital city NUTS 2 regions, 2000–11 (1) (kg per inhabitant) RYB14.png Used on 3 pages
1,005 × 472; 26 KB
 Municipal waste treatment, by NUTS 2 regions, 2011 (1) (kg per inhabitant) RYB14.png Used on 3 pages
1,005 × 696; 43 KB


 Number of persons at-risk-of-poverty or social exclusion analysed by type of risks, EU-28, 2015 (million) RYB17.png Used on 3 pages
754 × 645; 40 KB
 Number of regions with increased decreased projected populations, by NUTS 2 regions, 2015–50 (number) RYB2016.png Used on 3 pages
1,005 × 742; 26 KB
 Overall life satisfaction, by degree of urbanisation, 2013 (¹) (scale, 0–10) RYB15.png Used on 3 pages
1,005 × 528; 36 KB


_and_its_logistic_curve_(in_blue).PNG)

_FP20.png)
,_2017-2018_(2010_%3D_100)_FP20.png)
.png)
_SILC20.png)
_SILC20.png)
_SILC20.png)
_SILC20.png)

_SILC20.png)


.png)
.png)
_SILC20.png)
_SILC20.png)
.png)
.png)
_FP20.png)
_FP20.png)
_FP20.png)
_FP20.png)
_FP20.png)
_SILC20.png)

.png)
_SILC20.png)
.png)
.png)
_SILC20.png)

_FP20.png)
.png)
_SILC20.png)
_FP20.png)
.png)
.png)
.png)
,_2012_and_2018_(million_ha)_FP20.png)

_FP20.png)

.png)
.png)
.png)
_(hectares)_YB16.png)
_Health20.png)
_Health20.png)
_Health20.png)
_Health20.png)
_Health20.png)
.png)
.png)
.png)
,_EU-27,_2018_and_2019_(thousands).png)

_(%25_of_total_expenditure).png)
_(%25_of_total_revenue).png)

.png)

_YB16.png)
_(EUR_billion)_YB16.png)
_(EUR_billion)_YB16.png)
_YB16.png)
_YB16.png)
_Health20.png)
_Health20.png)
.png)
.png)
.png)
_(%25_of_GDP).png)
_(Billion_EUR).png)
.png)
.png)
.png)
_by_age_group,_2019_(%25).png)
_by_outcome,_2019_(%25)_1.png)
.png)
.png)
_by_status,_2019_(%25)_1.png)
_ET18.png)
_ET18.png)
_YB16.png)


.png)
.png)

.png)

_FP20.png)
.png)
.png)
,_2019_(number,_rounded_figures).png)
.png)
.png)

.png)
_(General_government_consolidated_gross_debt,_%25_of_GDP).png)
_(%25_of_GDP).png)
.png)
.png)
.png)
.png)
.png)
_YB14.png)

.png)
.png)

.png)
.png)
.png)
.png)
.png)
.png)
.png)
.png)
.png)
.png)
.png)
.png)
_FP20.png)
_YB16.png)
_(%25)_YB16.png)
.png)
_earning_two_thirds_or_less_of_the_median_gross_hourly_earnings,_2014_(%25_of_employees).png)
_(%25_of_GDP).png)
_(%25_of_GDP).png)
_(%25_of_total_expenditure).png)
_(%25_of_total_revenue).png)
.png)
.png)
_Health20.png)
.png)
,_2014.png)
.png)
.png)
.png)

.png)
.png)
,_2018.png)

.png)
,_EU-27,_2008%E2%80%932019.png)
,_2018_and_2019_(thousands).png)
,_2019_(thousands)_1.png)
.png)
_ET18.png)
_ET18.png)
_(2007_%3D_100)_YB14.png)


_YB14.png)
.png)
.png)
.png)

.png)

_YB14.png)
.png)
.png)
.png)
.png)
_(Net_borrowing_or_lending_of_the_general_government_sector,_%25_of_GDP).png)
_(%25_of_GDP).png)
_ET18.png)

.png)
_FP20.png)

_FP20.png)
_(millions)_YB14.png)

.png)
,_EU-27,_2008-2018_(number_of_offences).png)
_(EUR_billion)_YB16.png)
_YB16.png)
.png)
.png)
.png)
.png)
.png)
.png)
_by_age_group,_EU-27,_2019_(%25).png)
.png)
.png)
.png)
_YB16.png)
.png)
.png)
_ET18.png)
.png)
_ET18.png)
.png)
.png)
.png)
.png)
,_2018.png)


.png)
.png)
.png)
_(%25_share_of_utilised_agricultural_area)_YB16.png)


.png)
.png)
.png)
.png)
.png)
.png)

.png)
_YB15.png)
_YB15.png)
_(overall_difference_in_purchasing_power_consumption_standard_(PPCS)_per_inhabitant_between_2008_and_2013)_RYB2016.png)
_per_inhabitant,_in_purchasing_power_standard_(PPS),_by_NUTS_2_regions,_2000-2009_(1)_(percentage_points_difference_between_2009_and_2000;_in_relation_to_the_EU-27_average).png)
_per_inhabitant_in_purchasing_power_standard_(PPS)_in_relation_to_the_EU-28_average,_by_NUTS_2_regions,_2008%E2%80%9314_(%C2%B9)_(percentage_points_difference_between_2008_and_2014)_RYB2016.png)
.png)
_FP2020.png)
_(number_of_live_births_per_1_000_inhabitants)_RYB2016.png)
_(number_of_deaths_per_1_000_inhabitants)_RYB2016.png)
,_by_NUTS_3_regions,_2014_(%C2%B9)_(per_1_000_inhabitants)_RYB2016.png)
_(per_1_000_inhabitants)_RYB2016.png)

_B_FP20.png)
.png)
_(PPCS_per_inhabitant).png)
_(purchasing_power_consumption_standard_(PPCS)_per_inhabitant)_RYB2016.png)
_by_outcome,_2019_(%25)_1.png)
_ET18.png)
_(%25)_RYB2016.png)

_(%25_of_total_turnover).png)
_(%25_of_enterprises_using_RFID).png)
.png)
.png)
_(%25_of_enterprises).png)
.png)


.png)
_(difference_in_years_between_the_life_expectancy_of_women_and_men)_RYB2016.png)
_attainment,_selected_NUTS_2_regions_in_the_EU,_2015_(%C2%B9)_(percentage_points_difference,_share_for_men_-_share_for_women)_RYB2016.png)
,_selected_NUTS_2_regions_in_the_EU,_2015_(%C2%B9)_(percentage_points_difference,_share_for_men_-_share_for_women)_RYB2016.png)
_(percentage_points_difference,_share_for_men_-_share_for_women)_RYB2016.png)
_per_inhabitant,_in_purchasing_power_standard_(PPS),_by_NUTS_2_regions,_2009_(%25_of_the_EU-27_average,_EU-27%3D100).png)
_per_inhabitant,_in_purchasing_power_standard_(PPS),_by_NUTS_3_regions,_2009_(1)_(%25_of_the_EU-27_average,_EU-27%3D100)_map.png)
_per_inhabitant_in_purchasing_power_standard_(PPS)_in_relation_to_the_EU-28_average,_by_NUTS_2_regions,_2014_(%25_of_the_EU-28_average,_EU-28_%3D_100)_RYB2016.png)
_per_inhabitant_in_purchasing_power_standard_(PPS)_in_relation_to_the_EU-28_average,_by_NUTS_2_regions,_2014_(%C2%B9)_(%25_of_the_EU-28_average,_EU-28_%3D_100)_RYB2016.png)
_(%25_of_the_EU-28_average,_EU-28_%3D_100)_RYB2016.png)
.png)


.png)
.png)


_(years)_RYB2016.png)


_FP2020.png)


,_by_NUTS_3_regions,_2008.PNG)

_ET18.png)


,_by_NUTS_2_regions,_2014_(%C2%B9)_(%25_share_of_all_four_year-olds)_RYB2016.png)
.png)


,_by_NUTS_2_regions,_2008_(1)_(%25_of_the_EU-27_average,_EU-27%3D100).png)
_per_inhabitant)_RYB2016.png)
_YB15.png)
_YB15.png)
,_by_NUTS_3_regions,_1_January_2015_(%C2%B9)_(%25)_RYB2016.png)
.png)
_attainment,_by_NUTS_2_regions,_2015_(%C2%B9)_(%25)_RYB2016.png)
_who_were_following_vocational_programmes,_by_NUTS_2_regions,_2014_(%C2%B9)_(%25_of_all_students_in_ISCED_level_3)_RYB2016.png)
,_by_NUTS_2_regions,_2015_(%C2%B9)_(%25)_RYB2016.png)
_(%25)_RYB2016.png)


_(average_number_of_live_births_per_woman)_RYB2016.png)

_(average_number_of_live_births_per_woman)_RYB2016.png)

.png)
_(%25)_YB15.png)


_YB15.png)
_YB15.png)
_(%25_of_individuals_aged_16_to_74)_YB15.png)
_YB15.png)
_(%25_of_all_households)_YB15.png)
_YB15.png)


_(%25,_based_on_tonnes)_YB15.png)
_(%25_of_individuals_aged_16_to_74)_YB15.png)
_per_inhabitant,_in_purchasing_power_standard_(PPS),_by_NUTS_3_regions,_2009_(1)_(%25_of_the_EU-27_average,_EU-27%3D100)_figure.png)


_(%25_of_total_employment)_RYB2016.png)
_(scale,_0%E2%80%9310)_RYB15.png)
_(scale,_0%E2%80%9310)_RYB15.png)
_(scale,_0%E2%80%9310)_RYB15.png)
_(scale,_0%E2%80%9310)_RYB15.png)


_(based_on_number_of_persons_in_employment)_RYB2016.png)
_(thousands)_RYB2016.png)
_(%25_of_total_employment)_RYB2016.png)
_RYB14.png)
-RYB18.png)
.png)
_(%25_of_commuters)_RYB2016.png)
_(%25_of_commuters)_RYB2016.png)
_(%25_of_commuters)_RYB2016.png)
_RYB15.png)
_RYB17.png)
_RYB17.png)
_(%25_of_18%E2%80%9324_year-olds)_RYB15.png)
-RYB18.png)
_RYB19.png)
_RYB19.png)
_(%25)_RYB15.png)
_RYB17.png)
_RYB19.png)
-RYB18.png)


_(years)_RYB2016.png)
_F1_RYB19.png)
_RYB19.png)
_per_inhabitant)-RYB18.png)
_RYB19.png)
_and_%25,_based_on_data_in_PPS)-RYB18.png)
,_by_NUTS_2_regions_and_by_stages_of_competitiveness,_2011_and_2013_(1)_RYB14.png)
-RYB18.png)
_(hours_per_week,_difference_between_the_average_hours_worked_by_men_and_the_average_hours_worked_by_women)_RYB15.png)
,_by_NUTS_level_1_region,_2013_(percentage_points_difference)_RYB15.png)
_(years,_female_life_expectancy_-_male_life_expectancy)_RYB15.png)
_(percentage_points_difference_between_the_share_of_women_aged_15%E2%80%9364_working_part-time_and_the_share_of_men_aged_15%E2%80%9364_working_part-time)_RYB15.png)
_(percentage_points_difference_between_the_activity_rate_for_men_and_the_activity_rate_for_women)_RYB15.png)
_(percentage_points_difference_between_the_employment_rate_for_men_and_the_employment_rate_for_women)_RYB15.png)
_(%25,_average_gross_hourly_earnings_of_male_paid_employees_-_female_paid_employees,_as_a_percentage_of_average_gross_hourly_earnings_of_male_paid_employees)_RYB15.png)
_(cubic_metres_per_inhabitant)_RYB14.png)
_(million_cubic_metres)_RYB14.png)

_RYB19.png)
_RYB19.png)
_RYB17.png)
.png)
_RYB17.png)


_RYB19.png)
_(index,_range_%3D_0%E2%80%931)_RYB14.png)
_RYB14.png)


_(kg_per_inhabitant)_RYB14.png)
_(kg_per_inhabitant)_RYB14.png)
_(kg_per_inhabitant)_RYB14.png)


_RYB17.png)
_RYB2016.png)
_RYB19.png)
_(scale,_0%E2%80%9310)_RYB15.png)
.png)
.png)
.png)
.png)
_(thousand_tonnes)_YB15.png)
.png)
_YB15.png)
.png)