Tutorials
Log in
Statistics Explained
menu
search
search
Navigation
Main page
Statistical themes
Glossary
Categories
Statistics 4 beginners
Tutorials
Help
Eurostat home
Education corner
Online publications
Regional yearbook
Sustainable development
Full list
Tools
Special pages
search
Navigation
Main page
Statistical themes
Glossary
Categories
Statistics 4 beginners
Tutorials
Help
Eurostat home
Education corner
Online publications
Regional yearbook
Sustainable development
Full list
Tools
Special pages
Navigation
Main page
Statistical themes
Glossary
Categories
Statistics 4 beginners
Tutorials
Help
Eurostat home
Education corner
Online publications
Regional yearbook
Sustainable development
Full list
Tools
Special pages
File list
This special page shows all uploaded files.
File list
Items per page:
20
50
100
250
500
Search for media name:
Username:
Include old versions of files
Go
First page
Previous page
Next page
Last page
Date
Name
Thumbnail
Size
User
Description
Versions
11:59, 30 April 2009
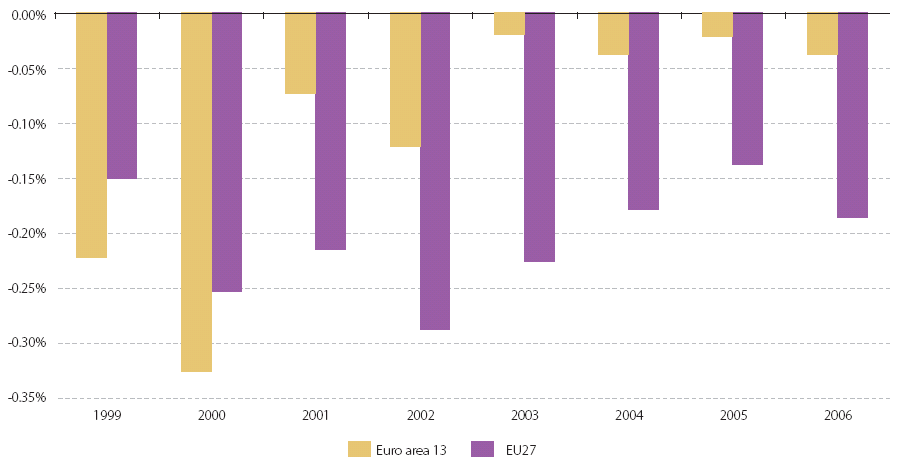
Adjustment of GDP due to the balancing process.PNG
(
file
)
26 KB
Maintenance script
Importing image file
1
11:59, 30 April 2009
Air passenger transport in EU-27 share by type of transport in 2007.PNG
(
file
)
11 KB
Maintenance script
Importing image file
1
11:59, 30 April 2009
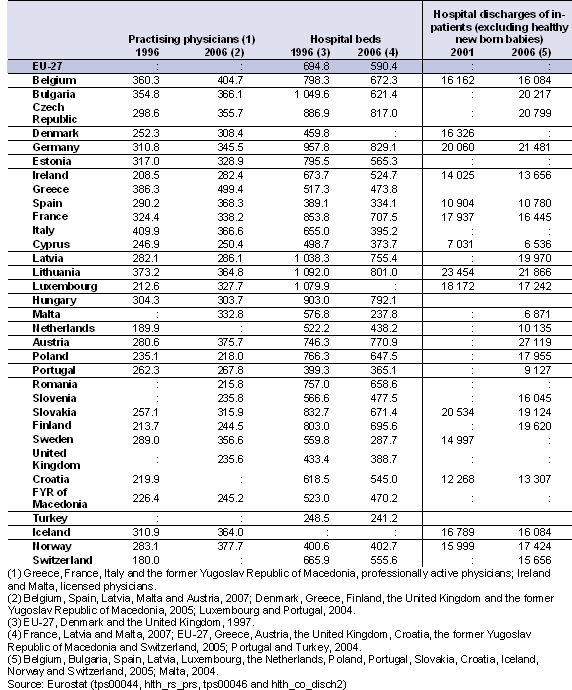
Healthcare indicators (per 100 000 inhabitants).PNG
(
file
)
40 KB
Maintenance script
Importing image file
1
11:59, 30 April 2009
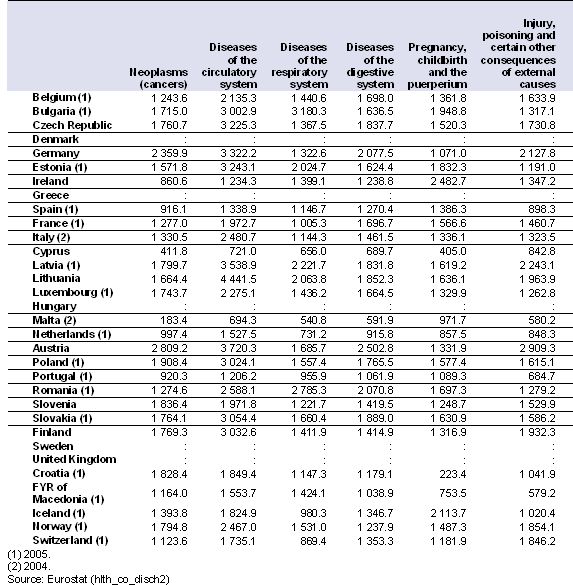
Hospital discharges of in-patients by diagnosis (ISHMT - international shortlist for hospital morbidity tabulation), 2006 (per 100 000 inhabitants).PNG
(
file
)
33 KB
Maintenance script
Importing image file
1
11:59, 30 April 2009
Minimum wages in EU Member States and Turkey.PNG
(
file
)
65 KB
Maintenance script
Importing image file
1
11:59, 30 April 2009
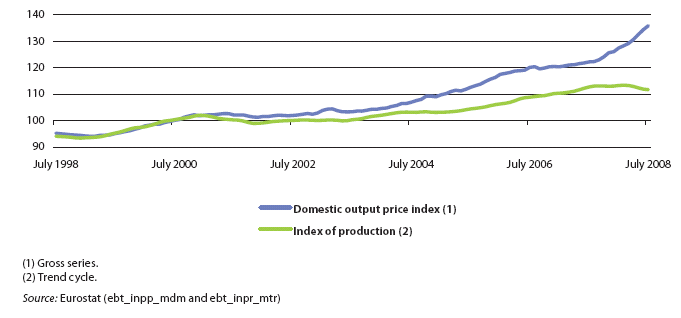
Production and domestic output price indices for industry, EU-27(2000=100).PNG
(
file
)
18 KB
Maintenance script
Importing image file
1
11:59, 30 April 2009
20090304104329!Gross value added at basic prices, EU-27, 2007 (1) (% share of total gross value added).PNG
(
file
)
6 KB
Maintenance script
Importing image file
1
11:59, 30 April 2009
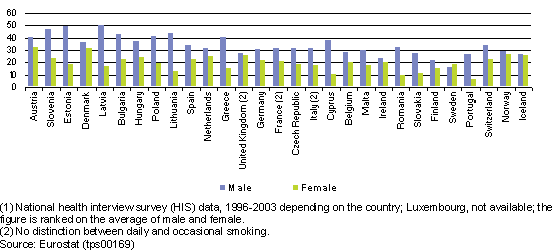
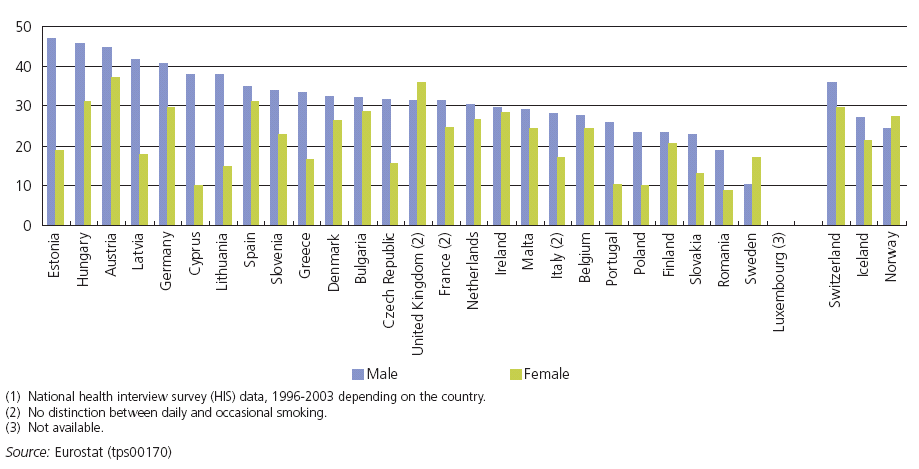
Daily smokers, 2003 (1) (% of male female population).PNG
(
file
)
10 KB
Maintenance script
Importing image file
1
11:59, 30 April 2009
GDP per inhabitant, in PPS, by NUTS 2 regions, 2005In percentage of the EU-27 average (EU-27 = 100).PNG
(
file
)
54 KB
Maintenance script
Importing image file
1
11:59, 30 April 2009
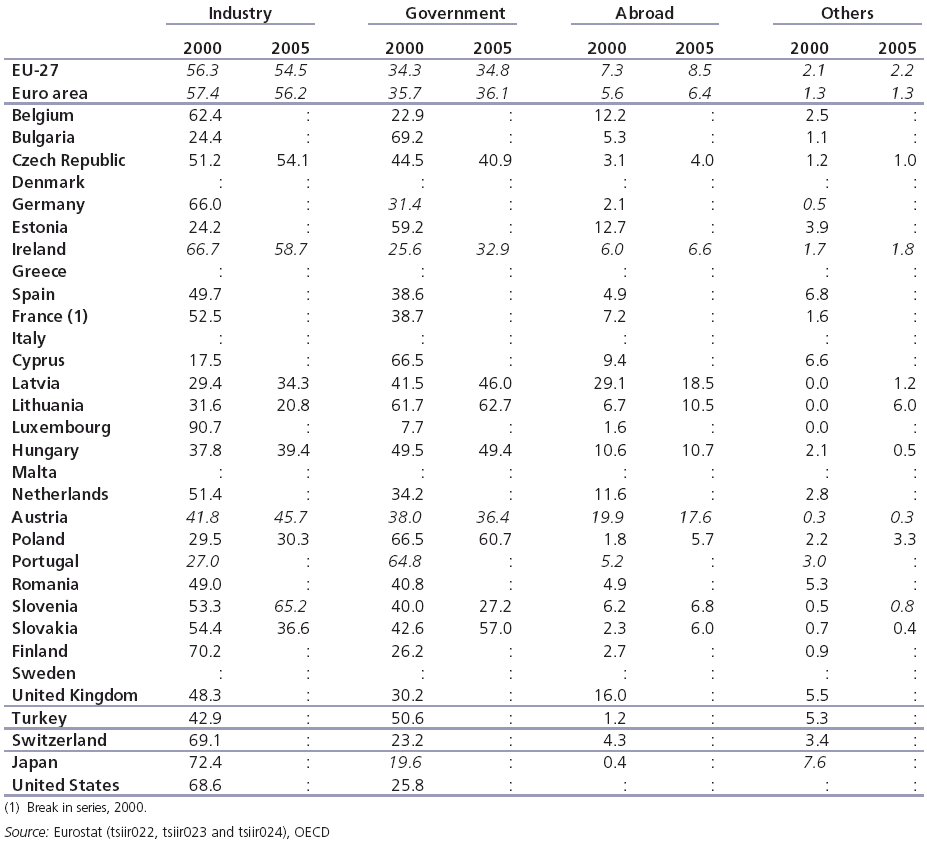
Gross domestic expenditure on R&D by source of funds.PNG
(
file
)
81 KB
Maintenance script
Importing image file
1
11:59, 30 April 2009
Population and population projections (EUROPOP2008 convergence scenario)(million).PNG
(
file
)
44 KB
Maintenance script
Importing image file
1
11:59, 30 April 2009
Weighted emissions of acidifying substances, by sector, EU-27, 2005 (1)(%, based on acid equivalents).PNG
(
file
)
16 KB
Maintenance script
Importing image file
1
11:59, 30 April 2009
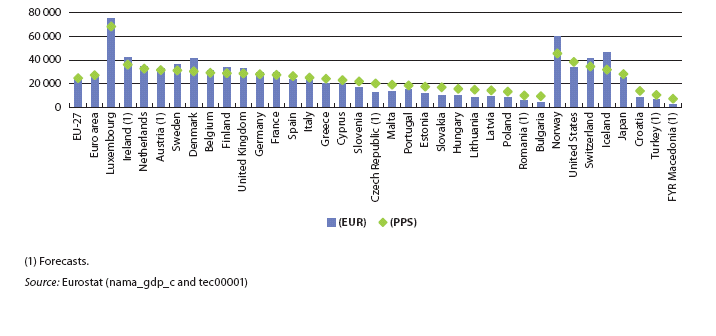
20090304152555!GDP per capita at current market prices, 2007.PNG
(
file
)
25 KB
Maintenance script
Importing image file
1
11:59, 30 April 2009
Comparative price levels (1) (fi nal consumption by private households including indirect taxes, EU-27=100).PNG
(
file
)
88 KB
Maintenance script
Importing image file
1
11:59, 30 April 2009
Daily smokers among the population aged 15-24, 2003 (1).PNG
(
file
)
40 KB
Maintenance script
Importing image file
1
11:59, 30 April 2009
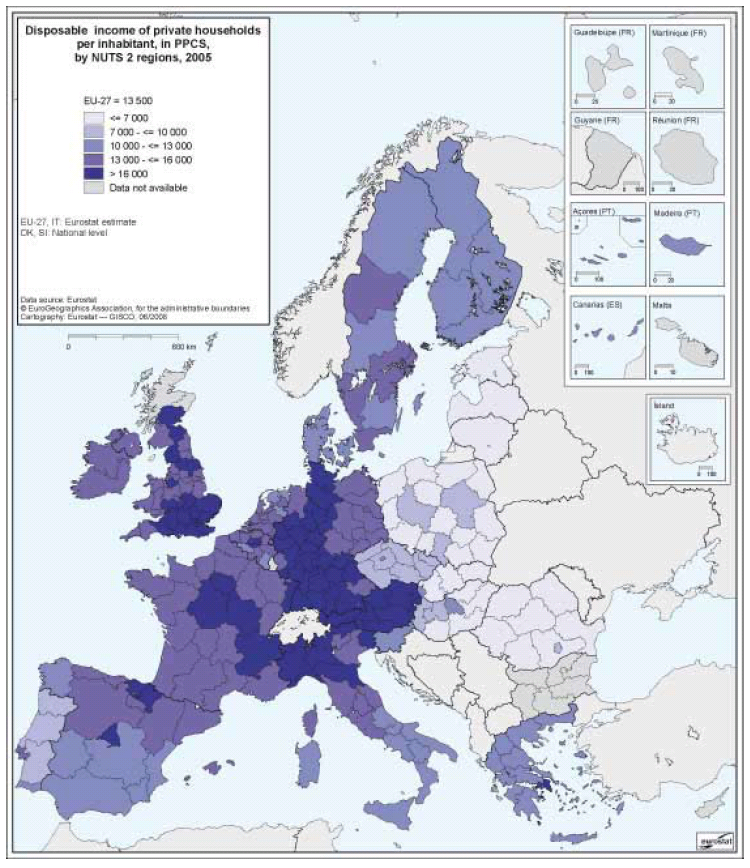
Disposable income of private households per inhabitant, in PPCS, by NUTS 2 regions, 2005.PNG
(
file
)
434 KB
Maintenance script
Importing image file
1
11:59, 30 April 2009
Energy dependency rate, EU-27(% of net imports in gross inland consumption and bunkers, based on tonnes of oil equivalent).PNG
(
file
)
15 KB
Maintenance script
Importing image file
1
11:59, 30 April 2009
Farm labour force, 2005.PNG
(
file
)
129 KB
Maintenance script
Importing image file
1
11:59, 30 April 2009
Life expectancy at 65, 2006 (1)(years).PNG
(
file
)
23 KB
Maintenance script
Importing image file
1
11:59, 30 April 2009
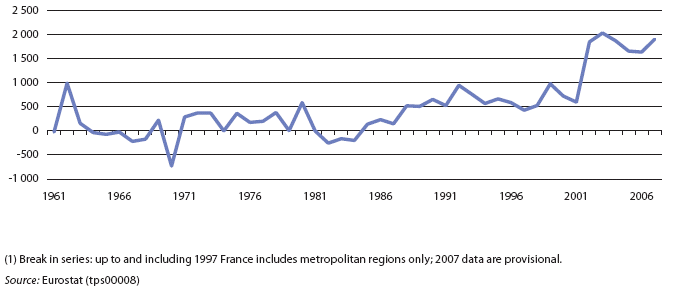
Net migration (including corrections), EU-27 (1)(1 000).PNG
(
file
)
18 KB
Maintenance script
Importing image file
1
11:59, 30 April 2009
Pupil-teacher ratio in primary, lower and upper secondary education (1).PNG
(
file
)
119 KB
Maintenance script
Importing image file
1
11:59, 30 April 2009
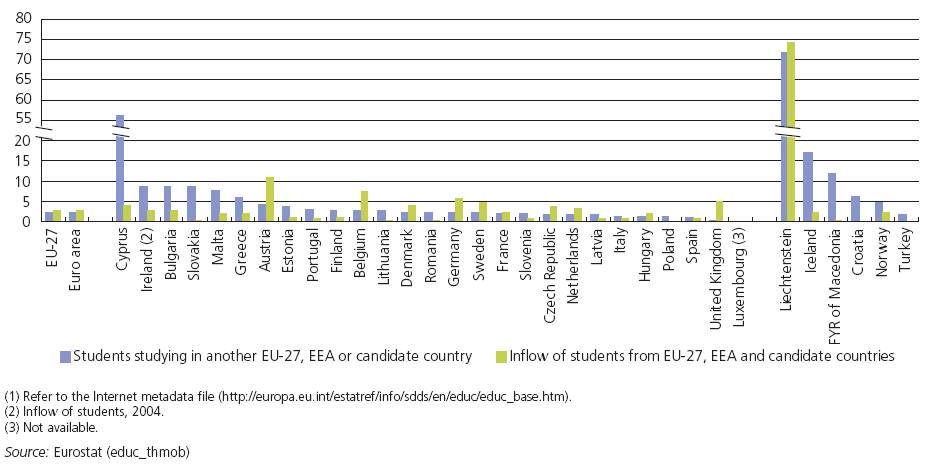
Student mobility in tertiary education, 2005 (1).PNG
(
file
)
39 KB
Maintenance script
Importing image file
1
11:59, 30 April 2009
Tax rate on low wage earners- tax wedge on labour cost, 2006 (%).PNG
(
file
)
20 KB
Maintenance script
Importing image file
1
11:59, 30 April 2009
Total catches in all fishing regions(1 000 tonnes live weight).PNG
(
file
)
77 KB
Maintenance script
Importing image file
1
11:59, 30 April 2009
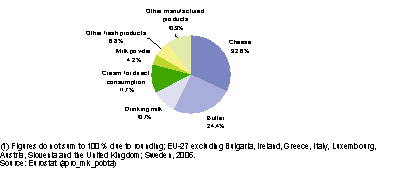
Utilisation of milk, EU, 2007(%) (1).PNG
(
file
)
5 KB
Maintenance script
Importing image file
1
11:59, 30 April 2009
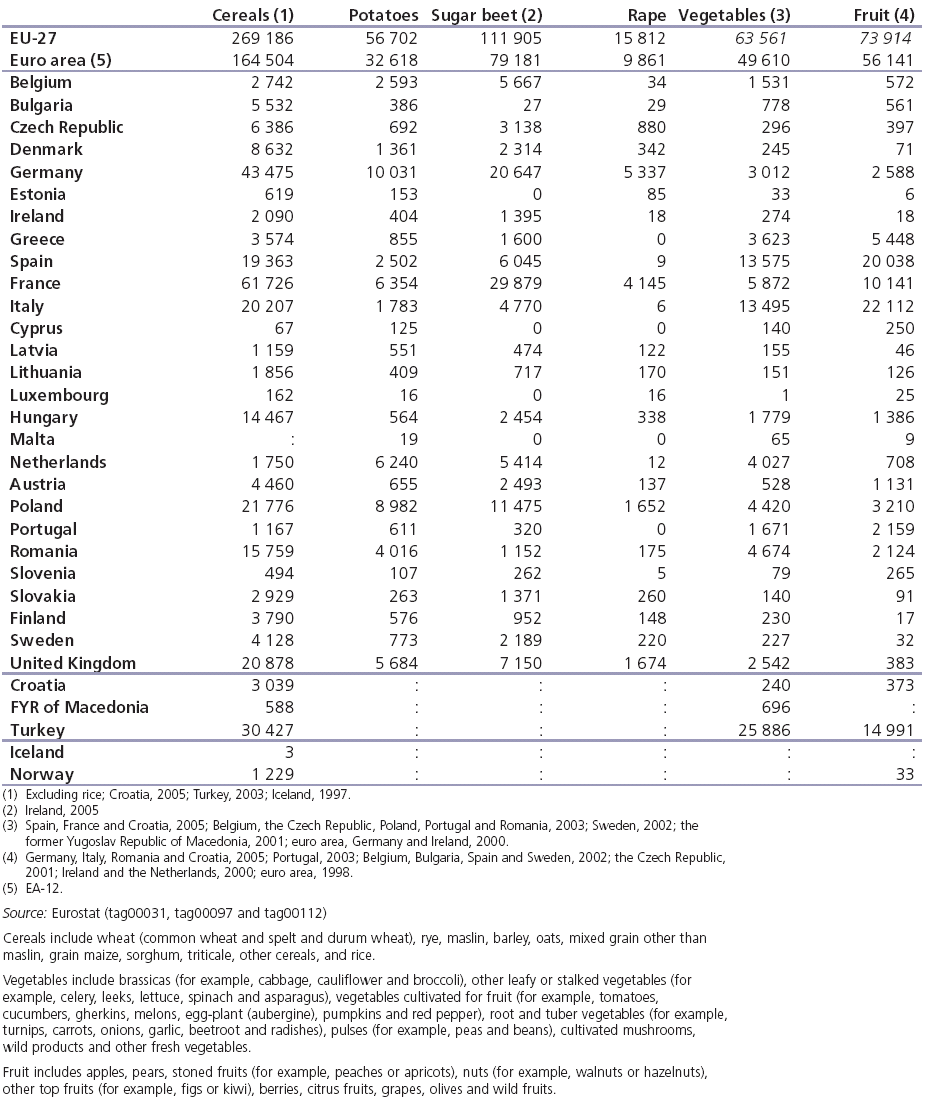
Agricultural production of crops, 2006.PNG
(
file
)
141 KB
Maintenance script
Importing image file
1
11:59, 30 April 2009
Consumption expenditure and gross capital formation at constant prices, EU-27.PNG
(
file
)
17 KB
Maintenance script
Importing image file
1
11:59, 30 April 2009
GVA per person employed and sector share of total GVA, in the EU-15 and 12 new Member States (NMS), 2005 Percentage.PNG
(
file
)
12 KB
Maintenance script
Importing image file
1
11:59, 30 April 2009
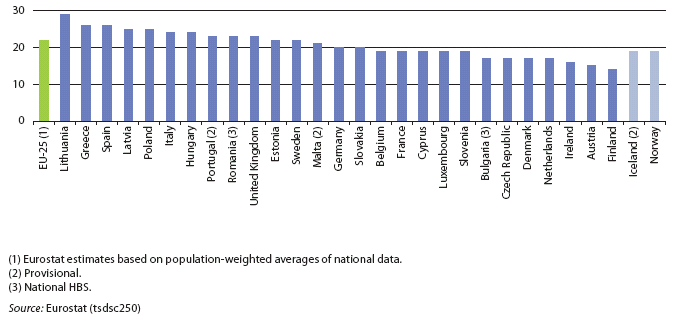
Relative median at-risk-of-poverty gap, 2006(%).PNG
(
file
)
21 KB
Maintenance script
Importing image file
1
11:59, 30 April 2009
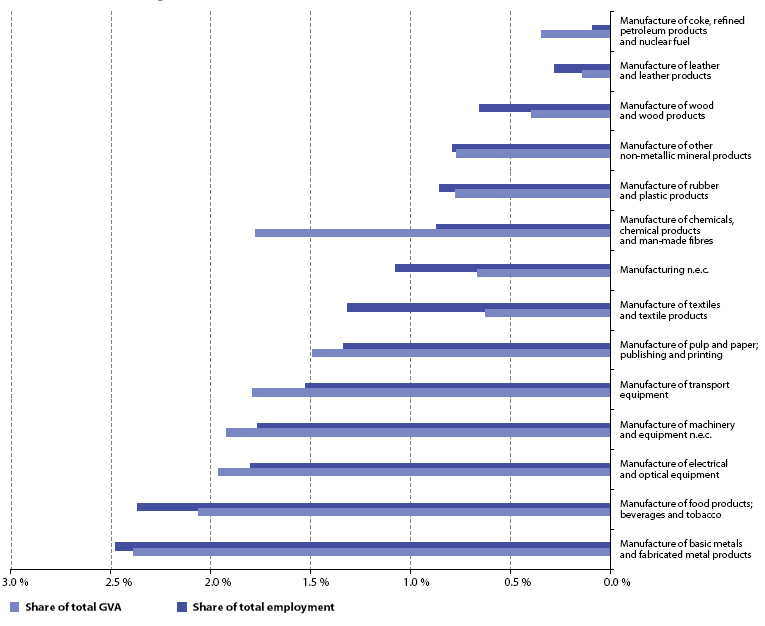
Share of GVA and employment in manufacturing (NACE D), 2005 Percentage.PNG
(
file
)
37 KB
Maintenance script
Importing image file
1
11:59, 30 April 2009
Total aquaculture production(1 000 tonnes live weight).PNG
(
file
)
65 KB
Maintenance script
Importing image file
1
11:59, 30 April 2009
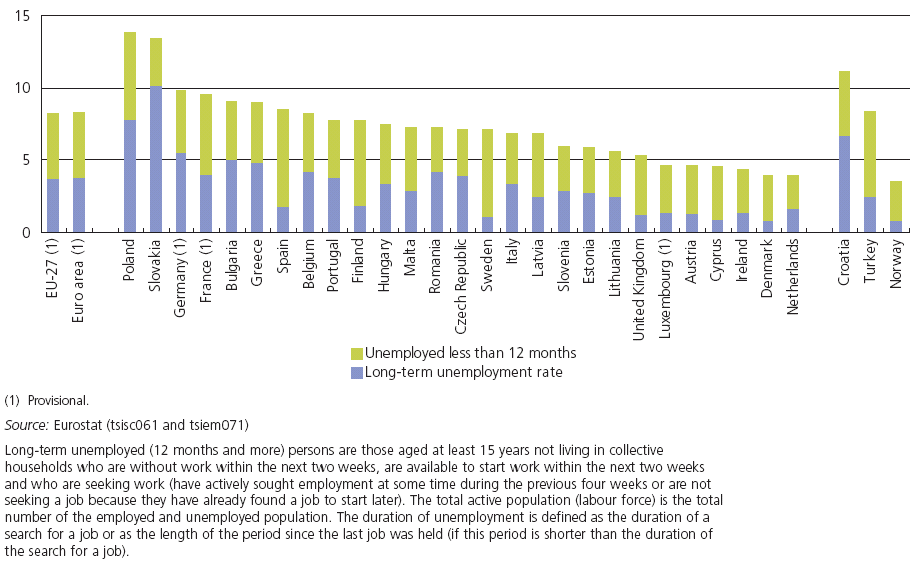
Unemployment rates by duration, 2006.PNG
(
file
)
60 KB
Maintenance script
Importing image file
1
11:59, 30 April 2009
Agricultural output and value added (EUR million).PNG
(
file
)
20 KB
Maintenance script
Importing image file
1
11:59, 30 April 2009
Breakdown of labour costs, business economy, 2006 (1).PNG
(
file
)
11 KB
Maintenance script
Importing image file
1
11:59, 30 April 2009
Expenditure on care for elderly, 2005 (1)(% of GDP).PNG
(
file
)
24 KB
Maintenance script
Importing image file
1
11:59, 30 April 2009
Maastricht criterion rates, annual average for 2007.PNG
(
file
)
41 KB
Maintenance script
Importing image file
1
11:59, 30 April 2009
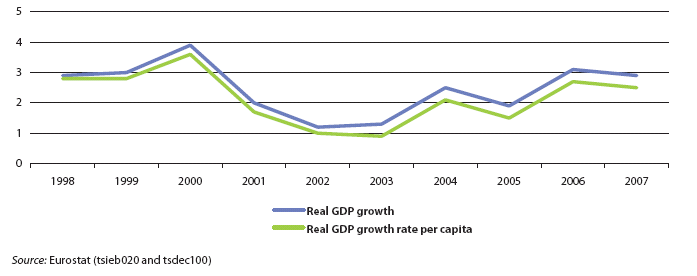
Real GDP growth, EU-27 (% change compared with the previous year)).PNG
(
file
)
16 KB
Maintenance script
Importing image file
1
11:59, 30 April 2009
Regional business concentration, weight of the five largest activities (NACE divisions) in total nonfinancial business economy employment, by NUTS 2 regions, 2005 Percentage.PNG
(
file
)
452 KB
Maintenance script
Importing image file
1
11:59, 30 April 2009
Resource productivity (GDP per DMC).PNG
(
file
)
28 KB
Maintenance script
Importing image file
1
11:59, 30 April 2009
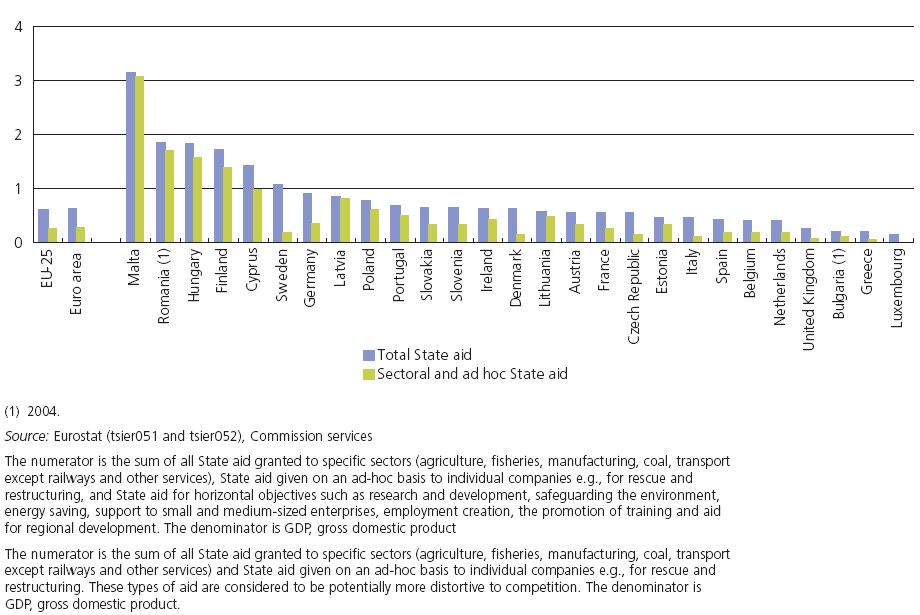
State aid, 2005.PNG
(
file
)
62 KB
Maintenance script
Importing image file
1
11:59, 30 April 2009
Value added by enterprise size class, mining and quarrying and manufacturingactivities, EU-27, 2005 (1)(% of sectoral total).PNG
(
file
)
39 KB
Maintenance script
Importing image file
1
11:59, 30 April 2009
20090303130830!GDP per capita at current market prices, 2007.PNG
(
file
)
7 KB
Maintenance script
Importing image file
1
11:59, 30 April 2009
Evolution of defl ated price indices of agricultural output and means of agricultural production, 2002-07(average annual growth rate, %).PNG
(
file
)
22 KB
Maintenance script
Importing image file
1
11:59, 30 April 2009
Incidence of serious accidents at work, by gender, 2005 (1) (1998=100, based on the number of serious accidents per 100 000 persons employed).PNG
(
file
)
7 KB
Maintenance script
Importing image file
1
11:59, 30 April 2009
Science and technology graduates.PNG
(
file
)
106 KB
Maintenance script
Importing image file
1
11:59, 30 April 2009
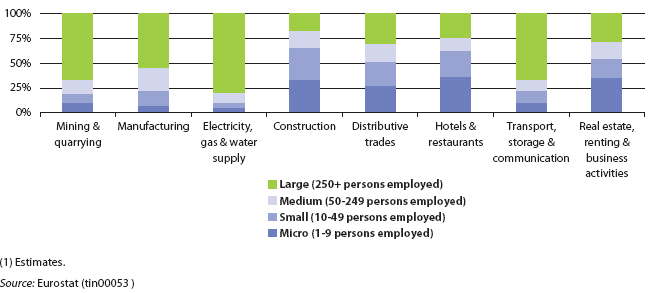
Value added by enterprise size class, EU-27, 2005 (1)(% of sectoral total).PNG
(
file
)
20 KB
Maintenance script
Importing image file
1
11:59, 30 April 2009
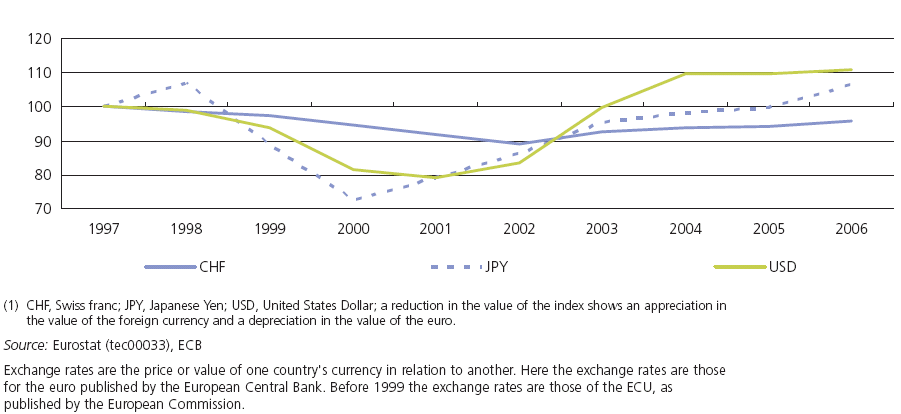
20090304140335!Exchange rates against the euro (1).PNG
(
file
)
36 KB
Maintenance script
Importing image file
1
11:59, 30 April 2009
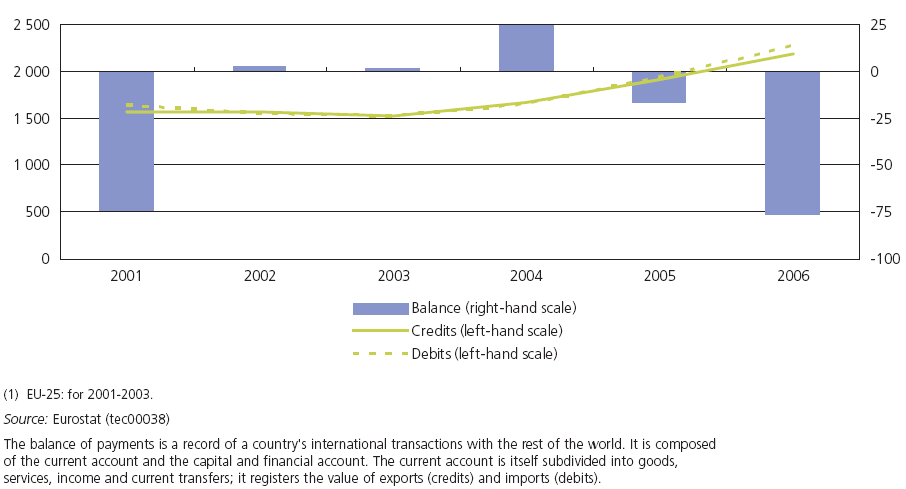
Current account transactions, EU-27 (1).PNG
(
file
)
35 KB
Maintenance script
Importing image file
1
11:59, 30 April 2009
Final energy consumption by transport mode, 1990-2004.PNG
(
file
)
38 KB
Maintenance script
Importing image file
1
11:59, 30 April 2009
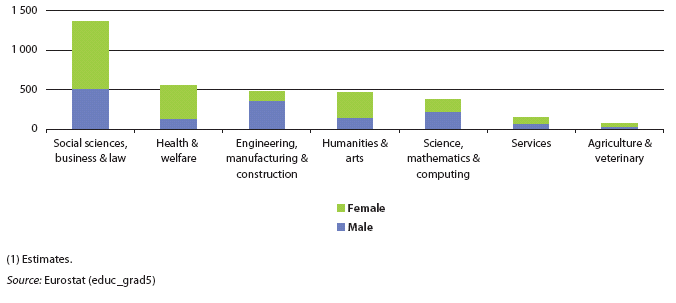
Graduates from tertiary education, by fi eld of education and gender, EU-27, 2006 (1)(1 000).PNG
(
file
)
14 KB
Maintenance script
Importing image file
1
First page
Previous page
Next page
Last page
Special page
ISSN 2443-8219


.PNG)
,_2006_(per_100_000_inhabitants).PNG)

.PNG)
_(%25_share_of_total_gross_value_added).PNG)
_(%25_of_male_female_population).PNG)
.PNG)

(million).PNG)
(%25,_based_on_acid_equivalents).PNG)

_(fi_nal_consumption_by_private_households_including_indirect_taxes,_EU-27%3D100).PNG)
.PNG)


(years).PNG)
,_EU-27_(1)(1_000).PNG)
.PNG)
.PNG)
.PNG)
.PNG)
_(1).PNG)


.PNG)
,_2005_Percentage.PNG)
.PNG)

.PNG)
.PNG)
(%25_of_GDP).PNG)

).PNG)
_in_total_nonfinancial_business_economy_employment,_by_NUTS_2_regions,_2005_Percentage.PNG)
.PNG)

(%25_of_sectoral_total).PNG)

.PNG)
_(1998%3D100,_based_on_the_number_of_serious_accidents_per_100_000_persons_employed).PNG)

(%25_of_sectoral_total).PNG)
.PNG)
.PNG)

(1_000).PNG)
.PNG)
,_2005_Percentage.PNG)