Tutorials
Log in
Statistics Explained
menu
search
search
Navigation
Main page
Statistical themes
Glossary
Categories
Statistics 4 beginners
Tutorials
Help
Eurostat home
Education corner
Online publications
Regional yearbook
Sustainable development
Full list
Tools
User contributions
Logs
View user groups
Special pages
search
Navigation
Main page
Statistical themes
Glossary
Categories
Statistics 4 beginners
Tutorials
Help
Eurostat home
Education corner
Online publications
Regional yearbook
Sustainable development
Full list
Tools
User contributions
Logs
View user groups
Special pages
Navigation
Main page
Statistical themes
Glossary
Categories
Statistics 4 beginners
Tutorials
Help
Eurostat home
Education corner
Online publications
Regional yearbook
Sustainable development
Full list
Tools
User contributions
Logs
View user groups
Special pages
Uploads by Corselo
This special page shows all uploaded files.
File list
Items per page:
20
50
100
250
500
Search for media name:
Username:
Include old versions of files
Go
First page
Previous page
Next page
Last page
Date
Name
Thumbnail
Size
Description
Versions
10:52, 30 March 2015
Tutorial editor text.PNG
(
file
)
11 KB
1
16:32, 25 March 2015
Sample page1.JPG
(
file
)
97 KB
3
16:31, 25 March 2015
Sample page3.JPG
(
file
)
32 KB
Reverted to version as of 12:47, 23 March 2015
4
14:53, 23 March 2015
Capture categories.png
(
file
)
3 KB
1
14:53, 23 March 2015
Capture themes.png
(
file
)
32 KB
1
14:49, 23 March 2015
Sample page2.JPG
(
file
)
3 KB
3
12:43, 20 March 2015
Capture SE article.PNG
(
file
)
97 KB
2
17:10, 18 March 2015
Dashboard Overall life satisfaction.png
(
file
)
368 KB
2
17:07, 18 March 2015
Eurostat logo RGB 60.jpg
(
file
)
7 KB
2
16:06, 18 March 2015
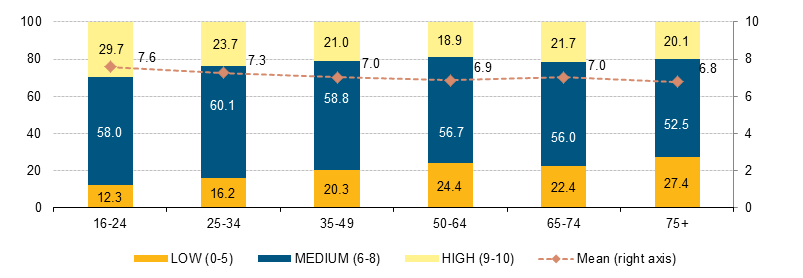
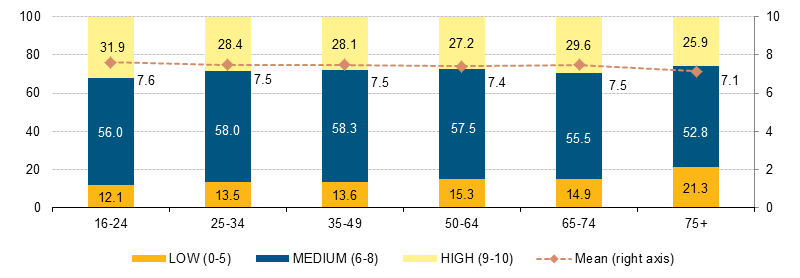
Life satisfaction by age group, EU-28, 2013 (left axis % population by satisfaction level; right axis mean rating).png
(
file
)
18 KB
1
16:05, 18 March 2015
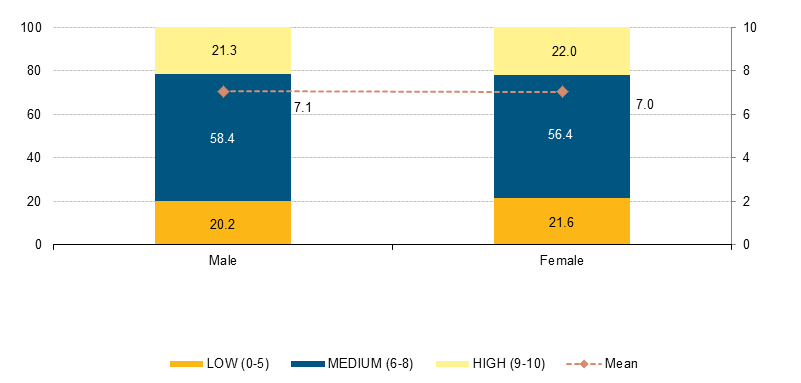
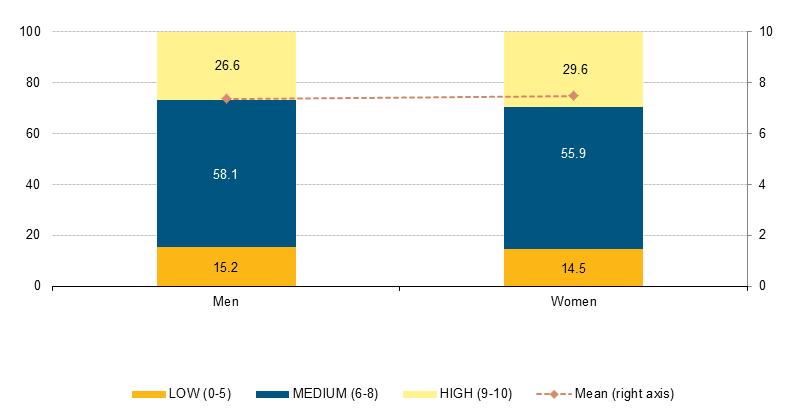
Life satisfaction by gender, EU-28, 2013 (left axis % population by satisfaction level; right axis mean rating).png
(
file
)
11 KB
1
15:17, 17 March 2015
Happiness by Overall life satisfaction, EU-28, 2013.png
(
file
)
13 KB
1
18:17, 13 March 2015
Gross social protection benefits subject to taxes and or social contributions by type of benefit, EU-28 (1), 2011 (% Gross expenditure).png
(
file
)
17 KB
2
18:15, 13 March 2015
Net expenditure on social protection benefits by type of benefit, EU-28 (1), 2011 (% Gross expenditure).png
(
file
)
12 KB
2
18:13, 13 March 2015
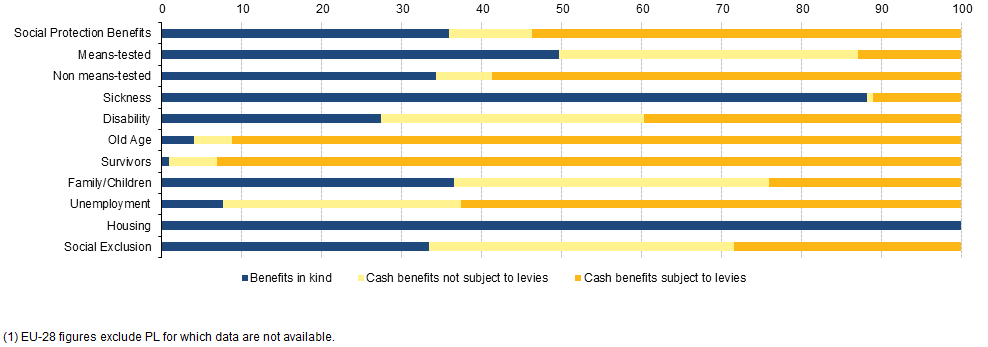
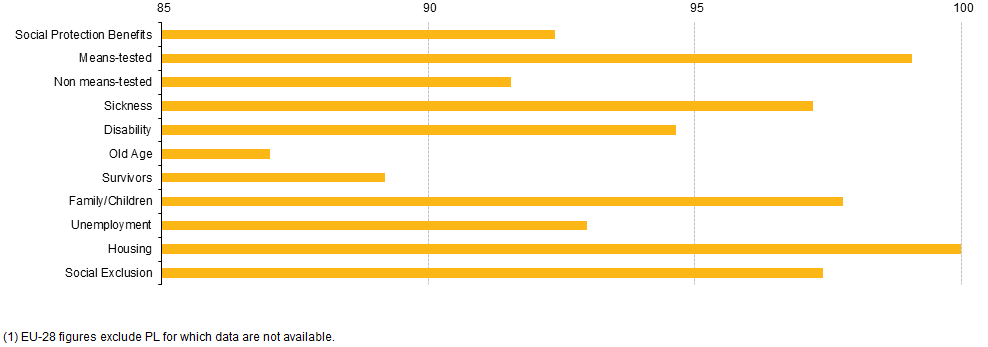
Gross social protection benefits subject to taxes and or social contributions, 2011 (% Gross expenditure on social protection benefits).png
(
file
)
35 KB
2
14:53, 13 March 2015
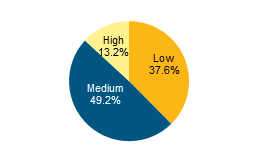
Life satisfaction, EU-28, 2013 (% population by satisfaction level).png
(
file
)
8 KB
1
12:43, 12 March 2015
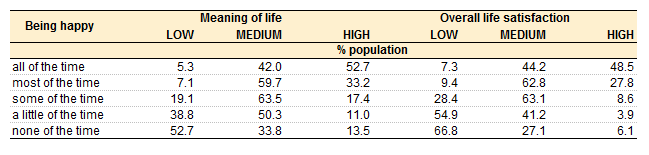
Meaning of life and life satisfaction by happiness (% population).png
(
file
)
8 KB
1
12:42, 12 March 2015
Happiness by Overall life satisfaction, EU-28, 2013 2.png
(
file
)
13 KB
1
12:42, 12 March 2015
Frequency of being happy in the last 4 weeks by labour status, EU-28, 2013.png
(
file
)
21 KB
1
12:41, 12 March 2015
Frequency of being happy in the last 4 weeks by age group, EU-28, 2013.png
(
file
)
13 KB
1
12:39, 12 March 2015
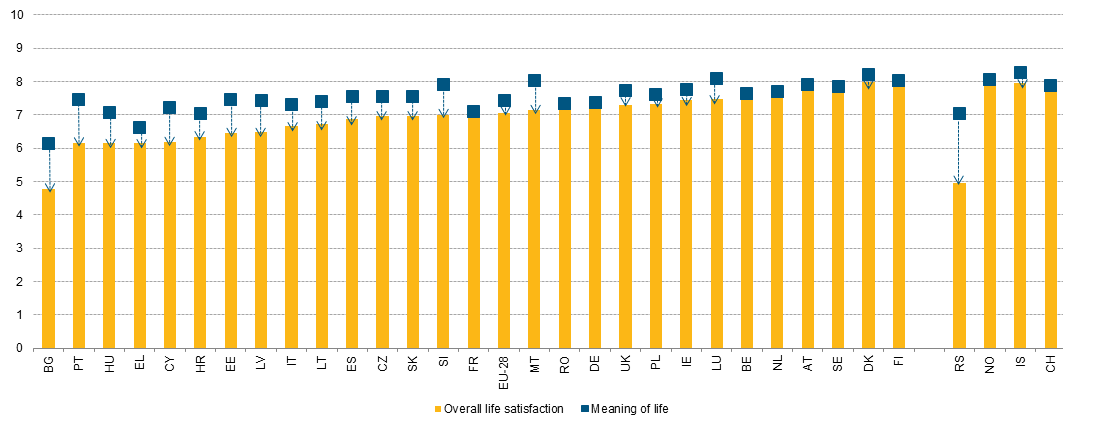
Life satisfaction and meaning of live, by country, 2013.png
(
file
)
40 KB
1
12:32, 12 March 2015
Meaning of life by age groups, EU-28, 2013 .png
(
file
)
16 KB
1
12:32, 12 March 2015
Meaning of life by gender, EU-28, 2013 .png
(
file
)
12 KB
1
12:30, 12 March 2015
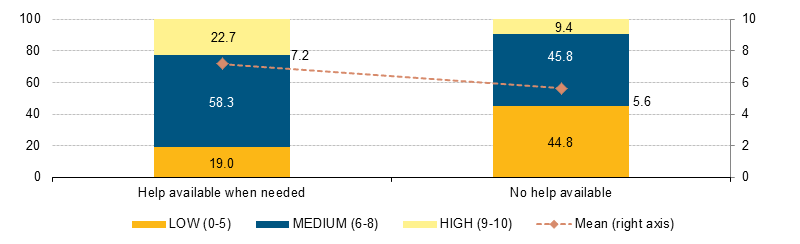
Life satisfaction by supportive social relationships, EU-28, 2013.png
(
file
)
12 KB
1
12:29, 12 March 2015
Life satisfaction by risk of povery, EU-28, 2013.png
(
file
)
12 KB
1
12:29, 12 March 2015
Life satisfaction by material (deprivation) status , EU-28, 2013.png
(
file
)
12 KB
1
12:28, 12 March 2015
GDP per capita and overall life satisfaction, EU-28 and countries, 2013 .png
(
file
)
16 KB
1
12:25, 12 March 2015
Life satisfaction by income tercile, EU-28, 2013 .png
(
file
)
13 KB
1
12:24, 12 March 2015
Life satisfaction by labour status, EU-28, 2013.png
(
file
)
21 KB
1
12:24, 12 March 2015
Life satisfaction (left bar) by household type, EU-28, 2013 (left axis % population by satisfaction level; right axis mean rating).png
(
file
)
27 KB
1
12:22, 12 March 2015
Life satisfaction by age group and country (mean rating).png
(
file
)
31 KB
1
12:20, 12 March 2015
Life satisfaction by country, 2013 (left axis % of population, right axis mean rating).png
(
file
)
43 KB
1
13:32, 27 February 2015
Satisfaction with the financial situation of the household, by country, 2013 (left axis % population by satisfaction level - right axis mean rating).png
(
file
)
27 KB
1
13:13, 27 February 2015
Satisfaction with the financial situation of the household, EU-28, 2013, (% population by satisfaction level).png
(
file
)
5 KB
1
10:22, 22 January 2015
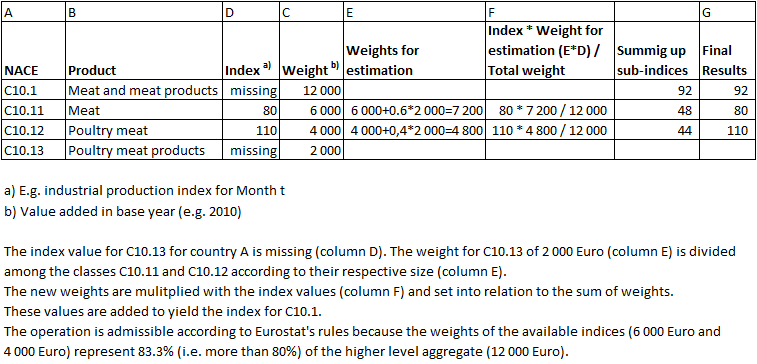
STS Estimation Method Example new.png
(
file
)
18 KB
1
16:46, 21 January 2015
STS Activity aggregation Simplified example.png
(
file
)
6 KB
2
16:42, 21 January 2015
STS Estimation Method Example2.png
(
file
)
18 KB
1
16:41, 21 January 2015
STS Activity aggregation Simplified example2.png
(
file
)
6 KB
1
16:43, 16 October 2014
Overview on changes between ESA 2010 and ESA 95 growth rates and levels new.png
(
file
)
14 KB
1
16:41, 16 October 2014
Overview on changes between ESA 2010 and ESA 95 growth rates and levels.png
(
file
)
14 KB
1
16:36, 16 October 2014
ESA 2010 versus ESA 95 GDP growth rates for EU-28 1997Q1 to 2014Q2.png
(
file
)
28 KB
1
16:30, 16 October 2014
ESA 2010 versus ESA 95 GDP growth rates for EA18 1997Q1 to 2014Q2.png
(
file
)
33 KB
1
14:06, 7 October 2014
EU-28, EA-18 and MS GDP growth rates 2014Q2.png
(
file
)
17 KB
1
11:20, 22 September 2014
Water use in industry new.xlsx
(
file
)
83 KB
1
11:18, 22 September 2014
Generation of wastewater by industry type, 2011 (million m³) new.png
(
file
)
31 KB
1
11:17, 22 September 2014
Public and self and other supply water use in the construction sector, 2002-2011 (million m³) new.png
(
file
)
19 KB
1
11:15, 22 September 2014
Self and other supply water use for energy production, 2006-2011 (m³ per inhabitant) new.png
(
file
)
13 KB
1
11:14, 22 September 2014
Water use in the manufacturing industry by supply category, 2003-11 (m³ per inhabitant) new.png
(
file
)
36 KB
1
11:11, 22 September 2014
Water use for mining and quarrying by supply category, 2002-11 (m³ per inhabitant) new.png
(
file
)
26 KB
1
11:09, 22 September 2014
Total water abstraction, share of surface water abstraction, by activity, 2011 (m³ per inhabitant; %) new.png
(
file
)
52 KB
1
First page
Previous page
Next page
Last page
Special page
ISSN 2443-8219


.png)
.png)

,_2011_(%25_Gross_expenditure).png)
,_2011_(%25_Gross_expenditure).png)
.png)
.png)


_status_,_EU-28,_2013.png)


_by_household_type,_EU-28,_2013_(left_axis_%25_population_by_satisfaction_level;_right_axis_mean_rating).png)
.png)
.png)
.png)
.png)


_new.png)
_new.png)
_new.png)
_new.png)
_new.png)
_new.png)
.png)