Tutorials
Log in
Statistics Explained
menu
search
search
Navigation
Main page
Statistical themes
Glossary
Categories
Statistics 4 beginners
Tutorials
Help
Eurostat home
Education corner
Online publications
Regional yearbook
Sustainable development
Full list
Tools
User contributions
Logs
View user groups
Special pages
search
Navigation
Main page
Statistical themes
Glossary
Categories
Statistics 4 beginners
Tutorials
Help
Eurostat home
Education corner
Online publications
Regional yearbook
Sustainable development
Full list
Tools
User contributions
Logs
View user groups
Special pages
Navigation
Main page
Statistical themes
Glossary
Categories
Statistics 4 beginners
Tutorials
Help
Eurostat home
Education corner
Online publications
Regional yearbook
Sustainable development
Full list
Tools
User contributions
Logs
View user groups
Special pages
Uploads by Diazfer
This special page shows all uploaded files.
File list
Items per page:
20
50
100
250
500
Search for media name:
Username:
Include old versions of files
Go
First page
Previous page
Next page
Last page
Date
Name
Thumbnail
Size
Description
Versions
16:46, 21 May 2024
Energy intensity of the economy, 2022, MAP2 (Gigajoule per thousand euro PPS).png
(
file
)
844 KB
2
16:39, 21 May 2024
Energy consumption per capita, 2022, MAP1 (Gigajoules per person).png
(
file
)
809 KB
2
16:27, 21 May 2024
Energy dependency by fuel, EU, in selected years, 1990-2022 Petajoule (PJ).png
(
file
)
88 KB
3
16:19, 21 May 2024
Gross available energy by fuel, EU, 1990-2022 Petajoule (PJ) F4.png
(
file
)
60 KB
2
16:05, 21 May 2024
Energy intensity of the economy, in selected years, 2012-2022 (kilogram of oil equivalent per € thousand).png
(
file
)
102 KB
2
15:59, 21 May 2024
Energy-Overview-Data-2022.xlsx
(
file
)
410 KB
4
15:56, 21 May 2024
Final energy consumption by sector, EU, 2022 (% of total, based on terajoules).png
(
file
)
37 KB
null
2
15:56, 21 May 2024
Final energy consumption by sector, EU, 1990-2022 Terajoules (TJ).png
(
file
)
47 KB
null
2
15:56, 21 May 2024
Final energy consumption by fuel, EU, 1990-2022 Petajoule (PJ).png
(
file
)
57 KB
null
2
15:56, 21 May 2024
Exports of selected energy products, EU, 1990-2022 Petajoule (PJ).png
(
file
)
73 KB
null
2
15:55, 21 May 2024
Structural shares of energy use in main categories of energy balances, EU, 1990-2022 (%).png
(
file
)
44 KB
null
2
15:55, 21 May 2024
Primary energy production by fuel, EU, in selected years, 1990-2022 Petajoule (PJ).png
(
file
)
84 KB
null
2
15:55, 21 May 2024
Non-energy consumption by fuel, EU, 1990-2022 Petajoule (PJ).png
(
file
)
54 KB
null
2
15:55, 21 May 2024
Imports of selected energy products, EU, 1990-2022 Petajoule (PJ).png
(
file
)
59 KB
null
2
15:55, 21 May 2024
Gross available energy per capita, 1990 and 2022 (Gigajoules per capita).png
(
file
)
94 KB
null
2
15:55, 21 May 2024
Gross available energy by fuel, EU, 1990-2022 Petajoule (PJ).png
(
file
)
65 KB
null
2
15:55, 21 May 2024
Gross available energy by fuel, 2022 (%).png
(
file
)
110 KB
null
2
15:55, 21 May 2024
Energy consumption by transport mode, EU, 1990-2022 (1990 = 100, based on terajoules).png
(
file
)
82 KB
null
2
14:28, 7 May 2024
Energy consumption per capita, 2022, MAP1 (Terajoules per person).png
(
file
)
735 KB
null
1
16:16, 21 December 2023
Renewable energy-tables and figures 2023-December.xlsx
(
file
)
112 KB
3
16:15, 21 December 2023
Figure 3-Share of energy from renewable sources for heating and cooling, 2022 (%).png
(
file
)
61 KB
2
10:48, 21 December 2023
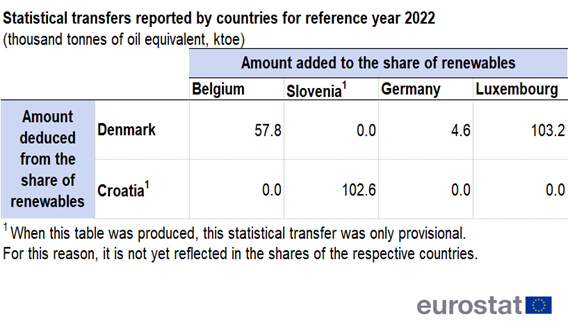
Table 1a-Statistical transfers reported by countries for reference year 2022 (thousand tonnes of oil equivalent, ktoe).png
(
file
)
89 KB
2
10:47, 21 December 2023
Figure 2-Share of energy from renewable sources in gross electricity consumption, 2022 (%).png
(
file
)
65 KB
2
18:21, 20 December 2023
Renewable energy 2022 infographic.jpg
(
file
)
667 KB
3
17:42, 20 December 2023
Table 4-Share of energy from renewable sources in transport, 2004-2022 (%).png
(
file
)
840 KB
1
17:42, 20 December 2023
Table 3-Share of energy from renewable sources for heating and cooling, 2004-2022 (%).png
(
file
)
921 KB
1
17:42, 20 December 2023
Table 2-Share of energy from renewable sources in gross electricity consumption, 2004-2022 (%).png
(
file
)
922 KB
1
17:41, 20 December 2023
Table 1-Overall share of energy from renewable sources, 2004-2022 (% of gross final energy consumption).png
(
file
)
904 KB
1
17:41, 20 December 2023
Figure 4-Share of energy from renewable sources in transport, 2022 (%).png
(
file
)
56 KB
1
17:39, 20 December 2023
Figure 1-Share of energy from renewable sources, 2022 (%).png
(
file
)
60 KB
1
10:42, 23 May 2023
Energy-Overview-Data-2021.xlsx
(
file
)
371 KB
2
10:37, 23 May 2023
Energy intensity of the economy, 2011-2016-2021 (kilogram of oil equivalent per € thousand).PNG
(
file
)
111 KB
2
10:33, 23 May 2023
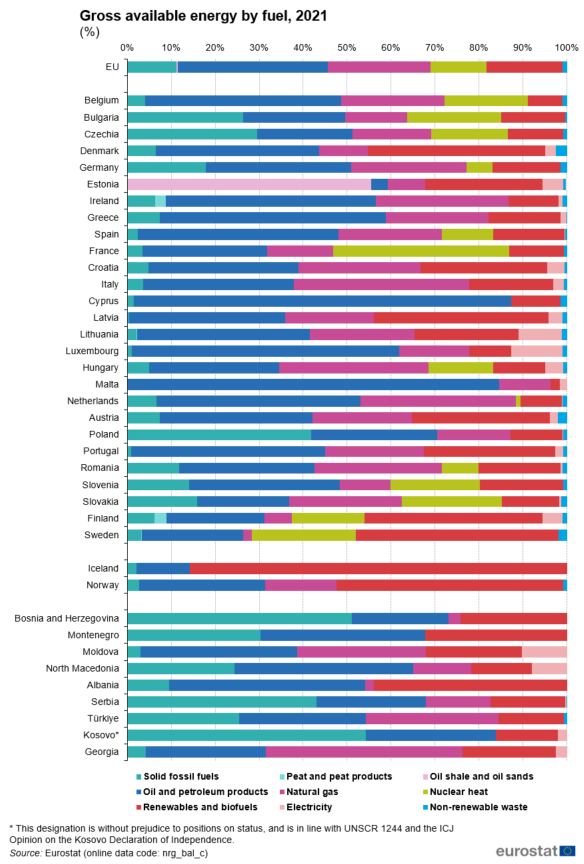
Gross available energy by fuel, 2021 (%) 23-05-2023.png
(
file
)
85 KB
2
17:18, 22 May 2023
Energy intensity of the economy, 2021, MAP2 (Gigajoule per thousand euro PPS).png
(
file
)
667 KB
1
17:17, 22 May 2023
Energy consumption per capita, 2021, MAP1 (Terajoules per person).png
(
file
)
668 KB
1
11:34, 15 May 2023
Structural shares of energy use in main categories of energy balances, EU, 1990-2021 (%).PNG
(
file
)
136 KB
1
11:33, 15 May 2023
Primary energy production by fuel, EU, in selected years, 1990-2021 Petajoule (PJ).PNG
(
file
)
157 KB
1
11:33, 15 May 2023
Gross available energy by fuel, EU, 1990-2021 Petajoule (PJ).PNG
(
file
)
150 KB
1
11:31, 15 May 2023
Non-energy consumption by fuel, EU, 1990-2021 Petajoule (PJ).PNG
(
file
)
114 KB
null
1
11:31, 15 May 2023
Imports of selected energy products, EU, 1990-2021 Petajoule (PJ).PNG
(
file
)
141 KB
null
1
11:31, 15 May 2023
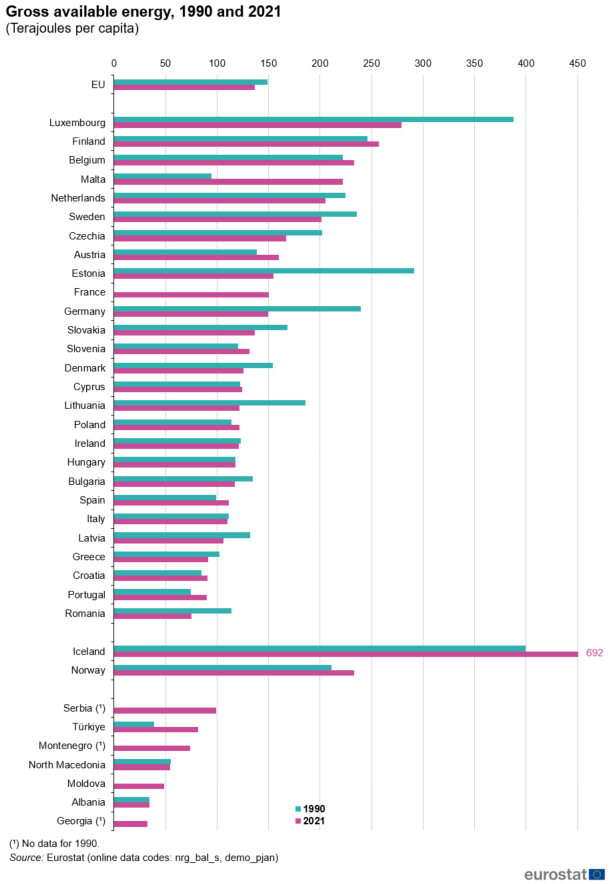
Gross available energy, 1990 and 2021 Terajoules per capita.PNG
(
file
)
72 KB
null
1
11:31, 15 May 2023
Gross available energy by fuel, EU, 1990-2021 Petajoule (PJ) Fig5.PNG
(
file
)
157 KB
null
1
11:31, 15 May 2023
Final energy consumption by sector, EU, 2021, (% of total, based on terajoules).PNG
(
file
)
79 KB
null
1
11:31, 15 May 2023
Final energy consumption by sector, EU, 1990-2021, Terajoules (TJ).PNG
(
file
)
133 KB
null
1
11:31, 15 May 2023
Final energy consumption by fuel, EU, 1990-2021 Petajoule (PJ).PNG
(
file
)
151 KB
null
1
11:31, 15 May 2023
Exports of selected energy products, EU, 1990-2021 Petajoule (PJ).PNG
(
file
)
156 KB
null
1
11:31, 15 May 2023
Energy dependency by fuel, EU, 1990-2021 Petajoules (PJ).PNG
(
file
)
124 KB
null
1
11:31, 15 May 2023
Energy consumption by transport mode, EU, 1990-2021 (1990 = 100, based on terajoules).PNG
(
file
)
163 KB
null
1
18:27, 3 March 2023
Renewable energy-tables and figures 2023-January.xlsx
(
file
)
123 KB
7
18:27, 3 March 2023
Table 1a Statistical transfers 2021.JPG
(
file
)
120 KB
3
First page
Previous page
Next page
Last page
Special page
ISSN 2443-8219
.png)
.png)
.png)
_F4.png)
.png)
.png)
.png)
.png)
.png)
.png)
.png)
.png)
.png)
.png)
.png)
.png)
.png)
.png)
.png)
.png)
.png)

.png)
.png)
.png)
.png)
.png)
.png)
.PNG)
_23-05-2023.png)
.png)
.png)
.PNG)
.PNG)
.PNG)
.PNG)
.PNG)

_Fig5.PNG)
.PNG)
.PNG)
.PNG)
.PNG)
.PNG)
.PNG)
