Migrant integration statistics - over-qualification
Data extracted: July 2023.
Planned article update: July 2024.
Highlights
In 2022, the over-qualification rate was 39.4 % for non-EU citizens and 31.8 % for citizens of other EU countries. By contrast, the over-qualification rate for nationals of the country they live in stood at 21.1 %.
In 2022, over-qualification rates in the EU were higher for older persons (aged 35-64 years) than for younger persons (aged 20-34 years) among non-nationals, while among nationals the over-qualification rate was lower for older persons.
Over-qualification rates in the EU in 2022 were higher for women than for men both among non-nationals (38.5 % vs. 33.4 %) and nationals (21.8 % vs. 20.4 %).
Over-qualification rate for persons aged 20–64 years, analysed by citizenship, EU, 2013–2022
This article presents European Union (EU) statistics for over-qualified employed persons from the point of view of their citizenship and birth place. Since 2023 is the European Year of Skills, these statistics help to inform how persons with migrant background compare with citizens or native-born persons in terms of skills and their successful participation in the labour market.
The information presented in the article generally refers to people aged 20–64 years. Over-qualified employed people are persons with a tertiary level of educational attainment (hereafter referred to as tertiary-educated persons) working in low- or medium-skilled occupations. This may also be referred to as a 'vertical' skills mismatch.
This article forms part of an online publication on migrant integration statistics.
Full article
Overview of the over-qualification rate by citizenship and country of birth
The labour force survey (LFS) is the source of data for this article. The main focus of this article is the age group 20–64 years. This age group is of particular interest as it is at the centre of employment analyses in the Action Plan on Integration and Inclusion 2021–2027.
People need skills and qualifications to participate successfully in the labour force. Data on qualifications, measured by the highest level of educational attainment, are an important indicator of the skills offered in the labour market. Higher educational attainment is generally associated with better employment prospects.
In Figure 1, two labour market indicators – employment and unemployment rates – are presented along with the share of people with a tertiary level of education. These provide context for the rest of the article, which focuses on the over-qualification rate among employed persons.

(%)
Source: Eurostat (lfsa_pganedm), (lfsa_ergaedcob), (lfsa_ergaedn) and (lfsa_urganedm) and (ad hoc extraction from the labour force survey)
Among all native-born persons aged 20–64 years in the EU in 2022, 33.4 % were tertiary-educated persons. A lower share (32.5 %) was observed for persons born in other EU Member States, and an even lower share (28.7 %) was observed for persons born outside of the EU. An analysis by citizenship presents a similar picture, but with somewhat larger differences. This share ranged from 33.4 % for nationals, through 31.7 % for citizens of other EU Member States down to 25.4 % for non-EU citizens.
In the EU, employment rates of tertiary-educated persons in 2022 for the three categories of country of birth and citizenship had a similar pattern to the actual share of tertiary-educated persons: the highest rates were for native-born persons or nationals, rates were slightly lower for persons born in other EU Member States or citizens of other Member States, and were much lower for persons born outside of the EU or non-EU citizens.
The situation for unemployment rates of tertiary-educated persons was the opposite of that observed for employment rates. In the EU, unemployment rates of persons having tertiary education in 2022 were lowest for native-born persons or nationals, somewhat higher for persons born in another EU Member State or a citizen of another Member State, and even higher for persons born outside of the EU or non-EU citizens.
The rest of this overview section focuses on the over-qualification rate (see Box 1) when analysed by citizenship and by country of birth. After the overview section, the following two sections present more detailed information with extra analyses by age and by sex.
Box 1: over-qualification rate
The over-qualification rate is calculated for employed persons with a tertiary level of educational attainment (international standard classification of education (ISCED) levels 5–8). The rate shows the proportion of these people who are employed in a low- or medium-skilled occupation (international standard classification of occupations (ISCO) major groups 4–9). More information on tertiary education and low- or medium-skilled occupation is provided in the Data sources section of this article.

In general, tertiary-educated persons who are foreign-born or foreign citizens appear to have a less positive employment situation insofar as it is more likely (than for native-born persons or nationals) that their formal qualifications are not – or not fully – used in the labour market.
The range of values for over-qualification for native-born persons in the EU was small, from 19.7 % in 2013 to 20.7 % in 2022, see Figure 2. For foreign-born persons, this rate was more volatile, but consistently higher than for native-born persons.
- For persons born in other EU Member States, the rate ranged from 28.8 % to 31.5 %, with the lowest rate in the most recent year (2022) and peaks in 2014 and 2018. As such, this rate was 8–11 percentage points (pp) above that for native-born persons.
- For persons born outside of the EU, the rate ranged from 34.4 % to 38.9 %, with the lowest rate in 2021 and a peak in 2015. Overall, there was a clear downward trend. The over-qualification rate for persons born outside of the EU was 14–19 pp above the rate for native-born persons and 6–9 pp above the rate for person born in other EU Member States, with this difference narrowing in recent years.
When analysed by citizenship, a broadly similar pattern can be observed, albeit with larger differences between the three categories of citizenship and a faster decline between 2013 and 2022 in the over-qualification rate for non-EU citizens.
The latest situation (2022) can be seen in Figure 3, clearly showing a greater diversity in over-qualification rates when analysed by citizenship compared with the analysis by country of birth.

_31-07-2023.png)
Over-qualification rates varied between EU Member States, although with some quite common features. When analysed by country of birth (see Figure 4), the lowest over-qualification rate in 2022 was normally observed for native-born persons while the highest was normally observed for persons born outside of the EU. The only exceptions to this (among the 17 EU Member States for which complete and reliable data are available) were:
- Belgium and Greece, where the rate was lowest for persons born in other Member States,
- Germany and Ireland, where the rate was highest for persons born in other Member States.
Among all EU Member States with reliable data, the highest over-qualification rates in 2022 were in Spain (33.7 %) and Greece (31.6 %) for native-born persons, Spain (45.4 %) for persons born in other Member States, and Greece (59.1 %) for persons born outside of the EU. For all three categories, Luxembourg had the lowest over-qualification rate.
_31-07-2023.png)
When analysed by citizenship (see Figure 5), the lowest over-qualification rate in 2022 was normally observed for nationals while the highest was normally observed for non-EU citizens. The only exceptions to this (among the 14 EU Member States for which complete and reliable data are available) were:
- Belgium and Czechia, where the rate was lowest for citizens of other Member States,
- Germany, Ireland and the Netherlands, where the rate was highest for citizens of other Member States.
Among all EU Member States with reliable data, the highest over-qualification rates in 2022 were in Spain (34.5 %) and Greece (32.0 %) for nationals, Italy (48.8 %) and Cyprus (48.2 %) for citizens of other Member States, and Greece (73.8 %) and Italy (67.8 %) for non-EU citizens. For all three categories, Luxembourg had the lowest over-qualification rate.
Analysis of the over-qualification rate by age

Figures 6 and 7 provide an analysis for the full age range 20–64 years split into two parts: younger persons (aged 20–34 years) and older persons (35–64 years).
Over-qualification rates in the EU in 2022 were higher for older than for younger persons among foreign-born and non-nationals, while among native-born persons and nationals the over-qualification rate was higher for younger people. In 2022, both age groups displayed a similar pattern when analysed by country of birth or by citizenship, with the lowest rates for native-born persons and nationals and the highest rates for persons born outside of the EU and non-EU citizens.

(percentage points; rate for other EU or non-EU born/citizens minus rate for native-born/nationals)
Source: Eurostat (online data codes: lfsa_eoqgac and lfsa_eoqgan)
Nevertheless, the differences in over-qualification rates among the various categories were greater for older people than for younger people (see Figure 7).
- The difference in over-qualification rates between native-born persons and persons born outside of the EU was 8.6 pp for younger people and 16.4 pp for older people.
- The difference in over-qualification rates between nationals and non-EU citizens was 10.2 pp for younger people while this gap was more than twice as wide (23.4 pp) for older people.

Figure 8 focuses on the over-qualification rate for younger people. It compares the rates for nationals with non-nationals, the latter covering both citizens of other EU Member States and non-EU citizens.
In 2022, the over-qualification rate was lower for younger nationals than for younger non-nationals in the EU and in each of the EU Member States (for which data are available and reliable) except France. The largest differences between nationals and non-nationals in terms of their over-qualification rates for younger persons were recorded in Cyprus (27.4 pp) and Italy (21.8 pp). A similar difference was observed in Norway (19.9 pp) and a notably higher difference in Iceland (30.5 pp). The only negative difference was observed in France (-0.5 pp), with small positive differences, all below 5.0 pp, being observed in Belgium, Ireland and Luxembourg. A similarly small difference was also observed in Switzerland.
In the EU, the over-qualification rate for younger nationals was 23.8 % compared with 32.5 % for younger non-nationals. These rates for the EU are indicated by the two brown lines in Figure 8.
- In most EU Member States, over-qualification rates for younger nationals and non-nationals were either both below the EU average or both above it.
- France was one exception, as the over-qualification rate for younger nationals was above the EU average while the rate for younger non-nationals was below the average.
- Denmark was also an exception with the reverse situation, as the over-qualification rate for younger nationals was below the EU average while the rate for younger non-nationals was above it. This situation was also observed in Iceland and Norway.

Figure 9 presents a similar analysis for older people. In 2022, the over-qualification rate in the EU and in each of the EU Member States (for which data are available and reliable) was lower for older nationals than for older non-nationals. The largest differences between nationals and non-nationals in terms of their over-qualification rates for older people were in Italy (47.1 pp) and Greece (27.7 pp). A large difference was also observed in Iceland. The smallest differences, all below 5.0 pp, were in Belgium and Luxembourg. A similarly small difference was also observed in Switzerland.
In the EU, the over-qualification rate for older nationals was 20.1 % compared with 38.0 % for older non-nationals. These rates for the EU are indicated by the two brown lines in Figure 9.
- In most EU Member States, over-qualification rates for older nationals and non-nationals were either both below the EU average or both above it.
- Belgium and Ireland were exceptions, as their over-qualification rates for older nationals were above the EU average while the rates for older non-nationals were below the average.
- Italy was also an exception with the reverse situation, as the over-qualification rate for older nationals was below the EU average while the rate for older non-nationals was above it. This situation was also observed in Iceland.
_31-07-2023.png)
The final analysis by age in this article compares over-qualification rates for younger and older non-nationals (see Figure 10).
In the EU, the over-qualification rate for older non-nationals was 38.0 %, some 5.5 pp higher than the 32.5 % rate for younger non-nationals. A total of 10 of the 14 EU Member States for which data are available and reliable also recorded a higher rate for older non-nationals than for younger non-nationals, with the largest differences in Italy and France. Among the four Member States where the rate was lower for older non-nationals, the largest difference was in Cyprus. Iceland and Norway also recorded small differences with lower rates for older non-nationals.
Analysis of the over-qualification rate by sex

The final section of this article returns the focus to the range of persons aged 20–64 years. Figures 11 and 12 provide an analysis by sex.
Over-qualification rates in the EU in 2022 were higher for women than for men regardless of country of birth and country of citizenship. In 2022, both sexes displayed a similar pattern of over-qualification rates in the EU when analysed by country of birth or by citizenship, with lower rates for native-born persons and nationals and higher for persons born outside of the EU and non-EU citizens (with the highest rate of 43.4 % observed for female non-EU citizens).

(percentage points; rate for other EU or non-EU born/citizens minus rate for native-born/nationals)
Source: Eurostat (online data codes: lfsa_eoqgac and lfsa_eoqgan)
Figure 12 shows the difference in shares compared with native-born persons (for the analysis by country of birth) or nationals (for the analysis by citizenship). In 2022, the differences in over-qualification rates among the various categories were more pronounced for women than for men.
- The difference in over-qualification rates between native-born persons and persons born outside of the EU was 12.6 pp for men and 15.6 pp for women.
- The difference in over-qualification rates between nationals and non-EU citizens was 15.5 pp for men while this gap was 21.6 pp for women.
_31-07-2023.png)
Figure 13 presents the comparison of over-qualification rates for male and female non-nationals.
In the EU, the over-qualification rate for female non-nationals was 38.5 %, some 5.1 pp higher than the 33.4 % rate for male non-nationals. A total of 15 of the 18 EU Member States for which data are available and reliable also recorded a higher rate for female non-nationals than for male non-nationals, with the largest differences in Cyprus and Malta. Among the three EU Member States where the rate was lower for female non-nationals, the largest difference was in Sweden. Iceland and Norway also recorded a lower rate for female non-nationals.

Figure 14: Over-qualification rate for employed women aged 20–64 years, analysed by citizenship, 2022
(%)
Source: Eurostat (lfsa_eoqgan)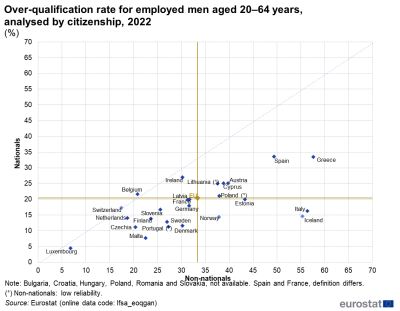
Figure 15: Over-qualification rate for employed men aged 20–64 years, analysed by citizenship, 2022
(%)
Source: Eurostat (lfsa_eoqgan)


Figure 14 focuses on the over-qualification rate for women. In 2022, the over-qualification rate in the EU and in each of the EU Member States (for which data are available and reliable) was lower for female nationals than for female non-nationals. The largest difference between nationals and non-nationals in terms of their over-qualification rates for women was in Italy (41.1 pp) while the smallest difference was in Luxembourg (4.7 pp).
In the EU, the over-qualification rate for female nationals was 21.8 % compared with 38.5 % for female non-nationals. These rates for the EU are indicated by the two brown lines in Figure 14.
- In most EU Member States, over-qualification rates for female nationals and non-nationals were either both below the EU average or both above it.
- Belgium and Ireland were exceptions, as the over-qualification rate for female nationals was above the EU average while the rate for female non-nationals was below the average.
- Estonia, Latvia, Malta and Portugal were also exceptions with the reverse situation, as their over-qualification rates for female nationals were below the EU average while their rates for female non-nationals were above it. This situation was also observed in Iceland.
Figure 15 presents a similar analysis for men. It compares the rates for nationals with those for non-nationals. In 2022, the over-qualification rate was lower for male nationals than for male non-nationals in the EU and in all EU Member States (for which data are available and reliable) except in Belgium.
- The largest difference between nationals and non-nationals in terms of their over-qualification rates for men was in Italy (40.1 pp). A larger difference was observed in Iceland (40.8 pp).
- The smallest differences, all below 5.0 pp, were in Belgium, Luxembourg, Ireland and the Netherlands.
In the EU, the over-qualification rate for male nationals was 20.4 % compared with 33.4 % for male non-nationals. These rates for the EU are indicated by the two brown lines in Figure 15.
- In most EU Member States, over-qualification rates for male nationals and non-nationals were either both below the EU average or both above it.
- Ireland and Belgium were exceptions, as their over-qualification rates for male nationals were above the EU average while their rates for male non-nationals were below the average.
- Estonia and Italy were also exceptions with the reverse situation, as their over-qualification rates for male nationals were below the EU average while their rates for male non-nationals were above it. This situation was also observed in Iceland and Norway.
Source data for graphs
Data sources
The data presented in this article are from the labour force survey (LFS), the largest household sample survey in the EU. The survey covers the resident population, defined as all people usually residing in private households. As such, persons living in collective households are excluded from the target population. Usual residence means the place where a person normally spends the daily period of rest, regardless of temporary absences for purposes of recreation, holidays, visits to friends and relatives, business, medical treatment or religious pilgrimage. The data for the EU are aggregated results for the 27 EU Member States. For more information on the data sources used, please consult the online publication EU labour force survey.
Due to the sampling nature of the survey, some data have low reliability or are not published due to very low reliability or confidentiality. Data that are of low reliability are duly marked in the footnotes below the figures and tables.
Main concepts
An employed person is someone aged 15–89 years who, during the reference week of the labour force survey, performed work – even if just for one hour a week – for pay, profit or family gain. Also included are people who were not at work but had a job or business from which they were temporarily absent. Employment can be measured in terms of the number of persons or jobs, in full-time equivalents or in hours worked. All the estimates presented in this article use the number of persons.
Educational attainment refers to the highest level of education successfully completed. Educational levels are defined and classified in the international standard classification of education (ISCED). The levels of education used in this article are based on ISCED 2011. A high level of educational attainment refers to ISCED levels 5–8 (tertiary education).
- ISCED level 5: short-cycle tertiary education
- ISCED level 6: bachelor's or equivalent level
- ISCED level 7: master's or equivalent level
- ISCED level 8: doctoral or equivalent level
For the calculation of the tertiary educational attainment share, the numerator refers to persons aged 20–64 years with a tertiary educational attainment (ISCED level 5-8). The denominator is the total population of the same age group, excluding respondents who did not answer the question 'highest level of education or training successfully completed'.
Occupations of employed persons are defined and classified in the international standard classification of occupations (ISCO). The occupations used in this article are based on ISCO-08. At the highest level, ISCO-08 is composed of 10 major groups. Low or medium-skilled occupations include the following major groups.
- Major group 4: clerical support workers
- Major group 5: services and sales workers
- Major group 6: skilled agricultural, forestry and fishery workers
- Major group 7: craft and related trades workers
- Major group 8: plant and machine operators and assemblers
- Major group 9: elementary occupations
As such, the occupations that are not considered to be low or medium-skilled are managers, professionals, technicians and associate professionals, and armed forces occupations.
Country notes
Spain and France have assessed the attachment to the job and included in employment those who, in their reference week, had an unknown duration of absence but expected to return to the same job once health measures allow it.
Calculation of rates
The rates calculated in this article exclude people classified in the not stated or unknown categories.
Context
Well-functioning labour markets depend largely on matching the skills and qualifications of the labour force to those sought by employers. Although some mismatches are inevitable (especially in rapidly developing sectors of the economy), high and persistent mismatches may be costly for employers, workers and society at large.
Education and skills mismatches are considered especially relevant for vulnerable groups, such as older workers, young people moving from education into work or migrants. One particular issue that impacts on non-EU citizens is (lower) recognition for their professional qualifications: EU citizens may benefit from initiatives such as the recognition of professional qualifications. Easier and more accessible recognition procedures, as well as opportunities for adult migrants to upgrade or equalise their qualifications, including access to lifelong learning, may help enhance the employability of migrants.
In November 2020, an Action Plan on Integration and Inclusion 2021–2027 (COM(2016) 377 final) was adopted with the purpose of fostering social cohesion and building inclusive societies for all. Inclusion for all is about ensuring that EU policies are accessible to and work for everyone, including migrants and EU citizens with a migrant background. This plan includes actions in four sectoral areas (education and training, employment and skills, health, and housing) as well as actions supporting effective integration and inclusion in all sectoral areas at the EU, Member State and regional levels, with a specific attention paid to young people.
2023 was announced as the European Year of Skills that aims to promote a mindset of reskilling and upskilling, helping people to get the right skills for relevant quality jobs.
More information on the policies and legislation in force in the area of migrant integration can be found here.
Direct access to
Migration
Online publications
Related articles
- Migrant integration statistics – employment conditions
- Migrant integration statistics – labour market indicators
- Migrant integration statistics – regional labour market indicators
Employment and unemployment
Related articles
Methodology
- LFS series - detailed annual survey results (lfsa)
- Population – LFS series (lfsa_pop)
- Employment rates - LFS series (lfsa_emprt)
- Total unemployment - LFS series (lfsa_unemp)
- Employment (mii_emp)
- Unemployment (mii_une)
- LFS series – Detailed annual survey results (ESMS metadata file – lfsa_esms)
- EU labour force survey