Merging statistics and geospatial information, 2015 projects - the Netherlands
This article forms part of Eurostat’s statistical report on Merging statistics and geospatial information: 2019 edition.
Final report September 2016
Full article
Problem
- Organisations (and parts thereof) responsible for various tabular datasets do not always have access to online map services or geoservices and are therefore not capable of making maps from these tables.
- The amount of tabular data from which one can make maps is huge in comparison with the need for maps. Creating maps in advance would be very costly and would make them less up-to-date. Therefore, maps produced from these tables need to be produced when required, rather than in advance.
- Semantic and technical harmonisation is needed in order to create maps across borders for the INSPIRE regulation for the themes covering population distribution and human health. In fact, this has already been done by means of SDMX services provided by Eurostat, but these tables cannot be viewed or downloaded into GIS systems. In order to do this efficiently one needs an online tool to join these tables to statistical units and create geoservices, which is missing at the moment.
Objectives
The objective of this project was to perform an impact analysis for a table joining service (TJS) in an environment comparable to the national infrastructure adopted by the Netherlands for the INSPIRE project to see if a TJS could solve (some of) the problems identified above.
Method
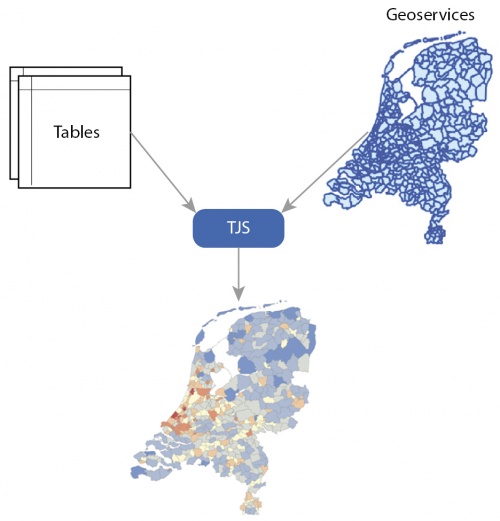
Statistical data and geographical information have become open and machine readable, although (within the Dutch context) an online tool that linked statistical table services to map services was missing. Such a tool should make it possible to create online statistical maps. This task could be facilitated by a table joining service (TJS): a TJS is an online service that links statistical tables to map services, reproducing what would otherwise be done by a geographic information system (GIS) specialist. The output can be a statistical map service or geoservice that can be saved as an image, or imported into online applications or GIS systems. A TJS connects to source data tables and so its output should be up-to-date and reflect the latest data available. As the output map is available on demand, there is no duplication of stored and published data, nor are maps produced that are not needed.
The project was based on machine readable open data from Statistics Netherlands, combined with a map service with open topographic data for statistical units.
Based on three scenarios, the project started with an inventory of possible functionalities. It then looked at the impact on potential hardware and software choices on geographical and tabular data and metadata, and on the organisations involved in the project (and other interested parties); this included a financial impact assessment.
Scenario 1: extensive scenario with a TJS plugin on GeoServer, fully supported by the GeoServer community and a client application that is fully maintained; this was the scenario which supports most functionalities.
Scenario 2: this scenario was the same as Scenario 1 but without a fully maintained client application.
Scenario 3: this scenario would be an implementation to fit the self-service environment foreseen by the Public Data on the Map (PDOK) consortium, implementing TJS standards within an Open Geospatial Consortium (OGC) TJS call to:
- upload tabular data and receive input about the connection between the tabular data and the geographic data needed for its presentation on a map;
- process data, converting it to the desired format and making a connection with the geographic data;
- create web features and web mapping services (WFS/WMS), making these services available.
Results
A number of conclusions were drawn from the impact assessment, including the following:
In the longer term it might be a good choice to stimulate the GeoServer community to accept the TJS plugin. The TJS specification was relatively new and was not widely used (at the time of the project). This made its implementation more difficult, as customised software was initially required. In addition, the specification for development needed some improvements, for example, to support warnings for mismatches. Finally, it was considered that there might be difficulties in stimulating the use of a TJS.
When implementing a TJS, it is essential to ensure that use is made of some precise standards. For example, even the difference between a lower and upper case character may cause issues when trying to join information. As a result, users may try to link tables to the wrong geometries; this is particularly an issue if administrative units change every year.
Furthermore, looking at the various scenarios, it was considered likely that some functionalities would be hard to implement, for example, the way a TJS should deal with mismatches and n:m relations; at the time of the project, the standard for a TJS did not appear to have options to deal with this issue efficiently.
Under the third scenario, poor performance with respect to developing web feature services for large datasets was also viewed as a barrier to the implementation of a TJS. Under the PDOK scenario, the system had a download limit of 15 000 records (at the time of writing), which meant that not all datasets were suitable for a TJS; the PDOK consortium was working on increasing this limit. The assessment also highlighted that web features and web mapping services from a TJS were temporary and that this could be considered as a weak point (as permanent results are sometimes required).
Finally, the assessments highlighted that geometric information should be available as open data (which is not always the case in Europe). It noted that a common European TJS might be envisaged as a cost effective way to achieve the goals from INSPIRE.
Direct access to
Methodology>
External links
Notes

