Merging statistics and geospatial information, 2012 projects - Greece
This article forms part of Eurostat’s statistical report on Merging statistics and geospatial information: 2019 edition.
Final report 17 June 2014
Full article
Problem
A lack of detailed information for the distribution of the resident population, as census data could only be georeferenced at territorial levels of variable sizes.
Objectives
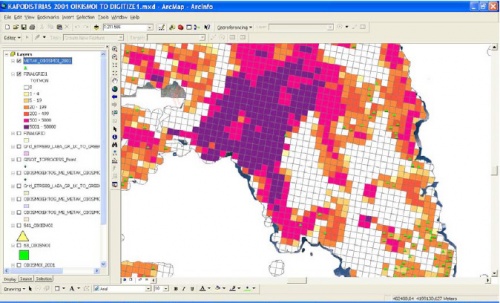
The first objective of the project was to develop a 1 km² population grid for Greece based on the 2001 census data and to put in place a system/infrastructure that could be used to treat information from the 2011 census exercise.
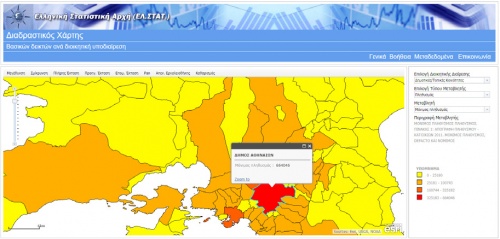
The second objective was to develop a web mapping application.
Method
In order to create a population grid based on 2001 data, the project foresaw using a bottom-up approach to create a more realistic depiction of the Greek resident population.
The census information did not include point data (information for buildings) and there was not a registry of buildings/addresses. Furthermore, data at the level of the census blocks were not available for all settlements. As a result, it was decided to focus on the creation of a 1 km² population grid, rather than any finer level of detail (for example, 500 m * 500 m or 250 m * 250 m).
The project used several sources of data: the Greek portion of the European population grid, census block polygons for 604 municipalities and a digitized polygon dataset showing the area of 12 092 inhabited settlements. Orthophotographs (aerial photographs) from the national cadastre and mapping agency were used for digitizing and Google Earth for verification purposes.
The data processing involved on one hand assigning data for census blocks to grid cells and on the other distributing data at the settlement level to appropriate grid cells.
- A correspondence table was compiled to match the codes used for the census block polygons and the codes used for the census blocks in the census data; these data were then matched to grid cells based on the centroids (geometrical centre) of each census block.
- For the distribution of settlement data the first step was to digitize the shapefiles for the settlement’s boundaries, using orthophotographs. The shapefiles were then overlaid with the grid layer and the census data for each settlement’s resident population was assigned to the related grid cells in a proportionate manner assuming a homogenous distribution of people within each settlement.
Combining the results of these two actions resulted in a grid cell dataset which covered 92.6 % of the total resident population. The European Environment Agency’s (EEA's) population density raster dataset (disaggregated with Corine Land Cover 2000) for the island of Crete were compared as a test case with the values calculated from this study and the differences were analysed.
A web mapping application was developed to map data for a wide range of administrative or statistical divisions of Greece, from regions down to local/municipal communities. A wide variety of statistical data were geo-referenced and entered into a database, including information on population, education, agriculture, construction, health and social protection, national accounts, tourism and the labour market. A geo-database was developed with spatial information linked to statistical data. Internationally recognised standards in the field of geospatial information — such as ISO standards and Open Geospatial Consortium standards — were adopted. The application is hosted and served from one of the Greek statistical office’s servers.
Results
Despite the deficiencies of the original data sets, a dataset for 1 km² grid cells was produced using the bottom-up estimation method. It is expected that a more accurate population dataset for grid cells can be produced from the 2011 census results which has a larger set of data referenced to census blocks. The web mapping application was designed to provide access to maps and to metadata as well as having a help function. A variety of tools were made available to users, for example to zoom in and out, to pan across the map as well as providing a previous and next area (similar to a back and forward feature of a browser). Users may select the administrative division they want to analyse, followed by a thematic category which then generates a list of available variables to select from. A map is then returned showing four classes (ranges) of data, along with a short text description and a legend defining the classes. Users can click on individual polygons to find precise values as well as the names of the selected administrative divisions.
Direct access to


