Merging statistics and geospatial information, 2015 projects - Latvia
This article forms part of Eurostat’s statistical report on Merging statistics and geospatial information: 2019 edition.
Final report February 2018
Full article
Problem
The Central Statistical Bureau of Latvia (CSB) received a number of requests from researchers asking for a longitudinal data set on population, preferably georeferenced at the level of individuals to enable analyses on migration and depopulation within certain areas of Latvia.
Objectives
The main objective of this project was the integration of geospatial and statistical information. Specifically, the objective was to geo-reference the results of the 2000 population and housing census (PHC), combine these data with the results from the 2011 census (which were already geo-referenced) and then create a longitudinal dataset suitable for an analysis of developments with respect to migration and depopulation. Internal and external processes required that a continuous (semi-) automated regular update of geospatial data sources should be established.
The second objective of the project was to illustrate how linking geographical and statistical information and corresponding metadata adds value and produces new statistics, in particular for an open data initiative.
Method
The 2000 PHC dataset contains information on the place of residence at the level of administrative territories, as well as address information. Optical character recognition (OCR) technology was used to digitise census forms and to prepare a dataset. OCR is known to introduce processing errors in address information (village, street, house name) which need to be eliminated to enable automatic record linking with the state address register information system (SARIS). During this stage, innovative methods were investigated to deal with OCR errors: for example, personal ID numbers were matched between the 2000 PHC and the 2000 population register, and probability was used to assess whether slightly different addresses in the two sources were likely or not to be the same, thereby making it possible to replace addresses with errors in the 2000 PHC dataset using the correct addresses from the 2000 population register. The experience gained through this activity was transferred to internal processes that were implemented for annual geo-referencing of data for the usually resident population and was implemented for the 2016 and 2017 reference years. The addresses in the datasets were then geo-referenced by linking with SARIS. Some problems occurred when addresses in the 2000 PHC dataset had only the village name in the field for the house name and there was a house with that same name: in these cases it was possible that many addresses could be linked to that one house name. A spatial analysis of 2000 and 2011 PHC as part of the quality check helped to identify these and other issues.
For manual linking purposes, alternative data sources were studied (historical data from SARIS, maps from Soviet times) and, where applicable, these were incorporated into an application for manual record linking. The use of an application enabled an operator to use several data sources, including spatial data in order to identify the location of a specific address. A total of 64 thousand addresses were linked manually, 49 thousand were linked exactly, around 5 thousand were linked to a near address, 10 thousand were linked to a village and in 158 cases it was concluded that an address could not be assigned.
As well as analysing the quality of addresses, an analysis was also made of other personal characteristics, such as working status, education level, knowledge of languages and housing conditions. Some of this information was poorly coded and could be linked to errors made by interviewers, while others were related to OCR problems. Many of the problems were identified by an analysis of maps, showing concentrations of outliers in particular areas. Because of data quality issues, it was decided not to publish the data on personal characteristics from the 2000 PHC dataset and only to disseminate variables from the population register.
Results
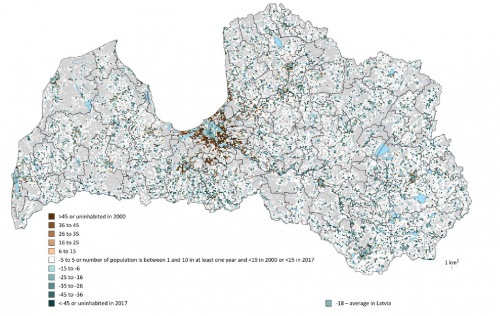
Based on the geo-referenced dataset, detailed grid data for population indicators from the 2000 and 2011 PHCs were prepared and published along with estimates for 2016 and 2017. The data published included spatial data for a 1 km² grid covering the whole of Latvia and a more detailed 100 m × 100 m grid for cities. Longitudinal tabular data for 2000, 2011, 2016 and 2017 were established, covering demographic indicators based on territorial borders as of 1 January 2018. With this, users could draw objective conclusions on migration and population change (since external factors such as border changes were excluded). A dataset for research was also developed.
Analysis of migration and depopulation data
The geocoded data for 2000 and 2017 were used to calculate local indicators of spatial association (LISA) for spatial autocorrelation detection at a local level and Getis-Ord Gi* statistics for the identification of hot and cold spots. Hot and cold spots for population change were identified for absolute changes using grid data, spatial clusters and outliers. For the whole of the Latvian territory these proved to be less informative than a bipolar choropleth map of relative changes in population, but they gave reasonable information if limited to smaller areas, like cities. During the analysis phase, issues related to data quality — such as processing and/or measurement errors — were discovered. Due to these errors and limits, a variety of different analyses were carried out, for example, a bivariate analysis of LISA to examine correlations across territorial units between the relative change in population and absolute change in average age. LISA and Getis-Ord Gi* statistics were also used to identify processing and measurement errors.
Direct access to
Methodology
External links

