Merging statistics and geospatial information, 2015 projects - Austria
This article forms part of Eurostat’s statistical report on Merging statistics and geospatial information: 2019 edition.
Final report October 2017
Full article
Problem
In this context, accessibility concerns the ease with which a good or a service (retail trade, education, health, security or leisure) may be reached by the resident population. In order to measure accessibility — defined here as the shortest distance between two points — it is necessary to have a set of grid-based data available at the level of individual buildings.
Objectives
The objective of this project was to model indicators of accessibility for the resident population with respect to public infrastructure and to produce a set of results that were grid-based datasets.
Method
The following datasets for infrastructure, demographic indicators and the road network were used.
The main data source for infrastructure was the census of enterprises and their local units of employment (LUE). Units were classified by economic activity and a building ID was also available. For education, school statistics and pre-school statistics were used as they had more detailed information (such as the type of institution). For some special topics, LUE data were cross-checked and if necessary complemented by other data sources with nationwide coverage and high quality, such as healthcare statistics from the Ministry of Health and Women’s Affairs and information on pharmacies from the Austrian chamber of pharmacists.
The register of buildings and dwellings (BDR) was the source for building coordinates and building IDs. This register was maintained by Statistics Austria and contained address details of land, buildings and dwellings and held structural data for buildings, dwellings and other usage units including XY coordinates for each address and building. Some coordinates had to be corrected, including, for example, obvious errors such as buildings that were located outside of Austria. A tool was used to match the information from this register with that from other sources; in special cases manual editing was performed. The result was a set of coordinates for all buildings with residents and a set of coordinates for all infrastructure facilities.
For socio-demographic data, register-based labour market statistics were used. These annual data refer to the situation on 31 October. Data were available for each building concerning the number of resident persons and their socio-demographic characteristics.
For the road network analysis a commercial source (derived from Tele Atlas) was used, including foreign roads in a buffer zone that extended about 50 km around Austria to guarantee the choice of sensible routes including journeys which may transit through neighbouring countries, to complete the information on accessibility for the whole of the Austrian territory, including special cases such as Alpine valleys that may only be reachable from outside of Austria. Some errors in the road network were corrected, for example for some missing minor roads. A speed model developed by Statistics Austria was applied to the road network.
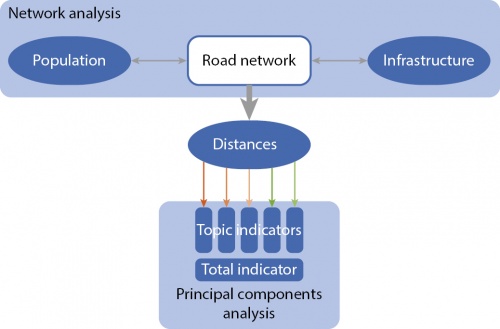
In a second stage, infrastructure facilities were grouped into five broad topics: retailing, education, health, security and leisure. The contents of the datasets were selected and consolidated to one or more data layers allocated to each topic. A total of 90 thousand infrastructure facilities were grouped into 21 layers for the five topics. Then, within a geographic information system (GIS), the quickest route along the road network by private car from a place of residence to the nearest facility was calculated and the time and distance recorded.
The results of this network analysis (distance and time per data layer) were then used as input for principal components analyses along with territorial unit codes (for buildings and three sizes of grid cells), the population by main residence and the assignment of infrastructure data layers to topics. The results were a set of indicators for each topic and each territorial unit as well as an overall (total) indicator for all topics, with indicator values ranging from 0 to 100.
Results
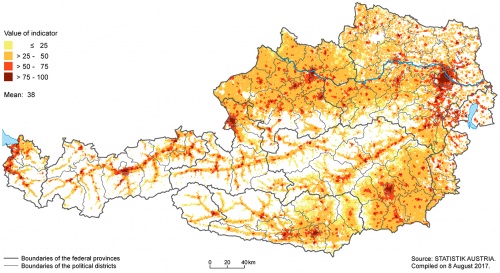
The project showed that the calculation of accessibility indicators (total as well as by topic) for public infrastructure at a grid level is possible and produces reasonable results. Indicators by topic showed clearly the differences in the distribution patterns for various types of infrastructure. Comparing the results with territorial classifications such as the urban-rural typology indicated many similarities.
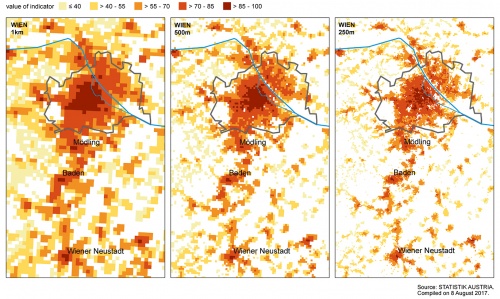
Tests done with smaller grid sizes (500 m*500 m or 250 m*250 m grid cells) showed similar but more distinct results which were particularly interesting for cities.
Direct access to
External links


