Archive:Living conditions in Europe - social participation and integration
Data extracted in November 2017
No planned update
Highlights
In 2016, almost 1 in 10 people aged 75 and over in the EU did not have someone with whom to discuss personal matters.
In 2016, 1 in 6 adults in the EU got together with family and relatives every day, while more than one quarter got together with friends on a daily basis.
Two thirds of young adults (16-24 years) in the EU used social media on a daily basis, compared with 6.8 % of the population aged 65-74 years and 2.2 % of the population aged 75 and over in 2015.

(%)
Source: Eurostat (ilc_scp13) and (ilc_scp14)
This article is part of a set of statistical articles that form Eurostat’s online publication, Living conditions in Europe. Each article helps provide a comprehensive and up-to-date summary of living conditions in Europe, presenting some key results from the European Union’s (EU’s) statistics on income and living conditions (EU-SILC), which is conducted across EU Member States, EFTA and candidate countries.
Full article
Policy context
At the Laeken European Council in December 2001, European heads of state and government endorsed a first set of common statistical indicators for social exclusion and poverty that are subject to a continuing process of refinement by the indicators sub-group (ISG) of the social protection committee (SPC). These indicators are an essential element in the open method of coordination (OMC) to monitor the progress made by EU Member States in alleviating poverty and social exclusion.
In 2013, the European Commission called on EU Member States to prioritise social investment, with a particular emphasis on active inclusion strategies and the impact this could have on one of five key Europe 2020 targets, namely, to lift at least 20 million people out of poverty and social exclusion.
Active participation in cultural and social life is thought to be closely linked with an individual’s quality of life, with growing importance given to cultural and social capital (in contrast to economic capital). Within this context, social participation and integration are increasingly viewed as being of significance, particularly for marginalised groups (such as migrants, the disabled or the elderly).
This article presents statistics on social participation and integration in the EU. All of the data are based on an ad-hoc module that forms part of the EU’s statistics on income and living conditions (EU-SILC). The module was implemented in 2015 and covered social/cultural participation and material deprivation; it collected a wide range of indicators covering areas such as participation in cultural and sporting events, interactions with relatives, friends and neighbours, or social participation (for example, unpaid charity work, helping others, or political activities).
Ad-hoc EU-SILC modules are developed each year in order to complement permanently collected variables with supplementary information that highlights unexplored aspects of social inclusion. The 2015 ad-hoc module included variables on social and cultural participation (15 variables) as well as variables on material deprivation (seven variables). These two topics were also covered by previous ad-hoc modules in 2006 (for social participation) and in 2009 and 2014 (for material deprivation).
The EU-SILC questionnaire on social and cultural participation was addressed to household members aged 16 and over and mostly covered a reference period of 12 months prior to the interview (note however, for some questions a different reference period was used, for example, the respondent’s usual or current situation).
Social participation
Active citizenship
Active citizenship describes people who decide to get involved in democracy at all levels, from local communities, through towns and cities to nationwide activities. Indeed, participative democracy requires people to get involved and to play an active role in political organisations or supporting various causes with a commitment to improve the welfare of society.
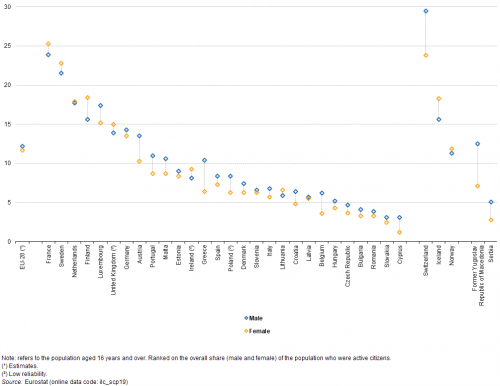
In 2015, the share of the EU-28 population aged 16 and over that participated in active citizenship was 11.9 %. A slightly higher share of men (12.2 %) compared with women (11.7 %) were active citizens, while working-age adults (25-64 years), people with a higher level of educational attainment (ISCED levels 5-8), people in the top income quintile, and people living in cities all tended to participate more than average in active citizenship (see Figure 1).
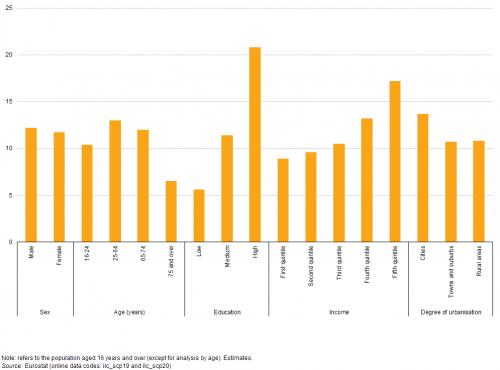
(%)
Source: Eurostat (ilc_scp19) and (ilc_scp20)
The EU Member States with the highest shares of active citizens were characterised by a high degree of female participation
Across the EU Member States, the share of active citizens peaked in 2015 in France (24.6 %), followed by Sweden (22.1 %), the Netherlands (17.8 %) and Finland (17.0 %); contrary to the results for the whole of the EU-28, a higher proportion of women (compared with men) were active citizens in each of these four Member States. There were only three other Member States where a higher proportion of women were active citizens in 2015, namely, Ireland, the United Kingdom and Lithuania (see Figure 2).
At the other end of the range, less than 5.0 % of the population in 2015 were active citizens in Belgium, Hungary, the Czech Republic, Bulgaria, Romania, Slovakia and Cyprus — which had the lowest proportion (2.1 %).
Active citizenship was most common among middle-aged people …
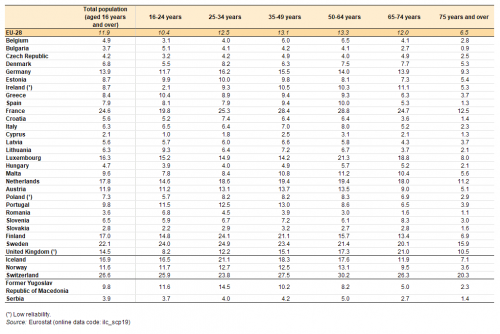
Table 1 provides information on the share of active citizens by age. In 2015, the share of the EU-28 population participating in active citizenship peaked at 13.3 % among those persons aged 50-64 years, while people aged 35-49 years had a share that was only slightly lower (13.1 %). Participation in active citizenship was lower at either end of the age spectrum, falling to 10.4 % among young adults (16-24 years) and to 6.5 % for the elderly (aged 75 years or more).
A closer analysis reveals that there was a very mixed pattern among the EU Member States: for example, the highest share of active citizens was recorded among young adults in Bulgaria, Romania, Lithuania and Greece, while the highest share of active citizens in the Czech Republic, Slovenia, Ireland and the United Kingdom was recorded among people aged 65-74 years.
… and among people with a high level of educational attainment
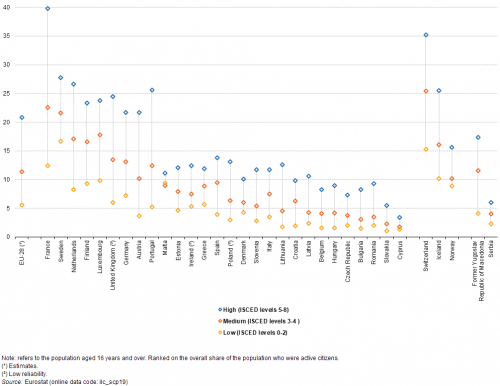
The share of active citizens generally increased as a function of an individual’s educational attainment (see Figure 3). In 2015, the share of active citizens among the EU-28 population with a low level of educational attainment (ISCED levels 0-2) was 5.6 %, rising to 11.4 % for those with a medium level of educational attainment (ISCED levels 3-4) and peaking at more than one in five (20.8 %) persons for those with a high level of educational attainment (ISCED levels 5-8). This pattern was reproduced in each of the EU Member States, with the exception of Malta, where a higher share (9.4 %) of people with a low level of educational attainment were active citizens, when compared with the corresponding share (9.0 %) for people with a medium level of educational attainment.
In 2015, the largest disparities in active citizenship between those subpopulations with high and low levels of educational attainment were observed in France (27.4 percentage points), Portugal (20.4 points), the United Kingdom (18.5 points) and the Netherlands (18.3 points).
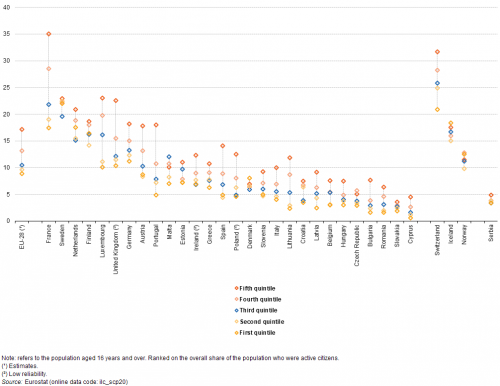
Figure 4 provides an analysis of active citizenship by income quintile. It reveals that a larger proportion of people with higher incomes were active citizens. For example, across the EU-28 some 17.2 % of the fifth quintile (the top 20 % of the population with the highest incomes) were active citizens in 2015. This share was almost double the value recorded for the lowest quintile (the bottom 20 % of the population with the lowest incomes), as just 8.9 % of this subpopulation were active citizens.
This pattern was reproduced in most of the EU Member States and in some cases the disparities were considerable: for example, the share of active citizens among those in the fifth income quintile was 7.5 times as high as the share for the bottom quintile in Cyprus, 5.0 times as high in Lithuania, 4.8 times as high in Bulgaria, and 4.0 times as high in Romania. By contrast, the share of active citizens in Denmark was higher for the bottom quintile (8.0 %) than it was for the fifth quintile (6.9 %); this pattern was repeated in both Iceland and Norway.
An analysis of active citizenship by household type and degree of urbanisation (see Table 2) reveals that in 2015 a relatively high proportion (17.1 %) of the EU-28 population aged 16 and over living in single person households and in cities were active citizens. This may reflect, at least to some degree, the development of community-led, grassroots activism in many urban centres (sometimes in response to the gentrification of neighbourhoods).
In 2015, active citizens accounted for more than one quarter of the adult population living in single person households in cities in in Sweden, France, the Netherlands and Finland; this pattern was also repeated in Switzerland.
People living in households composed of two adults with dependent children were generally less inclined to be active citizens. Nevertheless, more than a quarter of the adult population living in this type of household in France were active citizens; this was also the case in Switzerland. It is interesting to note that in the Czech Republic, Ireland, Luxembourg, Slovakia and the United Kingdom, the highest share of active citizens among people living in households composed of two adults with dependent children was recorded in rural areas; this pattern was repeated in Norway and Switzerland.
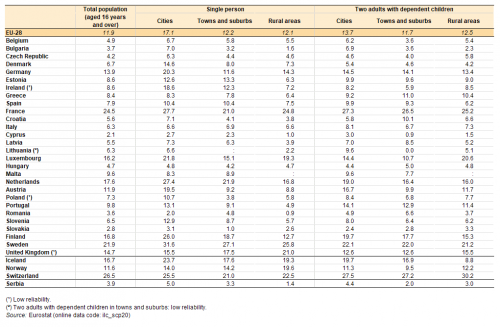
(%)
Source: Eurostat (ilc_scp20)
More than two fifths of the EU-28 adult population had no interest in being an active citizen
A final analysis relating to active citizenship is shown in Figure 5; it presents information on the principal reasons why people were not active citizens. In 2015, more than two fifths (41.0 %) of the EU-28 population aged 16 and over declared that they had no interest in being an active citizen.
The share of EU-28 adults who had no interest in being active citizens was relatively high among young adults aged 16-24 years (46.9 %), people with a low level of educational attainment (44.8 %), people in the bottom income quintile (44.8 %), and people living in rural areas (42.5 %).
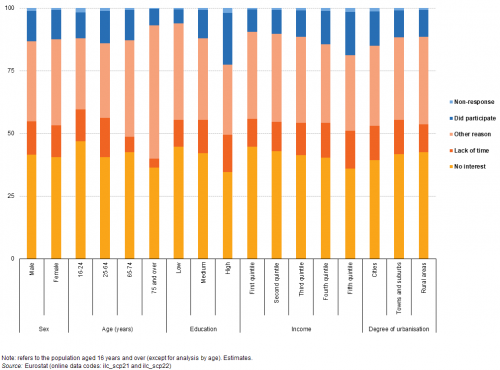
(% of total population)
Source: Eurostat (ilc_scp21) and (ilc_scp22)
Formal and informal voluntary activities
In 2015, approximately one fifth of the EU-28 population aged 16 and over participated in voluntary activities; the share of the adult population participating in formal voluntary activities was 18.0 %, while the share engaged in informal voluntary activities was slightly higher, at 20.7 % (see Figure 7).
A closer analysis for the EU-28 by socio-economic characteristic (see Figure 6) reveals that men, people aged 65-74 years, people with a high level of educational attainment, people in the top income quintile, and people living in rural areas tended to participate more (than average) in formal volunteering. These patterns were often repeated when analysing the share of the EU-28 population that participated in informal voluntary activities, although a higher share of women (than men) and a higher share of people living in cities (than people living in towns and suburbs) participated in informal volunteering.

(%)
Source: Eurostat (ilc_scp19) and (ilc_scp20)
Among the EU Member States in 2015, the highest share of adults participating in formal voluntary activities was recorded in Luxembourg (34.8 %), while more than one quarter of the adult population participated in these activities in Germany, the Netherlands, Austria, Denmark and Sweden; this was also the case in Switzerland and Norway. There were nine Member States where fewer than 1 in 10 adults participated in formal voluntary activities in 2015 — they were principally located in eastern and southern Europe, with the lowest share recorded in Romania (3.2 %).
In 2015, a majority of the adult populations of the Netherlands (58.0 %), Finland (52.2 %) and Poland (50.6 %) participated in informal voluntary activities, while the share in Sweden was only slightly lower (49.9 %). At the other end of the range, the share of the adult population that participated in informal voluntary activities was less than 10.0 % in Hungary, Bulgaria, Romania, Cyprus and Malta — note that all five of these EU Member States also reported participation rates that were less than 10.0 % for formal voluntary activities.
Although the participation rate for informal voluntary activities in the EU-28 was only slightly higher (20.7 %) than the rate for formal activities (18.0 %) in 2015, there were several EU Member States where much higher shares of the adult population participated in informal voluntary activities. This was particularly the case in Poland, the Netherlands, Finland, Sweden and Latvia, where the participation rate for informal activities was more than 20 percentage points higher than that recorded for formal activities; this pattern was repeated in Iceland. By contrast, the share of the adult population in Germany that participated in formal voluntary activities was 17.1 percentage points higher than the participation rate for informal voluntary activities.
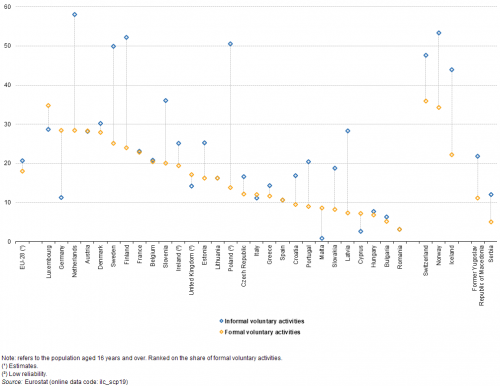
(%)
Source: Eurostat (ilc_scp19)
Figure 8 and Figure 9 provide more detailed information in relation to participation rates for volunteering with an analysis by educational attainment. The former shows that in 2015 more than a quarter (26.2 %) of the EU-28 adult population with a high level of educational attainment participated in formal voluntary activities. This could be contrasted with the much lower share (10.6 %) for adults with a low level of educational attainment.
A similar picture existed for participation in informal voluntary activities, insofar as the highest rate (27.3 %) was recorded for the EU-28 adult population with a high level of educational attainment, while the lowest rate (13.5 %) was recorded for people with a low level of educational attainment.
In 2015, the highest participation rates for both formal and informal voluntary activities across each of the EU Member States were systematically recorded among people with a high level of educational attainment. Note that in Switzerland, those people with a medium level of educational attainment had a slightly higher participation rate (49.7 %) for informal voluntary activities than people with a high level of educational attainment (48.4 %).
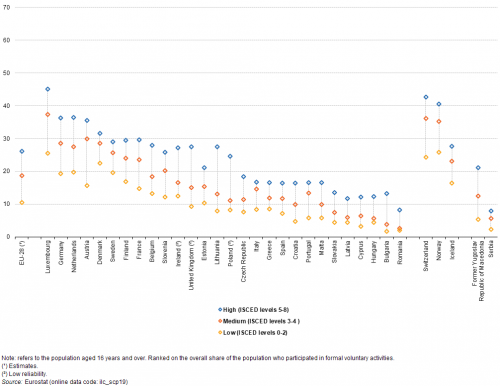
(%)
Source: Eurostat (ilc_scp19)
An analysis of participation rates for formal voluntary activities in 2015 between people with a high and a low level of educational attainment reveals that the largest gaps in participation were recorded in Austria, Luxembourg and Lithuania. A similar analysis for informal voluntary activities reveals that the largest gaps in participation between people with a high and a low level of educational attainment were recorded in Poland, Latvia and the Netherlands.
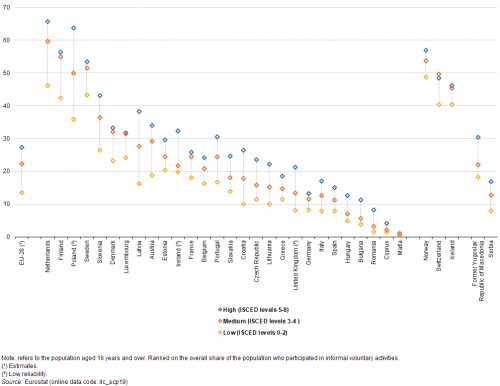
(%)
Source: Eurostat (ilc_scp19)
Just over one fifth of the EU-28 adult population had no time to participate in volunteering
In 2015, 22.4 % of EU-28 adults aged 16 and over stated that they did not have sufficient free time to participate in formal voluntary activities. A slightly lower proportion (21.3 %) of adults responded that they did not have enough time to participate in informal voluntary activities (see Figure 10).
The share of the adult population that did not participate in volunteering due to a lack of time rose together with educational attainment levels and with income levels. By contrast, the share of the population that did not participate in volunteering because they had no interest was higher among those people with a lower level of educational attainment and a lower level of income.
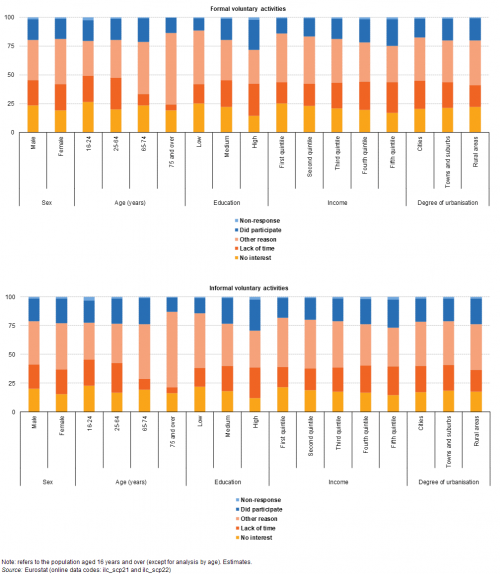
(% of total population)
Source: Eurostat (ilc_scp21) and (ilc_scp22)
Social networks
As noted under Policy Context, policymakers are increasingly concerned with finding ways to encourage social participation and integration, especially among marginalised groups. This section provides information in relation to the support networks and other social contacts of European citizens.
Having someone for help or to discuss personal matters
In 2015, 5.9 % of the EU-28 population did not have any relative, friend or neighbour who they could ask for help. Men, elderly people, people with a low level of educational attainment, people with low incomes and people living in urban areas were more likely not to have someone to ask for help (see Figure 11).

(%)
Source: Eurostat (ilc_scp15) and (ilc_scp16)
In 2015, some 6.0 % of the EU-28 adult population did not have someone with whom to discuss personal matters. Once again, men, elderly people, people with a low level of educational attainment, people with low incomes and people living in urban areas were more likely not to have someone with whom to discuss personal matters (see Figure 12).
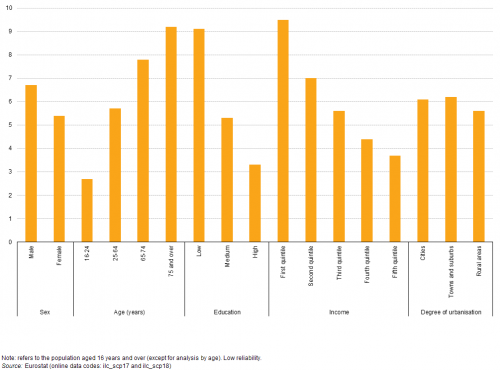
(%)
Source: Eurostat (ilc_scp17) and (ilc_scp18)
Almost 1 in 10 Europeans with a low level of educational attainment did not have someone to ask for help
Figure 13 presents an analysis of the share of people who did not have someone to ask for help by educational attainment. In 2015, almost 1 in 10 (9.1 %) adults (aged 16 and over) in the EU-28 with a low level of educational attainment found themselves in this position, while corresponding shares for those people with a medium (5.0 %) or high (3.5 %) level of educational attainment were considerably lower.
Among the EU Member States, the share of the adult population in 2015 that did not have someone to ask for help ranged from highs of 13.2 % in Italy and 12.9 % in Luxembourg — the only Member States to record double-digit shares — down to less than 3.0 % in Hungary, Sweden, Slovakia, the Czech Republic and Finland.
Generally, people with lower levels of educational attainment were more likely not to have someone to ask for help, while people with a high level of educational attainment were least likely not to have someone to ask for help. The United Kingdom was the only EU Member State where this pattern was not followed, as the lowest share of people who did not have someone to ask for help was recorded for people with a medium level of educational attainment.

(%)
Source: Eurostat (ilc_scp15)
Almost 1 in 10 elderly Europeans aged 75 and over did not have someone with whom to discuss personal matters
In 2015, 6.0 % of the EU-28 adult population did not have someone with whom to discuss personal matters. There were quite large differences between the generations.
The share of the EU-28 population aged 75 and over that did not have someone with whom to discuss personal matters rose to 9.2 % in 2015; this could be contrasted with a 2.7 % share among people aged 16-24 years. In 10 of the EU Member States, the share of people aged 75 and over that did not have someone with whom to discuss personal matters rose into double-digits; the highest shares were recorded in the Netherlands (14.0 %), Italy (14.2 %) and particularly France (20.6 %) (see Figure 14).
France also recorded the largest inter-generational difference: as the share of its population aged 75 and over that did not have someone with whom to discuss personal matters was 17.4 percentage points higher than the corresponding share recorded among young adults (16-24 years). There were also considerable inter-generational differences (more than 10.0 percentage points between these two subpopulations) in the three Baltic Member States, the Netherlands and Finland.
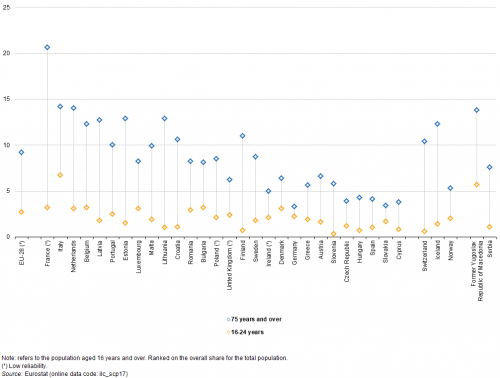
(%)
Source: Eurostat (ilc_scp17)
In 2015, the share of the EU-28 adult population not having someone with whom to discuss personal matters peaked at 9.5 % for the first income quintile (the bottom 20 % of the population with the lowest incomes). This share consistently fell as income levels rose and reached a low of 3.7 % among the fifth income quintile (the top 20 % of the population with the highest incomes) (see Figure 15).
In most of the EU Member States, the highest share of the population not having someone with whom to discuss personal matters was recorded among the bottom income quintile: in 2015, the only exceptions to this pattern were Denmark (where the share of the second income quintile was slightly higher) and Spain (where the first and second income quintiles had identical shares).
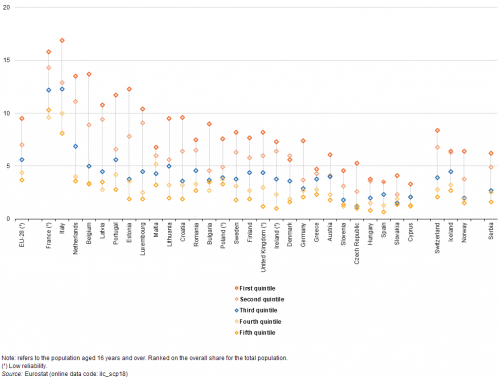
(%)
Source: Eurostat (ilc_scp18)
Social contact with friends and family
Social interactions affect people’s quality of life: the satisfaction that people derive from being with family, friends (or colleagues) impacts on their subjective well-being, and may act as a buffer against the negative effects of stress. This section analyses the frequency with which Europeans get together and communicate with family and friends.
In 2015, more than half (51.9 %) of the EU-28 population aged 16 and over got together at least once a week with family and relatives (in its widest meaning). A similar share (53.2 %) of the EU-28 population got together with friends at least once a week.
These overall figures hide some interesting differences: for example, men in the EU-28 were more likely to get together at least once a week with friends (54.6 % in 2015) than with family and relatives (48.8 %), while a higher proportion of women in the EU-28 got together with family and relatives (54.6 %) compared with friends (51.8 %).
In 2015, more than four fifths (80.6 %) of all young adults (aged 16-24 years) in the EU-28 got together with friends at least once a week; this share was considerably higher than for any other age group. By contrast, some 56.1 % of elderly people aged 75 and over got together at least once a week with family and relatives; this was the highest share among any of the age groups shown in Figure 16.

(%)
Source: Eurostat (ilc_scp09) and (ilc_scp10)
The frequency with which a respondent is usually in contact with family and relatives or with friends relates to any form of contact made by telephone, SMS, the Internet (e-mail, Skype, Facebook, FaceTime or other social networks and communication tools), letter or fax; note that the information presented should be based on a ‘conversation’ and therefore excludes sharing and viewing information on social media if there is no other form of interaction.
In 2015, just over two thirds of the EU-28 adult population had contact at least once a week with their family and relatives (68.7 %), the corresponding share for people having contact at least once a week with their friends was slightly lower (63.8 %). Almost three quarters (73.2 %) of women had contact at least once a week with family and relatives, which was 9.6 percentage points higher than the corresponding share for men (63.6 %). The gap between the sexes was much smaller when considering contact at least once a week with friends — 65.0 % for women, compared with 62.3 % for men.
In 2015, the share of the EU-28 adult population that had contact at least once a week with their family and relatives or with their friends was higher among those subpopulations with higher levels of educational attainment or income and those people who were living in cities.
However, there was much more variation when analysing the results by age, as the share of young adults (aged 16-24 years) in the EU-28 who had contact at least once a week with their friends reached almost 9 out 10 (89.5 %) and then fell rapidly for older age groups; by contrast, the share of the EU-28 population who had contact at least once a week with their family or relatives was relatively constant across the different age groups (see Figure 17).

(%)
Source: Eurostat (ilc_scp11) and (ilc_scp12)
1 in 6 adults in the EU-28 got together with family and relatives every day …
On average, most people in the EU-28 got together with their family and relatives on a fairly regular basis. In 2015, more than one third (35.2 %) of the EU-28 adult population met up with their family and relatives at least once a week (excluding every day), while a slightly lower share (33.1 %) met up with their family and relatives less than once a week but at least once a month (see Figure 18).
In 2015, one sixth (16.7 %) of the EU-28 adult population reported that they got together with family and relatives every day; note that the figures exclude those family members and relatives who share the same dwelling. Among the EU Member States, the share of the adult population getting together with family and relatives every day rose to around one third in Portugal, Malta, Greece and Slovakia and peaked at 45.4 % in Cyprus; note a much higher share was recorded in the former Yugoslav Republic of Macedonia (85.8 %).
At the other end of the range, some 15.1 % of the EU-28 adult population in 2015 reported getting together with family and relatives less than once a month (including not at all); these figures may be influenced by the considerable distances that divide some families, as an increasing share of the EU-28 population relocates for work or retirement. More than one fifth of the adult populations of the three Baltic Member States and Luxembourg got together less than once a month with their family and relatives, the highest share being recorded in Latvia (24.8 %).
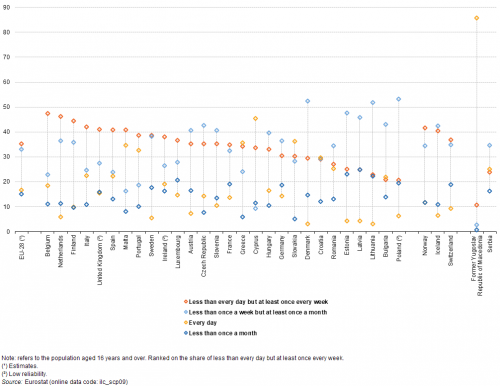
(%)
Source: Eurostat (ilc_scp09)
… while more than one quarter of the adult population in the EU-28 got together with friends on a daily basis
Figure 19 shows a similar set of information relating to the frequency with which people in the EU-28 got together with their friends. In 2015, more than one third (36.8 %) of the EU-28 adult population reported getting together with friends at least once every week (but not every day), while similar shares met friends every day (26.9 %) or less than once a week but at least once a month (26.8 %); as such, less than one tenth (9.4 %) of EU-28 adult population got together with their friends less than once a month (or not at all).
In 2015, Cyprus, Greece and Spain had the highest shares of their adult populations getting together with their friends on a daily basis; each reported a share that was higher than two fifths, with a peaked of 48.4 % in Cyprus. These shares were synonymous with a more general pattern, insofar as most of the southern EU Member States recorded relatively high shares of their adult populations having daily contact with friends (Italy was the main exception), whereas much lower shares of the adult populations in most eastern and Baltic Member States got together on a daily basis with their friends, with a low of 9.7 % recorded in Poland.
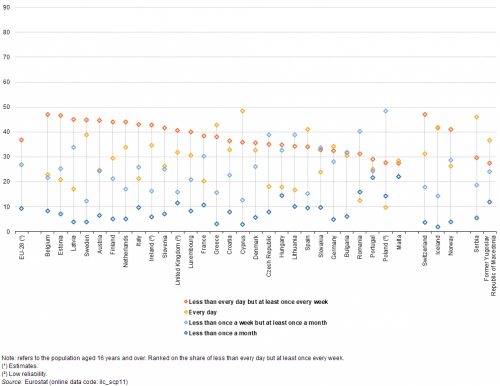
(%)
Source: Eurostat (ilc_scp11)
Communication via social media
Within the framework of the EU-SILC 2015 ad-hoc module on social and cultural participation and material deprivation, respondents were asked about the frequency with which they communicated via social media (including community-based websites, online discussions forums, chat rooms and other social media spaces — for example, Facebook, LinkedIn or Twitter).
Approximately half of the EU-28 adult population had not communicated via social media during the previous 12 months
In 2015, just over half (50.5 %) of the EU-28 adult population reported that they had not communicated via social media during the previous 12 months. By contrast, the second most popular response was recorded for those respondents who communicated using social media on a daily basis (26.2 %).
This contrasting situation may be largely explained by the age of respondents: as almost two thirds (66.4 %) of young adults (16-24 years) used social media on a daily basis, compared with just 6.8 % of the population aged 65-74 years and 2.2 % of the population aged 75 and over (see Figure 20).
Aside from young adults, it was also the case that across the EU-28 in 2015, women, people with a high level of educational attainment or income, and people living in cities were more likely to communicate on a daily basis through social media.

(%)
Source: Eurostat (ilc_scp13) and (ilc_scp14)
Table 3 provides more detail in relation to the share of the adult population (aged 16 and over) that was communicating via social media in 2015. The share that used social media on a daily basis was higher than 40.0 % in Cyprus, Denmark, Sweden, Ireland and Malta (where a peak of 42.6 % was recorded). By contrast, close to three fifths of the adult population in Italy (59.6 %) and Croatia (63.3 %) had not communicated via social media during the 12 months prior to the survey.
A closer analysis of those people not communicating via social media during the 12 months prior to the survey in 2015 reveals a peak among young adults (16-24 years) in Bulgaria and Romania, where more than a fifth of this subpopulation had not used social media, while Italy (13.3 %), Hungary (10.4 %) and France (10.3 %) were the only other EU Member States where more than one tenth of all young adults had not communicated via social media during the previous 12 month period.
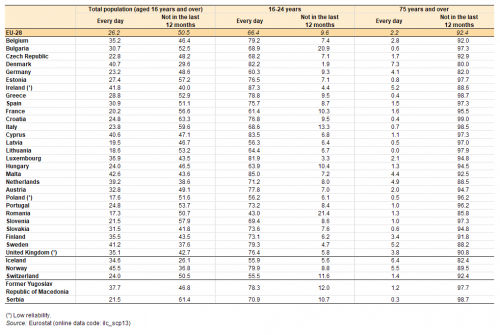
(%)
Source: Eurostat (ilc_scp13)
Source data for tables and graphs
Data sources
The data used in this section are primarily derived from data from EU statistics on income and living conditions (EU-SILC). EU-SILC is carried out annually and is the main survey that measures income and living conditions in Europe, and is the main source of information used to link different aspects relating to the quality of life at the household and individual level.
The reference population is all private households and their current members residing in the territory of an EU Member State at the time of data collection; persons living in collective households and in institutions are generally excluded from the target population. The EU-28 aggregate is a population-weighted average of individual national figures.
The EU-SILC ad-hoc module on social and cultural participation conducted in 2015 provides a definition for some key terms that allow an analysis of social participation.
Active citizenship: participation in the activities of a political party or a local interest group; participation in a public consultation; peaceful protest including signing a petition; participation in a demonstration; writing a letter to a politician, or writing a letter to the media (this may be carried out via the internet). Note that voting in an election is not considered as active citizenship (as voting in some countries is compulsory).
Participation in formal voluntary work: non-compulsory, volunteer work conducted to help other people, the environment, animals, the wider community, etc. through unpaid work for an organisation, formal group or club (for example, charitable or religious organisations).
Participation in informal voluntary activities: helping other people not living in the same household (for example, by cooking for them or cleaning their home); taking care of people in hospitals or in their own home; taking people for a walk, shopping, etc.; helping animals (for example, homeless or wild animals); other informal voluntary activities (for example, cleaning a beach or a forest).
Direct access to
- Income and living conditions (ESMS metadata file — ilc_esms)
- Main concepts and definitions
- Regulation (EC) No 1177/2003 — framework regulation — this is the central piece of legislation which sets up the whole EU-SILC instrument
- Summaries of EU Legislation: EU statistics on income and living conditions
- Detailed list of legislative information on EU-SILC provisions for survey design, survey characteristics, data transmission and ad-hoc modules
