Archive:First and second-generation immigrants - statistics on main characteristics
Data extracted in September 2016.
Planned article update: 17 November 2022.
Highlights
This article gives an overview of the 2014 EU immigrant population, using the 2014 Labour Force Survey (LFS) ad hoc module on ‘The labour market situation of migrants and their immediate descendants’. It looks at the main demographical characteristics of the first- and second-generation immigrant populations living[1] in the EU. The analyses address separately first- and second-generation immigrant from an EU and not from an EU background[2], comparing these four categories with each other and with the native-born residents with native backgrounds. As another module on a similar topic was carried out in 2008, comparisons are also made whenever possible with that reference year. This is the first article in a series of six articles that make up the on-line publication First and second-generation immigrants - a statistical overview .
- Authors: Mihaela Agafiţei, Georgiana Ivan
Full article
General overview
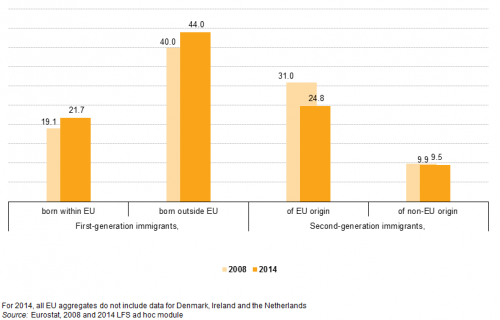
The EU immigrant population as a whole, including those born abroad and their immediate descendants, increased by almost two fifths between 2008 and 2014 , reaching about 55 million in 2014, up from about 40 million in 2008. These figures exclude Denmark, Ireland and the Netherlands, as data regarding second-generation immigrants were not available for those countries in 2014. First-generation immigrants born outside the EU were the largest of the four groups, with a share of 40.5 % of the immigrant population in 2008 and 44.0 % in 2014. By contrast, in 2014, second-generation immigrants with non-EU origin were the smallest group, representing 9.5 % of the immigrant population as a whole, which was quite similar in 2008 (9.9%).
In 2014, about four fifths (79.7 %) of EU immigrants were living in the five largest Members States, in terms of population: Germany (20.5 %), the United Kingdom (19.4 %), France (19.3 %), Italy (10.8 %) and Spain (9.7 %). Luxembourg has the largest share of immigrant population in the total resident population (65.3 %). However, the immigrants living in Luxembourg accounted for only 0.4 % of the total population of immigrants living in the 25 Member States for which data are available.
Looking at the age of immigrants reveals that the second-generation immigrants with non-EU origins formed the youngest group being, on average, almost eight years younger than both the first-generation immigrants and the native-born population with a native background. This is caused by the different age structure of the three groups analysed: there were far more young workers (from 15 to 24 years) among second-generation immigrants, while the majority of people in the first-generation of immigrants were in the core working-age group (from 25 to 54 years). Therefore, 73.9 % of first-generation immigrants were aged from 25 to 54, compared with 62.9 % of the native-born population with a native background and 57.2 % of second-generation immigrants. Conversely, the share of young workers (from 15 to 24 years) was three times higher in the second-generation group (29.6 %) than in the first-generation group (10.8 %), while the shares of older workers (from 55 to 64 years) were similar among generations (13.2 % in the second-generation group and 15.2 % in the first-generation group).
The gender ratio was relatively balanced in 2008, but the proportion of women among three of the four immigrant population groups has increased. Therefore, in 2014, the proportion of women was slightly higher than that of men for all immigrant population groups (between 2.9 and 6.6 pp) except second-generation immigrants with EU origins (-0.2 % pp).
This data shows that immigrants tend to settle in urban areas, and three fifths of immigrants with a non-EU background, irrespective of the generation, were settled in cities. Many immigrants with an EU background, but not a majority, irrespective of the generation, also preferred to settle in cities. Overall, some 18.2 % of the total immigrants living in the EU settled in rural areas, which is 12.9 pp less than among the native-born population with a native background.
While about half of immigrants born outside the EU hold the citizenship of their host country, at least 9 in 10 second-generation immigrants with non-EU origins do also. On the other hand, about one quarter of the EU citizens that reside in an EU Member State other than their home country have acquired the citizenship of their host country. It is interesting to note that there are also second-generation immigrants who are not citizens of their country of birth: some 3 % were citizens of another EU country and a further 4.1 % were citizens of a country outside the EU.
The countries most frequently found in the top three most common countries of birth of first-generation immigrants were Ukraine (six appearances), Russia (five appearances), Belarus (four appearances), Morocco (four appearances) and Serbia (four appearances). Of the EU Member States, Romania had the highest frequency with four appearances, followed by France and Germany with three appearances each. Overall, about three fifths (59.1 %) of first and second-generation immigrants with non-EU background come from countries with a high human development index (HDI) and only one in eight comes from a country with a low HDI.
In 2014, about half of first-generation immigrants migrated for the purpose of family reunification. The economic reason comes in second as about 3 in every 10 first-generation immigrants decided to migrate for work. Almost 70 % of first-generation immigrants had been living in the host country for 10 years or more. Looking at duration of stay by reason to migrate, it can be noted that a similar proportion of the foreign-born who have been living in a country for less than 10 years migrated for family reunification as did for work. Conversely, the proportion of foreign-born immigrants who have been living in their host country for 10 years or more and who migrated for family reunification (53.7 %) was double the proportion that migrated for work (25.5 %). At national level, the primary reason for migrating in 19 reporting countries was family reunification. Work was the main reason to migrate in only four reporting countries: Cyprus (54.5 %), Italy (48.3 %), Greece (46.3 %) and Spain (44.1 %).
EU immigrant population – general overview
In absolute terms, the EU immigrant population increased by two fifths between 2008 and 2014
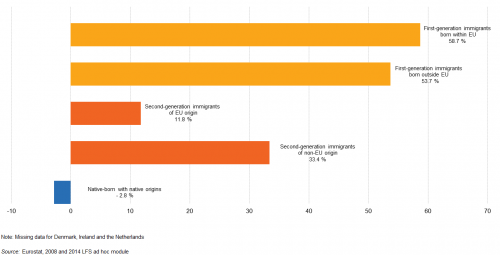
The EU immigrant population [3] (including those born abroad and their immediate descendants) continued to grow over these six years, reaching about 55 million in 2014, up from about 40 million in 2008. This period comes immediately after the flow of East European immigrants following the EU enlargements in 2004 and 2007. Accordingly, the EU immigrant population increased by almost two fifths (37.2 %) between 2008 and 2014, while the EU native-born population with native origins decreased by only 2.8 % during the same period (Figure 2).
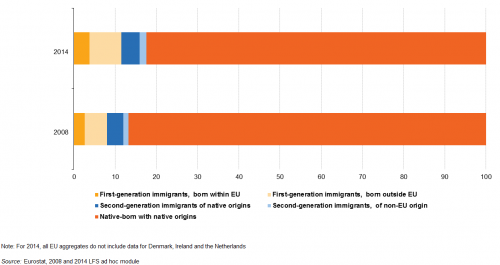
Overall, in 2014, at least one in six people (or 17.6 %) residing in the EU was an immigrant, compared to about one in seven people (or 13.2 %) in 2008 (Figure 3). Analysing the immigrant population as a whole shows that 44 out of every 100 immigrants in the EU were first-generation immigrants born outside the EU (Figure 4). This was the largest group of immigrants, and accounted for 7.7 % in the total EU population (Figure 3). By contrast, second-generation immigrants of non-EU origin were the smallest of the four groups of immigrants: only ten in a hundred immigrants (or 9.5 %) were second-generation of non-EU origin (Figure 4). In 2008, this figure was only 0.4 pp higher (9.9 %). This actually represents a 33.4% increase in numbers for this category, as the proportion of the immigrant population as a whole in the total has increased significantly. In 2014, second-generation immigrants represented 6.1 % of the total EU population, 0.9 pp more than in 2008. On the other hand, the total number of first-generation immigrants of both EU and non-EU origin increased by at least half, and combined they made up 11.5 % of the total 2014 population of participating countries, 3.5 pp more than in 2008 (Figure 3).
Four fifths of EU immigrants were living in a handful of countries
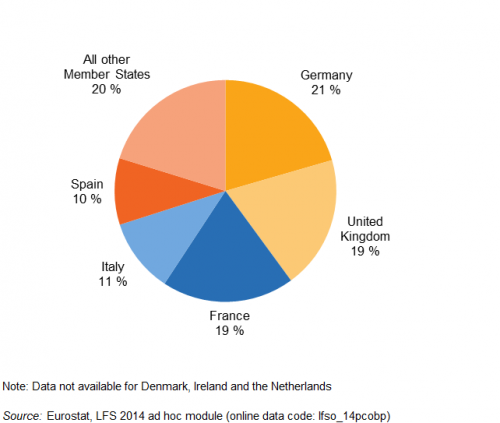
In 2014, almost four fifths (or 79.7 %) of immigrants in the EU were living in just five Member States, namely Germany (20.5 %), the United Kingdom (19.4 %), France (19.3 %), Italy (10.8 %) and Spain (9.7 %) (Figure 5). These five were also the largest Member States in terms of population, and together they accounted for 65 % of the total population aged from 15 to 64 and living in the 25 Member States that took part in the survey.
Source: Eurostat, LFS 2014 ad hoc module (lfso_14pcobp)
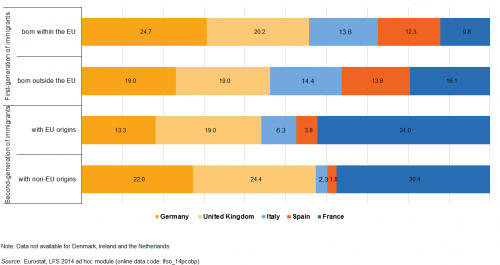
Looking at the generation and background combined, we observe that at least four fifths of each immigrant group were settled in these five countries, except the second-generation immigrants with EU origin with slightly less than three quarters (Figure 6). In this context, we note that although in 2014 two countries, Italy and Spain, attracted large numbers of first-generation immigrants born both within and outside the EU, they retained far fewer second-generation immigrants. For instance, while 13.6 % of first-generation immigrants born within the EU and 14.4 % born outside the EU were living in Italy, only 6.3 % of second-generation immigrants of EU origin and 2.3 % of non-EU origin lived there. In addition to this, while Germany and the United Kingdom attracted the most first-generation immigrants, irrespective of their migration background, the most second-generation immigrants, also irrespective of migration background, were living in France. The proportion of second-generation immigrants with EU origin living in France was three times greater than that of first-generation immigrants born in the EU and living in France. These differences between countries probably stem from how long people have been migrating to each country.
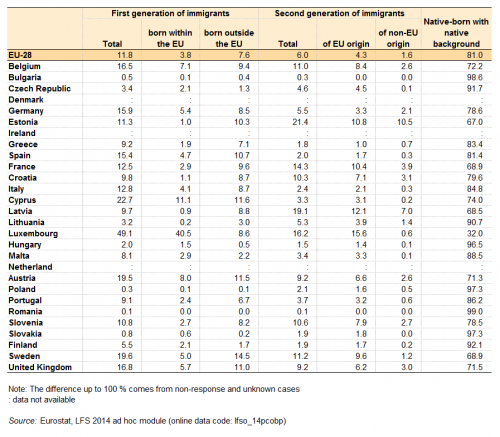
When analysing proportions, the share of immigrants in the total resident population was especially high in Luxembourg, where about two thirds (65.3 %) of the resident population were immigrants (Table 1). However, the immigrants living in Luxembourg accounted for only 0.4 % of the total population of immigrants living in the 25 EU Member States for which data are available. The combined share of first and second-generation immigrants in the total resident population was also large in Estonia (32.7 %), Sweden (30.8 %), Latvia (28.7 %), Austria (28.7 %), Belgium (27.6 %), France (26.8 %), Cyprus (26.0 %) and the United Kingdom (26.0 %).
EU immigrant population by age group
Second-generation immigrants were the youngest group among migration groups
Comparing the median age of the five migration groups shows that, in both reference years, the youngest group was second-generation immigrants whose parents are both born outside the EU. At EU level, 2014 estimates indicate that these immigrants’ median age was 32.3 years, compared with 40.4 years for the native-born population without any migration background (Figure 7). On average, the second-generation immigrant population was younger than all other migrant groups, despite the fact that those of EU origin were significantly older than those of non-EU origin (37.6 years and 32.3 years respectively). Moreover, this migration group was the only one whose median age decreased slightly between 2008 and 2014, while for the first-generation immigrants the median age increased by up to 1.2 year. The median age of the first-generation immigrant population and the native-born population with a native background were similar.
Next, we analysed the structural distribution of immigrants by the following three age groups:
- young workers (from 15 to 24 years);
- core working-age group (from 25 to 54 years); and
- older workers (from 54 to 64 years).
In 2014, native-born immigrants of non-EU origin were about almost eight years younger (median age) than both the foreign-born population and the native-born population with a native background. As a natural consequence of this, the share of the core working-age (25-54) population among native-born immigrants of non-EU origin was lower than among the other two populations. On average, 57.2 % of second-generation immigrants were aged from 25 to 54, compared to about 73.9 % of first-generation immigrants and 62.9 % of the native-born population with a native background (Figure 8). Furthermore, the second-generation immigrant population of non-EU origins had the lowest share of young workers (54-64) with only 4.6 % compared to 20.7 % in the native-born population with a native background, which was the highest share. The fact that the first-generation immigrant population had a larger share of core working-age workers (25-54) at expense of both young workers (15-24) and older workers (55-64) was the main factor differentiating them from the native-born population with a native background. Thus, 74.3 % of first-generation immigrants born outside the EU were in the core working-age group (25-54), which is 1.2 pp more than among first-generation immigrants born in the EU and 11.4 pp more than among native-born people with a native background. In a similar way to median age, the share of young workers (15-24) in both second-generation immigrant groups increased considerably between 2008 and 2014: 6.7 pp for immigrants of EU origin and 5.1 pp for those of non-EU origin.
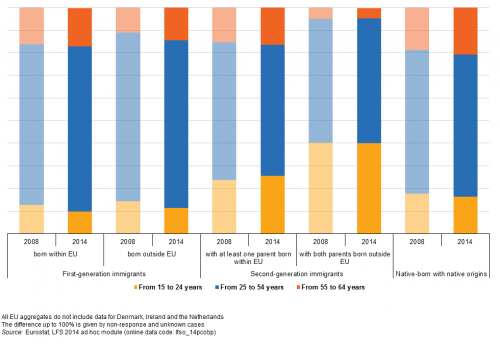
Analysing the age structure at country level shows that the age structure of the native-born population with native origins closely follows the EU pattern. This means that, on average, 17.4 % of this population group were young workers (15-24), 62.4 % were in the core working-age group (24-54) and 20.2 % were older workers (55-64). On the other hand, the age structure for first and second-generation immigrants varies greatly from one Member State to another (Table 2).
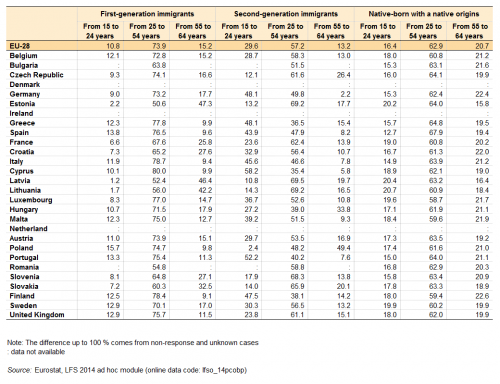
Among first-generation immigrants, the proportion of older workers (55-64) varied the most, ranging from 9.1 % in Finland to 47.3 % in Estonia. In Estonia, Latvia and Lithuania the share of older workers among first-generation immigrants was above 40 % (and even approaching 50 %), compared to just 15 % at EU level. Therefore, the first-generation immigrant populations of these countries were older on average than in other countries. This was also the case for second-generation immigrants, as only between 10.8 % and 14.3 % were aged between 15 and 24 in those three countries, compared to almost 30 % at EU level. This denotes different characteristics in migration in the Baltic countries. On the other hand, the proportion of the youngest category is even higher (and approaches 50 %) in the second-generation immigrants in Germany, Greece, Spain, Italy and Finland, and stands at 58 % in Cyprus and 52 % in Portugal. Cyprus also had the highest proportion of first-generation immigrants of core working-age (80 %), the other two age groups being almost equally distributed (10.1 % for young workers and 9.9 % for older workers).
In almost all countries for which data are available, the foreign-born population made up a higher proportion of the core working-age group (25-54) than the native-born population with a native background. The only exceptions were the three Baltic countries, Romania and Slovakia. The gap is usually larger than 10 pp, and reaches 19 pp in Finland. In all countries for which data are available, the proportion of second-generation immigrants aged between 15 and 24 is higher than the corresponding age group among the native-born population with a native background. This gap was larger than 30 pp in Germany, Greece, Spain, Cyprus, Italy and Portugal. It can therefore be concluded that, in most cases, first-generation immigrants were more represented in the core working-age group compared to the other age groups, while second-generation immigrants were generally younger.
EU immigrant population by gender
Slightly more women than men in the immigrant population
In 2014, the gender ratio for the native-born population of native origin was balanced, with only 0.2 pp more men than women (Figure 9). In contrast, the proportion of women among the immigrant population, irrespective of the generation or migration background, was clearly higher than the proportion of men. The only exception was among second-generation immigrants of EU origin, where there were 0.2 pp more men than women. Therefore, there were about 3 pp more women than men among second-generation immigrants of non-EU origin, while for the foreign-born population, irrespective of migration background, the difference doubled to 6.6 pp (also in favour of women).

Looking at the trends over time, we see that the gender ratio was more balanced in 2008 than in 2014. Only the native-born population of native and EU origin was stable over time with an almost perfect gender balance. In contrast, the proportion of women in all migration groups except first-generation immigrants increased. The increase was greatest among first-generation immigrants born outside the EU where the relative difference between women and men almost tripled from 2.4 pp in 2008 to 6.6 pp in 2014.
EU immigrant population by degree of urbanisation
The EU immigrant population tends to settle in cities
Figure 10 indicates the strong tendency of the immigrant population towards settling in cities where labour markets are larger and infrastructure (e.g. hospitals, schools, universities, commodities) is better consolidated. Thus, in 2014 about three fifths (61.3 %) of immigrants of non-EU background were living in cities as opposed to almost a quarter (24.7 %) in towns and one seventh (13.9 %) in rural areas. Just under a half (48 %) of immigrants of EU origin were also living in cities compared to only about two fifths (38.5 %) of the native-born population without any migration background.
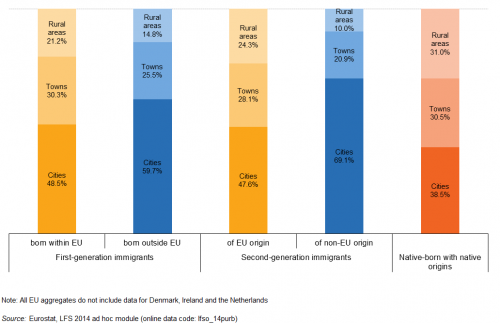
A little more than half of each generation (56.3 % of first-generation and 53.1 % of second-generation) is settled in cities. This preference becomes clear when considering that, at EU level, the native-born population with native background is distributed more or less proportionally across the three urban areas, with only a very slight preference for cities (38.5 % in cities, 30.5 % in towns and 31.0 % in rural areas). The share of immigrants living in towns differs only slightly across the four migration groups, but immigrants of EU origin, irrespective of the generation, were more likely to settle in rural areas than those of non-EU origin: 23.0 % of immigrants of EU background and 13.9 % of immigrants of non-EU background were living in rural areas. Some 18.2 % of the total immigrants in the EU live in rural areas. This is 12.9 pp less than among the native-born population with a native background.
EU immigrant population by citizenship
About half of immigrants born outside the EU hold the citizenship of their host country
Citizenship expresses the relationship between an individual and a state and gives the individual specific legal rights and duties. The most important rights associated with citizenship are the protection by the state and unrestricted access to the territory and implicitly to the labour market. Even if alternative statuses (e.g. residence permit, work permit) may provide sufficient security of residence and strong protection against expulsion, ultimately it is ‘naturalisation’ that transforms a foreigner [4] into a citizen. Citizenship also brings additional privileges, such as diplomatic protection, the right to vote and access to public sector jobs, to name but a few [5].
In the EU, not all foreigners have the same interest in obtaining the citizenship of their host country. More exactly, the acquisition of citizenship only secondarily concerns foreigners who are already EU citizens (i.e. citizens of an EU Member State). This is because EU citizens are already protected by legislation in force in all Member States and, with a few exceptions, should have largely the same legal rights as the citizens of the reporting country. Thus, the citizenship issue primarily concerns foreigners who are not EU citizens.
Figure 11 shows that slightly over half of the first-generation immigrants born outside the EU were not EU citizens (they were citizens of a country outside the EU). It can then be approximated that the other half of first-generation immigrants born outside the EU obtained the citizenship of their host country. It is also possible that some of them obtained the citizenship of an EU Member State other than the country of residence, giving them the right to circulate freely inside the EU. But it is reasonable to assume that these cases are negligible. Following the same reasoning, a quarter of first-generation immigrants born in the EU also obtained the citizenship of their host country, which confirms the expectation that there is little incentive for EU citizens to acquire the citizenship of another EU Member State (in which they reside).

In the overwhelming majority of cases, second-generation immigrants receive the citizenship of the country in which they were born: 92.2 % of native-born immigrants with foreign origins were citizens of their reporting countries. At the same time, some 3 % of second-generation immigrants were citizens of an EU country other than the reporting one and another 4.1 % were citizens of a country outside the EU.
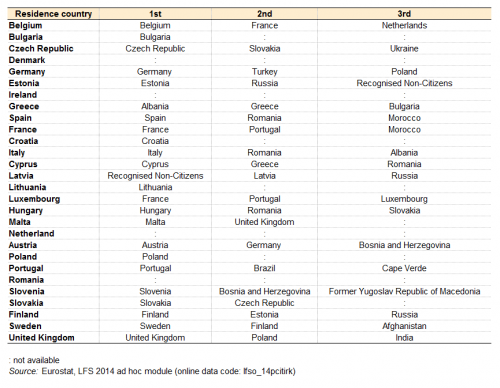
Analysing in detail the top three countries of citizenship of the first-generation immigrant population (Table 3) shows that in all countries except Greece, Latvia and Luxembourg, the citizenship of the reporting country is in first place. Romanians (three times in second place and once in third place) and Russians (once in second place and twice in third place) appeared most frequently among all 27 countries of citizenship that come in second or third place combined. Citizens of Bosnia and Herzegovina, Greece, Morocco, Poland, Portugal and Slovakia had two appearances each.
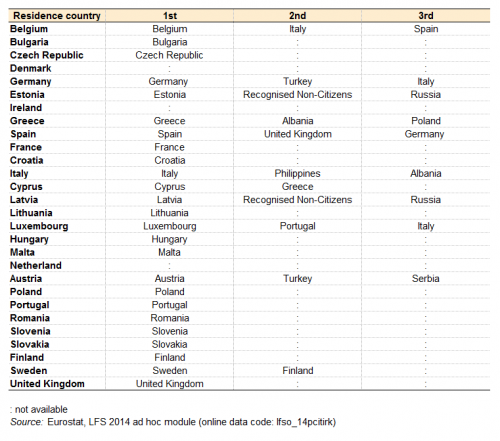
As expected, in all reporting countries, the host country was the first ranked country of citizenship for second-generation immigrants (Table 4). We note that only 14 countries of citizenship come in second and third place combined, compared with 27 countries for the country of citizenship of the foreign-born population. Eight out of the 14 countries of citizenship of the second-generation immigrants which came in second and third place were EU countries (Germany, Greece, Spain, Italy, Poland, Portugal, Finland and United Kingdom), four were countries located in Europe but outside the EU (Russia, Turkey, Albania and Serbia) and one was an Asian country (the Philippines). The last category refers to recognised non-citizens, a category specific to the Baltic countries and rather large in Latvia and Estonia.
EU immigrant population by HDI of the country of origin
More than half of immigrants of non-EU background came from countries with a high HDI
Next, we analyse the immigrants of non-EU background by the human development index (HDI) of the country of origin. The HDI was created by the UN Development Programme to assess a country’s development by giving weight not only to economic output but also in particular to people and their capabilities. Thus, it is a composite index that incorporates life expectancy, literacy, educational attainment and GDP per capita.
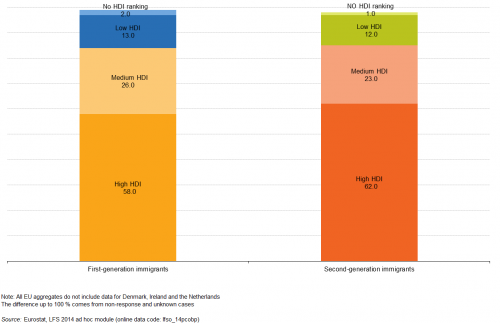
In 2014, the immigrants of non-EU background living in the EU originated mostly from countries with a high HDI (Figure 12). Thus, 58 % of first-generation immigrants with a non-EU background were born in high-HDI countries, and 62 % of the second-generation immigrants with a non-EU background have their origins in countries with a high HDI. Regardless of the generation, the share of immigrants of non-EU background with origins in medium-HDI countries is about double the share of immigrants with origins in low-HDI countries. Overall, only 13 % of immigrants with a non-EU background come from low-HDI countries.
Top three countries of birth of foreign-born population
Non-EU countries are predominant in top three countries of birth of foreign-born population
The choice of destination country may be influenced by many ‘pull’ factors, among them considerably better living conditions, the presence of established communities and historical/cultural/linguistic links between countries. Table 5[6] [7] presents, for each available country, the three main countries of birth for people born outside that reporting country. The table indicates that the main countries of birth for the foreign-born population were outside the EU, many were on the European continent, and just a few others were in other continents. It also shows that a large number of EU countries appear in the top three countries of birth.
More exactly, 15 out of the 36 countries of birth present in the top three were EU Member States. Altogether, they accounted for 25 out of 75 possible appearances. 15 non-EU countries came in first place compared with only eight EU Member States. In the top three countries of birth, Romania is the EU Member State with the highest frequency (4: twice in first place and twice in second place) followed by France (3: once in first place and twice in second place) and Germany (3: once in second place and twice in third place). The following five non-EU countries had the highest appearance frequency among all 36 countries of birth present in the top three: Ukraine (six appearances), Russia (five appearances), Belarus (four appearances), Morocco (four appearances) and Serbia (four appearances).
EU first-generation immigrant population by reason to migrate and length of stay
About half of foreign-born people took the decision to migrate for family reunification
The last part of this analysis is dedicated to the first-generation immigrant population, looking at their length of stay in the country and their reason for migration.
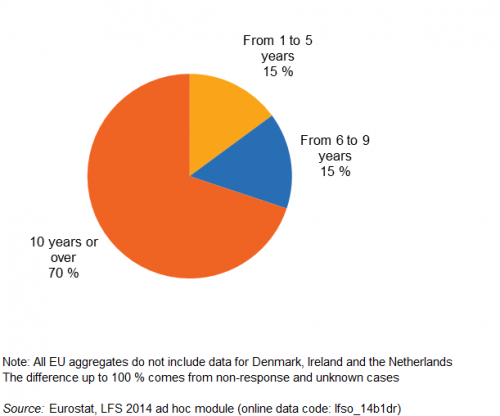
Almost five in seven foreign-born immigrants had been living in the country for 10 years or more (69.4 %). The rest were almost equally divided between those who arrived in the country in the last five years (14.8 %) and those who had lived in the country between 5 and 10 years (15.1 %) (Figure 13).
Mainly social reasons made people move from their country of birth. In 2014, about half (49.5 %) of the people who decided to move from their country of birth to another country did so for the purpose of family reunification (Table 6). The economic reason came in second: about three in ten (29.2 %) foreign-born people decided to move in order to find work in a country other than their country of birth. Many of them migrated without having previously found a job (20.4 %), while a few had already found one (8.8 %). The third reason to migrate was for educational purposes (6.6 %) followed closely by international protection and asylum (5.1 %).

The order of reasons to migrate remains the same when analysing jointly the reason to migrate by sex and by length of stay, separately. However, the proportions differ.
Thus, the proportion of foreign-born women (58.2 %) who decided to migrate for family reasons was a fifth (17.8 pp) more than the corresponding proportion among foreign-born men (40.4 %). Conversely, 15.1 pp fewer foreign-born women than men decided to migrate for work. In addition to this, we note that the proportion of foreign-born men who decided to migrate for family reunification (40.4 %) is similar to the proportion migrating for work (36.9 %), while the proportion of foreign-born women who decided to migrate for family reunification (58.2 %) is almost three times higher than the proportion migrating for work (21.9 %).
Breaking down the reason to migrate by duration of stay shows that foreign-born immigrants who have been living in a country for less than 10 years migrated in similar proportions for both family reunification (39.8 % for less than five years and 34.3 % for six to nine years) and work (42.6 % for less than five years and 42.5 % for six to nine years). However, the proportion of foreign-born immigrants who have been living in the country for 10 years or more and who migrated for family reunification (53.7 %) is double the proportion of those who migrated for work (25.5 %). Also, the proportion of foreign-born immigrants who have been living in the country for 10 years or more and who migrated for educational purposes (4.9 %) is at least half of the corresponding proportion of those who migrated for education purposes and arrived in the country during the last five years (13.9 %).
In four out of 25 reporting countries, work is the most common main reason for migrating: Cyprus (54.5 %), Italy (48.3 %), Greece (46.3 %) and Spain (44.1 %) (Table 7). It is notable that in Cyprus, the economical reason is not only the main reason but also the major one as more than half of foreign-born immigrants declared that they were moving for work. In the remaining 19 reporting countries, family reunification was the foremost reason for migrating. In 14 out of these 19 reporting countries, those coming for family reunification represented more than half of foreign-born people living in the country. In 2014, Poland had the largest proportion of foreign-born immigrants who migrated for educational purposes (15.9 %), while the largest proportion of people who migrated to look for international protection or asylum (20.6 %) was in Sweden.

Source data for tables and graphs
Data sources
The data collected by Eurostat came from the 2014 Labour Force survey (LFS) ad-hoc module on ‘The labour market situation of immigrants and their immediate descendants’. The target population of the 2014 LFS ad-hoc module consists of all people aged from 15-64 living in private households. The EU totals in the article do not include data for Germany, Denmark, Ireland and the Netherlands as these countries did not participate in the survey.
Context
There is high political and scientific interest in comparative information on the labour market and economic situation of immigrants. This set of comprehensive and comparable data on the situation of immigrants and their immediate descendants is aimed at monitoring progress on the situation of immigrants, to analyse the factors affecting their integration in and adaptation to the labour market and in the economy. The policy background for the 2014 ad-hoc module can be found in the following EU documents:
- The Zaragoza Declaration, adopted in April 2010 by EU Ministers responsible for immigrant integration issues, and approved at the Justice and Home Affairs Council on 3-4 June 2010. The Declaration calls upon the Commission (Eurostat and DG HOME) to carry out a pilot study to study common integration indicators from harmonised data sources.
- ‘EUROPE 2020: A strategy for smart, sustainable and inclusive growth’, outlining three mutually reinforcing objectives of smart, sustainable, and inclusive growth. It has a strong focus on employment, stressing the need for increasing labour market participation, with more and better jobs as essential elements of Europe’s socioeconomic model.
- The Commission Communication of 20 July 2011 on the ‘European Agenda for the Integration of Third Country Nationals’, which focuses on enhancing the economic, social and cultural benefits of migration in Europe and on achieving immigrants’ full participation in all aspects of collective life.
- The Commission Communication of 18 November 2011 on ‘The Global Approach to Migration and Mobility’, which sets out the Commission’s adapted policy framework on migration as part of a renewed Global Approach to Migration and Mobility (GAMM).
- The European Commission has adopted an Action Plan on the integration of third-country nationals on 7 June 2016, which provides a comprehensive framework to support Member States’ efforts in developing and strengthening their integration policies, and describes the concrete measures the Commission will implement in this regard.
Direct access to
- Labour market (labour)
- Employment and unemployment (Labour Force Survey) (employ)
- LFS ad-hoc modules (lfso)
- 2014. Migration and labour market (lfso_14)
- 2008. Labour market situation of immigrants (lfso_08)
- LFS ad-hoc modules (lfso)
- Employment and unemployment (Labour Force Survey) (employ)
The population is divided into three main ‘migration status’ categories, based on country of birth of the respondent and of their parents:
- first-generation immigrants (foreign-born[8] population);
- second-generation immigrants (native-born population with at least one foreign-born parent);
- native-born with native background.
This article looks not only at the differences between these categories, but also into their migration backgrounds. Thus, it looks into differences between people with an EU and a non-EU migration background and compares them with people without any migration background. In this context, ‘native origin’ means that the country of birth of the respondent and of her/his parents is the reporting country while ‘EU background’ means that the country of birth of the respondent or of her/his parents is an EU country different to the reporting country.
The migration background of a native-born adult is based on the country of birth of her/his parents. Thus, if neither parent is foreign-born, the native-born adult has native origins. However, if at least one parent is foreign-born, the native-born adult is considered to have an EU background if at least one parent is born in the EU (including in the reporting country), and a non-EU background if both parents are born outside the EU. The migration background of a foreign-born adult is based on his/her country of birth as follows: EU background if the country of birth is in the EU and non-EU background if it is not.
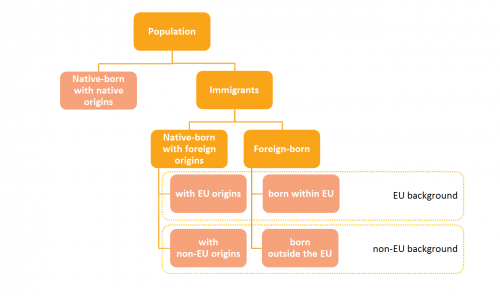
Five separate immigrant populations are analysed throughout this article (Figure 1):
- first-generation immigrants born in the EU;
- first-generation immigrants born outside the EU (e.g. born in a non-EU country);
- second-generation immigrants with EU origins (e.g. native-born population with at least one foreign parent where at least one parent is born in an EU country, including the reporting one );
- second-generation immigrants with non-EU origins (e.g. native-born population with both parents born outside the EU);
- native-born with native background (i.e. native-born population where both parents are also native-born).
- COM (2004) 811 Green Paper on an EU approach to managing economic migration
- COM (2005) 669 Communication from the Commission — Policy Plan on Legal Migration
- Summaries of EU Legislation: Policy plan on legal migration
- COM (2006) 402 Communication from the Commission on Policy priorities in the fight against illegal immigration of third-country nationals
- Summaries of EU Legislation: Policy priorities in the fight against illegal immigration
- COM (2007) 512 Communication from the Commission — Third Annual Report on Migration and Integration
- COM (2008) 611 Communication from the Commission — Strengthening the global approach to migration: increasing coordination, coherence and synergies
- Summaries of EU Legislation: Strengthening the Global Approach to Migration
- COM (2010) 171 Communication from the Commission — Delivering an area of freedom, security and justice for Europe's citizens — Action Plan Implementing the Stockholm Programme
- Summaries of EU Legislation: Action plan on the Stockholm Programme
Notes
- ↑ The LFS cover the resident population. Moreover, the concept of ‘usual residence’ is used to define an immigrant. The terms ‘to live’ and ‘to reside’ are used interchangeably in this article.
- ↑ The term ‘background’ refers here to the total of a person’s experience, knowledge and education (see Merriam-Webster dictionary). The ‘migration background’ refers thus to the origins of a person that is the main determinant of an immigrant’s experience, knowledge and education. Therefore, the terms ‘background’ and ‘origins’ are synonyms in the context of this article. While the official statistical terminology uses the term ‘background’, in data analysis the term ‘origins’ could also be used to give more fluidity to the text (as the term ‘origin’ is more frequently used in specialist literature and therefore preferred by the general public).
- ↑ Because Denmark, Ireland and the Netherlands did not participate in the 2014 LFS ad hoc module, the data for these countries are excluded from the EU aggregates when analysing the absolute differences across time (i.e. 2014 compared with 2008). When comparing the structural distributions, all participating countries are included in the EU aggregates, irrespective of whether the data are provided for both reference years.
- ↑ Foreigners are defined as people who do not hold the citizenship of the country of residence, regardless of whether they were born in that country or elsewhere
- ↑ See ‘Immigrant Naturalisation in the Context of Institutional Diversity: Policy Matters, but to Whom?’.
- ↑ The same statistics for the second-generation immigrants cannot be reproduced as their background is based on the country of birth of their two parents combined. It implies a huge number of possible combinations which are impossible to synthesize in limited reasonable cases. Moreover, the small sample sizes make it difficult to obtain reliable estimates.
- ↑ The table cannot provide the magnitude/amplitude of the shares, only their importance (through the rank), at national level.
- ↑ A foreign-born person is a person born in a country other than the residence country. The terms ‘first-generation immigrant’ and ‘foreign-born’ are used interchangeably in this article.
