Archive:SDG 9 - Industry, innovation and infrastructure (statistical annex)
This Statistics Explained article has been archived - for recent articles on sustainable development in the European Union see here.
Build resilient infrastructure, promote inclusive and sustainable industrialisation and foster innovation (statistical annex)
Data extracted in May 2021.
Highlights

This article provides an overview of statistical data on SDG 9 ‘Industry, innovation and infrastructure’ in the European Union (EU). It is based on the set of EU SDG indicators for monitoring of progress towards the UN Sustainable Development Goals (SDGs) in an EU context.
This article is a part of a set of statistical articles, which are based on the Eurostat publication ’Sustainable development in the European Union — Monitoring report on progress towards the SDGS in an EU context — 2021 edition’. This report is the fifth edition of Eurostat’s series of monitoring reports on sustainable development, which provide a quantitative assessment of progress of the EU towards the SDGs in an EU context.
Full article

Table 1: Indicators measuring progress towards SDG 9, EU
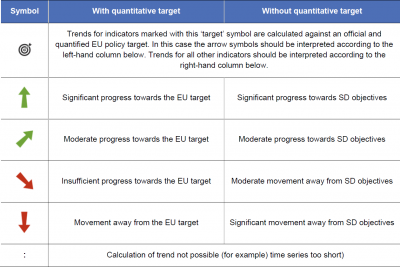
Table 2: Explanation of symbols for indicating progress towards SD objectives and targets


Gross domestic expenditure on R&D

This indicator measures gross domestic expenditure on R&D (GERD) as a percentage of the gross domestic product (GDP) — the R&D intensity. The Frascati Manual defines research and development (R&D) as creative and systematic work undertaken in order to increase the stock of knowledge — including knowledge of humankind, culture and society — and to devise new applications of available knowledge [1].
.png)
Compound annual growth rate (CAGR) for the total rate: 1.3 % per year (observed) and 2.0 % per year (required to meet target) in the period 2004–2019; 0.8 % per year (observed) and 2.2 % per year (required to meet target) in the period 2014–2019.
Source: Eurostat (sdg_09_10)
.png)
Source: Eurostat (sdg_09_10)
R&D personnel

This indicator measures the share of R&D personnel in the following institutional sectors: business enterprise, government, higher education and private non-profit. Data are presented in full-time equivalents as a share of the economically active population (the labour force). R&D personnel consists of those persons engaged directly in R&D — that is the creative and systematic work undertaken in order to increase the stock of knowledge and to devise new applications of available knowledge.
.png)
Compound annual growth rate (CAGR) for the total rate: 2.8 % per year in the period 2004–2019; 3.8 % per year in the period 2014–2019.
Source: Eurostat (sdg_09_30)
.png)
Source: Eurostat (sdg_09_30)
Patent applications to the European Patent Office
_evaluation_2021.png)
This indicator measures the requests for protection of an invention filed with the European Patent Office (EPO) regardless of whether they are granted or not. Applications are allocated according to the country of residence of the first applicant listed on the application form (first-named applicant principle). The country of residence of the applicant is not necessarily the same as the county of residence of the inventor.
,_EU,_2004-2020_(number).png)
Compound annual growth rate (CAGR) for the total rate: 1.4 % per year in the period 2005–2020; 1.0 % per year in the period 2015–2020.
Source: EPO, Eurostat (sdg_09_40)
,_by_country,_2015_and_2020_(per_million_inhabitants).png)
Source: EPO, Eurostat (sdg_09_40)
Air emissions intensity of industry

This indicator measures the emissions intensity of particulate matter (PM10 and PM2.5) from the manufacturing sector (NACE Rev. 2 sector ‘C’). Air emissions are defined as flows of gaseous and particulate materials emitted into the atmosphere. Fine and coarse particulates (PM10) are less than 10 micrometres in diameter and can be carried deep into the lungs, where they can cause inflammation and exacerbate the condition of people suffering from heart and lung diseases.Fine particulates (PM2.5) are less than 2.5 micrometres in diameter and are therefore a subset of the PM10 particles. Their negative health impacts are more serious than PM10 because they can be drawn further into the lungs and may be more toxic. Emission intensity is calculated by dividing the sector’s PM emissions by its gross value added (GVA), which is defined as output (at basic prices) minus intermediate consumption (at purchaser prices).
.png)
Compound annual growth rate (CAGR) for PM2.5: – 3.1 % per year in the period 2008–2018; – 2.3 % per year in the period 2013–2018.
Source: Eurostat (sdg_09_70)
,_by_country,_2013_and_2018_(grams_per_euro,_chain-linked_volumes,_2010).png)
Source: Eurostat (sdg_09_70)

This indicator measures the share of buses, including coaches and trolley-buses, and trains in total passenger transport, expressed in passenger-kilometres (pkm). Total passenger transport here includes transport by passenger cars, buses and coaches, and trains, but excludes inland waterways, air and sea transport. All data should be based on movements within national territories, regardless of the nationality of the vehicle. Road data stem from a voluntary collection and are not fully harmonised at the EU level. Tram and metro systems are not included because the data collection methodology for these means of transport is not sufficiently harmonised between Member States.
.png)
Compound annual growth rate (CAGR) for the total rate: – 0.04 % per year in the period 2003–2018; – 1.1 % per year in the period 2013–2018.
Source: Eurostat (sdg_09_50)
.png)
Source: Eurostat (sdg_09_50)

This indicator measures the share of rail and inland waterways in total inland freight transport, expressed in tonne-kilometres (tkm). Inland freight transport modes include road, rail and inland waterways. All data are based on movements on national territory; rail and inland waterways transport are collected based on movements on national territory, regardless of the nationality of the train or vessel. Road transport is redistributed to the national territory on the basis of reported data on the activity of the vehicles registered in each country and modelling the likely journey itinerary by projecting it on the European road network. Neither sea nor air freight transport are currently represented in the indicator.
.png)
Compound annual growth rate (CAGR) of the total rate: – 0.6 % per year in the period 2005–2019; – 1.9 % per year in the period 2014–2019.
Source: Eurostat (sdg_09_60)
.png)
Source: Eurostat (sdg_09_60)
Direct access to
Notes
- ↑ OECD (2015), Frascati Manual 2015: Guidelines for Collecting and Reporting Data on Research and Experimental Development, OECD Publishing, Paris, § 1.32.