Applying the degree of urbanisation manual - Constructing a population grid
5. Constructing a population grid
This article forms part of an online methodological manual, Applying the Degree of Urbanisation – A methodological manual to define cities, towns and rural areas for international comparisons: 2021 edition.
A population grid is a powerful tool: its main advantage is that it standardises reporting units. Population grids may be used to analyse issues that require a consistently high spatial resolution, such as access to public transport, exposure to flooding or patterns of urbanisation. Census enumeration areas provide a high level of spatial resolution in urban areas, but usually a much coarser resolution in rural areas, which makes them less suitable for this type of analysis.
Because a population grid is so useful, a number of organisations are promoting their production and use, including the United Nations Global Geospatial Information Management (UN GGIM), the United Nations Population Fund (UNFPA) and the POPGRID Data Collaborative initiative.
Population grids have a number of important advantages:
- grid cells all have the same size allowing for easy comparison;
- grids are stable over time [1];
- grids integrate easily with other data (for example, meteorological or air quality data);
- grid cells can be assembled to form areas reflecting a specific purpose and study area (mountain regions, water catchment areas, metropolitan areas).
The first modern population grids were produced in Scandinavia based on geo-coded population registers in the 1970s. Today, over 30 countries have an official population grid, including Brazil and all the countries in the European Statistical System (ESS). In addition, a substantial number of countries have recently conducted a geo-coded census or are preparing one. Such a census can produce a high quality official population grid (see Subchapter 5.1).
In the absence of a geo-coded census or population register, a disaggregation grid can be created by combining the population of census units (enumeration areas) with high-resolution land use data from national or global sources (see Subchapter 5.2). If census population data for an entire country are not available, models can estimate grid cell population data for areas not covered by the census (see Subchapter 5.3). Finally, a number of emerging sources of big data from mobile phones or social media can also be used to estimate a population grid, although these sources pose a number of issues of reliability and stability over time (see Subchapter 5.4).
To apply the degree of urbanisation, the population grid needs to be turned into a population density grid. For cells that are entirely covered by land, the calculation for population density is simple in an equal area projection: for example, if the number of inhabitants living in a 1 km2 grid cell is 100, the population density is simply 100 inhabitants per km2. However, for grid cells that are partially covered by water, the share of land in the total (surface) area needs to be calculated to adjust the population density. This can be done by combining the grid with a GIS layer identifying rivers, lakes and seas.
Full article
5.1 A grid based on the aggregation of point data
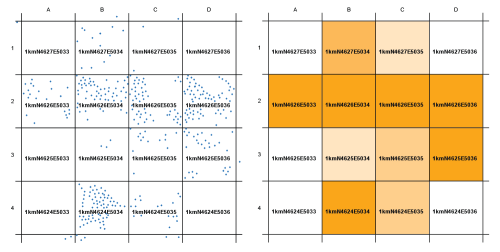
Ideally, a population grid is based on a geo-referenced point dataset with a high spatial accuracy (see Figure 5.1). This guarantees a high quality grid and avoids any need for estimations or disaggregations. These points can be derived from a variety of sources. A growing number of countries have or will conduct a digital census where the exact geographical location of each household is recorded [2]. Countries with a geo-coded cadastre, a building register or an address register can use these to generate a set of points with population data. Once the point data have been created, they can simply be aggregated to square grid cells.
The exact location of each household is considered confidential. However, aggregating these data to grid cells of 1 km2 is often sufficient to address confidentiality concerns. Some countries also apply a limited amount of record swapping to provide an even higher guarantee of confidentiality (Eurostat (2019) and GEOSTAT 1B).
5.2 A grid based on the disaggregation of population data
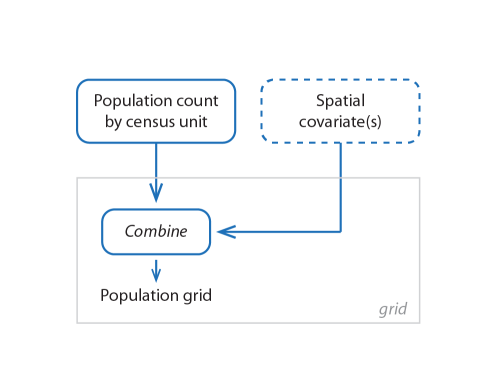
In the absence of point data, a population grid can be produced by disaggregating population data from census enumeration areas or administrative units (such as municipalities, districts or provinces) using auxiliary data with a higher spatial resolution, such as land cover or built-up area data, that are linked to the presence of people (see Figure 5.2).
In a disaggregation grid, the total population of a census unit or administrative unit is distributed across the grid cells covering that unit based on other data that are linked to the presence of people. This disaggregation can be done in a variety of ways. The simplest method relies on a single covariate and allocates the population proportionally to that covariate. GHS-POP R2019A (Freire et al. (2016); Schiavina et al. (2019)) is a good example of such an approach [3].
A slightly more complex method uses multiple covariates. For example, the population may be allocated proportionally to all built-up areas with the exception of non-residential areas and roads and railways. The European Settlement Map (Corbane and Sabo (2019); Corbane et al. (2020)) is an example that distinguishes between residential and non-residential building).
A more complex method uses multiple co-variates combined with a ‘random forest’ estimation technique to determine the weights to distribute the population. WorldPop (Tatem (2017)) is a good example of such an approach.
Regardless of the disaggregation method selected, two key issues will determine the quality of the resulting population grid. First, the size (area) of the units for which population data are available: the smaller the spatial unit, the higher the quality of the grid. Second, the quality of the covariate: a covariate that is closely linked to the presence of people and that avoids errors of omission and commission will produce a higher quality grid. For example, a geospatial layer of built-up areas or building footprints with high spatial resolution is considered to be highly suitable for such a purpose. Such sources are often based on remote sensing, which may not detect all built-up areas or buildings (omission) or may mistakenly identify some areas as built-up or as covered by a building (commission). Several organisations offer open access global layers based on remote sensing data, including the Global Human Settlement Layer (GHSL) produced by the European Commission’s Joint Research Centre (JRC).
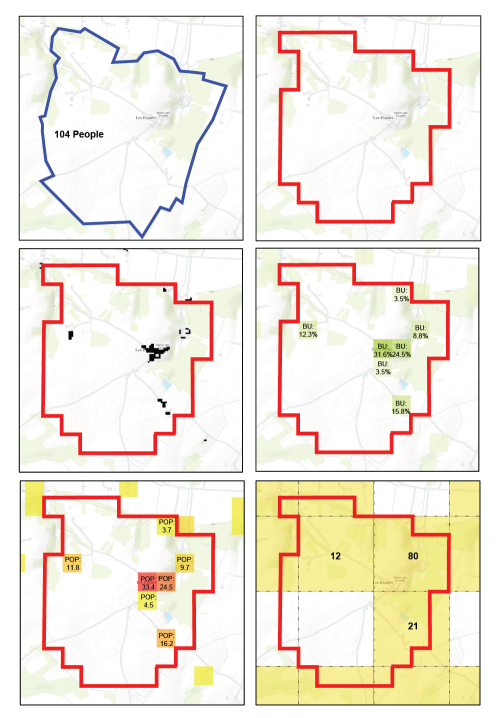
To allocate proportionally the population within a census unit based on a single covariate involves a number of steps that are presented in Figure 5.3. The first map shows a census unit and its population (p). The second map shows the boundary of this census unit rasterised using a 250 m grid. Through this process each 250 m cell is assigned to one and only one census unit [4]. This process can also be done at a finer resolution (100 m or smaller) to ensure a closer match between the original census unit and the assigned cells, although this requires a more powerful computer. The third map shows the built-up areas (b), which are mapped at 30 m resolution in binary fashion, in other words, built-up or not. The fourth map shows, for each 250 m cell, the built-up area within that cell as a share of the total built-up area within the census unit (b % = b in cell / b in census unit). The fifth map shows the population that has been allocated proportionally based on the share of the built-up area (POPcell = p * b %). Because the sum of the shares of built-up areas in all the cells in a census unit is 100 %, the sum of the population in these cells will exactly match the population of the census unit. The sixth map shows the population for a set of 1 km grid cells (in yellow). Note that the sum of the three 1 km2 grid cells (113 people) is higher than the population of the census unit (104 people) because these three grid cells include the population of a few 250 m cells that belong to neighbouring census units.
The GHS-POP (Freire et al. (2016); Schiavina et al. (2019)) is produced in this way. It disaggregates residential population estimates for four target years using the best available census units, adjusted to UN WPP estimates (the population input is the Gridded Population of the World v4.10 (CIESIN (2018)). The disaggregation is done using the built-up areas as detected by the GHSL.
5.3 Extrapolating a population grid based on a partial micro-census
Comprehensive and accurate population data for small areas can be costly and logistically challenging to collect, but they represent a fundamental basis for government decision and policymaking. In resource-constrained settings, national population and housing census data can be outdated, inaccurate, or missing specific groups, while registry data can be lacking or incomplete. In addition, certain areas of a country may not be included in national data collections due to conflict, inaccessibility or cost limitations. In such cases, a different approach is needed to produce a complete population grid.
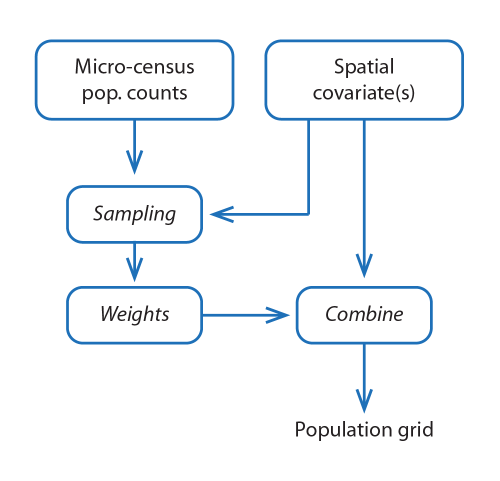
When a geo-referenced census is not available or it is considered unsuitable due to a lack of completeness, freshness, or reliability, a different approach can be employed to create a population grid. This technique is more challenging as it does not start from pre-existing population counts for the entire country; instead, the total is estimated using a population distribution model. Such an approach requires the availability of detailed and reliable data from a micro-census or survey which does not cover the entire country to develop a model. This technique estimates a count – at the level of grid cells – through combining sampling with ancillary data, typically remotely-sensed (for example, the density of buildings, urban areas). Given such a spatial covariate covering the whole country and surveys (micro-census) for a subset of the country, these data are combined to derive parameters or weights in a statistical model characterising the population’s distribution. This model is then used to predict the population’s distribution in non-surveyed areas (see Figure 5.4) under the assumption that the surveyed area is representative of the whole area.
Recent advances in the availability of detailed satellite imagery, geo-positioning tools for field surveys, statistical methods and computational power are providing opportunities to complement traditional collection methods for data on population by modelling and estimation into areas that were missed from enumeration (Wardrop et al. (2018)). Bayesian geostatistical modelling approaches to predict population numbers and age/sex structures from small area micro-census surveys, or incomplete census enumeration, have been developed and applied for multiple countries where instability, funding or other obstacles have limited recent national data collection exercises.
Using a set of spatially complete datasets as covariates, including satellite-derived building footprints, along with a spatial covariance structure makes it possible for models to predict population by age and sex in unobserved areas across a country, together with associated uncertainty metrics (Wardrop et al. (2018)). Cross-validation typically shows high model accuracies at subnational levels [5]. This technique has the potential to fill gaps where enumeration could not be undertaken and to provide contemporary, regularly-updated and accurate population information to support decision-making and development in challenging contexts [6]. Datasets built using these approaches for Nigeria, Zambia and the Democratic Republic of the Congo are available from WorldPop Open Population Repository.
5.4 Alternative and emerging data sources for creating population grids
In recent years, a number of emerging data sources and technologies have been explored for direct mapping of the population or as alternative proxies for its disaggregation; at present, this work has mainly been carried out as a proof-of-concept. Examples include data from mobile phones (Deville et al. (2014)), crowdsourcing/volunteered geographic information (Bakillah et al. (2014)) and location-based social media (Aubrecht et al. (2011) and (2017)). For example, in countries with a high mobile phone penetration rate and many mobile phone towers, the night-time location of mobile phones could be used to generate a high-resolution population grid. Some promising approaches involve the integration of conventional with unconventional data sources, for example, combining official statistics with big data from remote sensing, volunteered geographic information, social media and mobile phones (Aubrecht et al. (2018)).
However promising, there are a number of issues concerning these types of data and technologies, for example, the sustainability of such approaches, data access and ownership, privacy and anonymity of social media users, or representation bias (Zhang and Zhu (2018)). The main challenge for developers is how to scale-up highly localised approaches to wide geographical areas (continents, the world) to provide datasets that are open and free (in a sustainable way). Given these as yet unsolved challenges, such data cannot currently be used as a reliable substitute for an official population and housing census that – in addition to complying with strict technical and statistical specifications – collects a wealth of additional information on population characteristics and living conditions.
Direct access to
- Aubrecht, C., D. O. Aubrecht, J. Ungar, S. Freire and K. Steinnocher (2017), ‘VGDI – advancing the concept: volunteered geo-dynamic information and its benefits for population dynamics modeling’, Transactions in GIS, Volume 21, Issue 2, pp. 253-276.
- Aubrecht, C., J. Ungar and S. Freire (2011), ‘Exploring the potential of volunteered geographic information for modeling spatio-temporal characteristics of urban population: a case study for Lisbon metro using foursquare check-in data’, Proceedings of the 7th International Conference on Virtual Cities and Territories, pp. 57-60.
- Aubrecht, C., J. Ungar, D. O. Aubrecht, S. Freire and K. Steinnocher (2018), ‘Mapping land use dynamics using the collective power of the crowd’, Earth Observation Open Science and Innovation, ISSI Scientific Report Series, Volume 15, pp. 247-253.
- Bakillah, A., S. Liang, A. Mobasheri, J. J. Arsanjani and A. Zipf (2014), ‘Fine-resolution population mapping using OpenStreetMap points-of interest’, International Journal of Geographical Information Science, Volume 28, Issue 9, pp. 1 940-1 963.
- Center for International Earth Science Information Network (CIESIN), Columbia University (2018), Documentation for the Gridded Population of the World, Version 4 (GPWv4), Revision 11 Data Sets, NASA Socioeconomic Data and Applications Center (SEDAC), Palisades, NY.
- Corbane, C. and F. Sabo (2019), European Settlement Map from Copernicus Very High Resolution data for reference year 2015, Public Release 2019, European Commission, Joint Research Centre (JRC).
- Corbane, C., F. Sabo, V. Syrris, T. Kemper, P. Politis, M. Pesaresi, P. Soille and K. Osé (2020), ‘Application of the Symbolic Machine Learning to Copernicus VHR Imagery: the European Settlement Map’, IEEE Geoscience and Remote Sensing Letters, Volume 17, Issue 7, pp.1 153-1 157.
- Deville, P., C. Linard, S. Martin, M. Gilbert, F. R. Stevens, A. E. Gaughan, V. D. Blondel and A. J. Tatem (2014), ‘Dynamic population mapping using mobile phone data’, Proceedings of the National Academy of Sciences of the United States of America, Volume 111, No. 45, pp. 15 888-15 893.
- Eurostat (2019), Methodological manual on territorial typologies – 2018 edition, Publications Office of the European Union, Luxembourg.
- Freire, S., K. MacManus, M. Pesaresi, E. Doxsey-Whitfield and J. Mills (2016), Development of new open and free multi-temporal global population grids at 250 m resolution, Conference paper for AGILE 2016 – Helsinki, June 14-17, 2016, Association of Geographic Information Laboratories in Europe (AGILE).
- Schiavina, M., S. Freire and K. MacManus (2019), GHS-POP R2019A – GHS population grid multitemporal (1975, 1990, 2000, 2015), European Commission, Joint Research Centre (JRC).
- Tatem, A. (2017), ‘WorldPop, open data for spatial demography’, Scientific Data 4, Article No. 170004.
- Wardrop, N. A., W. C. Jochem, T. J. Bird, H. R. Chamberlain, D. Clarke, D. Kerr, L. Bengtsson, S. Juran, V. Seaman and A. J. Tatem (2018), ‘Spatially disaggregated population estimates in the absence of national population and housing census data’, Proceedings of the National Academy of Sciences, Volume 115, No. 14, pp. 3 529-3 537.
- Zhang, G. and A-X. Zhu (2018), ‘The representativeness and spatial bias of volunteered geographic information: a review’, Annals of GIS, Volume 24, Issue 3, pp. 151-162.
Notes
- ↑ Grids can be kept stable for future data collections, but it is difficult to construct reliable population grids for the past.
- ↑ United Nations Statistics Division, Guidelines on the use of electronic data collection technologies in population and housing censuses.
- ↑ Joint Research Centre, Global Human Settlement Layer.
- ↑ With the exception of census units that do not have a raster equivalent; the population of these units can be distributed across the cells with which it intersects.
- ↑ For example, the United Nations Population Fund.
- ↑ For example, the United Nations Population Fund or GRID3.


