Demo - Dominique - GOPA
<articlecontent>
Context
Access to water is a basic human need. Provision of drinking water and sanitation services is a matter of public and environmental health in the EU. Clean water in sufficient quantity is also of paramount importance for agriculture, industry and the environment and plays a crucial role in providing climate-related ecosystem services. The most important pressures on Europe's water resources are pollution, for example from agriculture as well as untreated or insufficiently treated municipal and industrial waste water discharges, and hydrological or physical alterations of water bodies. Also, over-abstraction can be a severe issue in southern Europe, in particular during the summer months and in densely populated areas. Consequently, protecting the quality of Europe’s water resources and ensuring their sustainable and efficient use are key elements of EU water policy.
Clean water and sanitation in the EU: overview and key trends
Monitoring SDG 6 in an EU context focuses on sanitation, water quality and water use efficiency. While the EU has further progressed on access to sanitation, trends in the area of water quality have been mixed over the past few years, with partly rising concentrations of pollutants in both surface and groundwater. Progress on water use efficiency cannot be assessed due to the seasonal variability of the balance between water abstraction and renewable fresh water resources.

Table 1: Indicators measuring progress towards SDG 6, EU
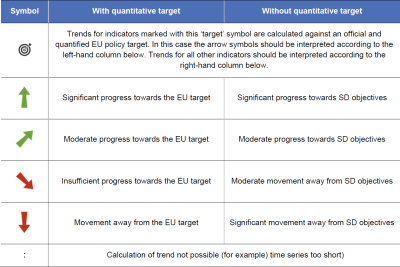
Table 2: Explanation of symbols for indicating progress towards SD objectives and targets


Sanitation
Provision of drinking water and the adequate treatment of sewage are matters of public and environmental health. As a vital resource, water is considered a public good in the EU. Water utilities are subject to strict regulation regarding the quality and efficiency of services. The indicators chosen to monitor sanitation are the share of the population having neither a bath, nor a shower, nor indoor flushing toilet in their household and the share of the population connected to at least secondary waste water treatment.
Most EU citizens have access to basic sanitation and are connected to secondary waste water treatment
Overall, connection rates and the quality of water services in the EU were already high more than 10 years ago, and have continued to improve. The share of the population that have neither a bath, shower, nor indoor flushing toilet in their household fell from 2.2 % in 2015 to 1.5 % in 2020. Data also show that the share of the EU population connected to secondary waste water treatment has increased continuously since 2000, reaching 80.9 % in 2019.
Conventional primary waste water treatment mainly removes suspended solids and only reduces organic water pollution by 20–30 %. Secondary treatment processes, which are typically applied after primary treatment, remove about 70 % of organic pollution. Growth in the share of people connected to secondary treatment indicates that the Urban Waste Water Treatment Directive, which was first implemented in the 1990s, has helped to reduce pollution and improve water quality in Europe’s rivers.
Different levels of access to water services and sanitation persist between Member States
Almost every household in the EU had basic sanitary facilities in 2020, and most countries reported that less than 1 % of their population were still living in households without a bath, shower or a flushing toilet. However, in some countries, this share remains comparatively high. In particular, Romania reported figures far above all other Member States, with 21.2 % of the population not having access to basic sanitary facilities in 2020. Relatively high shares were also reported by Lithuania, Bulgaria and Latvia with values between 6.4 % and 7.0 % in the same year. These figures highlight the strong link between access to basic sanitary facilities and poverty, which can be seen across the EU. In 2020, 5.2 % of poor people in the EU lacked access to a bath, shower or toilet in their households, compared with only 0.7 % of those living above the poverty threshold.
Connection to secondary waste water treatment is another important facility for enhancing access to sanitation. Connection rates to secondary treatment have increased slowly but continuously across the EU, with 80.9 % of the EU population being connected in 2019. This is about 10 percentage points higher than in 2004, when the connection rate was 70.4 %. Between 2014 and 2019, connection rates increased in almost all reporting Member States. The lowest-scoring countries were in south-east Europe. It is important to note that connection rates are not expected to reach 100 % in most cases because in some areas connection costs can be disproportionately high, in particular for rural areas with a low population density. The Urban Waste Water Treatment Directive only obliges bigger agglomerations to introduce secondary treatment, while requiring smaller agglomerations to apply an appropriate treatment (when waste water is collected) or other alternative solutions to reach the same level of protection for water bodies.
Water quality
Diffuse pollution by agriculture, accidental spillage of harmful substances and discharge of untreated or insufficiently treated domestic and industrial waste water, as well as atmospheric deposition of pollutants such as mercury, can pose a threat to human and environmental health. These pressures, along with changes to the structure and flow of water bodies, pose a barrier to sustainable development. Water quality monitoring distinguishes between different kinds of chemical pollution such as organic pollution by nutrients, pesticides and pathogens. In this report, water quality is monitored through four indicators looking at nutrients in freshwater and at bathing water quality [1].
Improved waste water treatment has led to less organic pollution in European rivers
Heavy organic pollution, caused by municipal waste water and effluents from industry or livestock, can lead to the deoxygenation of water, killing fish and invertebrates. Thanks to improved waste water collection and treatment as well as mature treatment, organic pollution in European rivers has been decling, though the trend has slowed in recent years. A proxy for organic water pollution is the amount of oxygen needed for microbes to digest organic pollution under standard conditions, expressed as biochemical oxygen demand (BOD). BOD values of rivers in Europe range from less than 1 milligram per litre (mg/L) (very clean) to more than 15 mg/L (heavily polluted).
Data available for 18 Member States show an overall decline of BOD in EU rivers, from 2.9 mg/L in 2004 to 2.5 mg/L in 2019. The trend, however, has not been continuous. While BOD levels had been falling until 2011, they had climbed back to 2.8 mg/L by 2015 but have been falling again since then. Overall, BOD levels in EU rivers have fallen by 13.8 % over the past 15 years, and by 2.7 % over the past five years. The overall decrease in BOD values is mainly linked to a general improvement in waste water collection and treatment throughout Europe.
Eutrophication is still a major issue for Europe’s aquatic environment
An assessment of European waters published by the European Environment Agency (EEA) in 2018 concludes that although nutrient pollution has fallen since the 1990s, it is still the main reason why 28 % of EU surface water bodies [2] have not achieved good water quality. In some regions, pollution of rivers with nitrate/ammonia (N) and phosphorous (P) is still causing severe eutrophication in coastal waters. Eutrophication can lead to algal blooms and oxygen depletion of surface waters, which in turn can harm fish, invertebrates and whole ecosystems.
The main sources of nutrient inputs are the use of fertilisers and animal waste in agriculture, as well as poorly treated waste water from industry [3]. Nitrates (NO3), among other chemicals, can infiltrate and contaminate groundwater bodies. They are the most common cause of poor chemical status of groundwater in the EU (18 % of groundwater bodies by area across 24 Member States are in poor status because of nitrates) [4]. This is particularly problematic because groundwater is an important source of drinking water in Europe.
They show a long-term stagnation of NO3 concentrations at around 21 milligrams per litre (mg/L), with a slight upward trend in recent years, increasing by 2.7 % between 2014 and 2019. Additionally, between 2016 and 2019, 14.1 % of groundwater stations showed NO3 concentrations above the threshold considered unfit for drinking, which is set at 50 mg/L by the Nitrates Directive [5]. The long-term stagnation of nitrate concentrations in EU groundwater is a result of opposing trends for individual groundwater bodies across Member States [6].
Data on phosphate (PO4) concentrations in EU rivers are available for 18 Member States. They show a marked improvement between 2007 and 2013, after which, however, the trend levelled off and even started increasing again. Thus, while the phosphate concentration of 0.06 mg/L recorded in 2019 is considerably below the values reported in the early 2000s, it is 13.2 % higher than in 2014. The overall positive long-term trend is to some extent the result of measures implemented under the Urban Waste Water Treatment Directive over the past 30 years, especially the introduction of phosphate-free detergents. The recent turnaround may be related to the slower decrease in phosphorus emissions from the agricultural sector [7] as well as increasing phosphorus fertiliser consumption in some Member States [8].
The share of inland bathing waters with excellent water quality has fallen in recent years
Contamination of water by faecal bacteria continues to pose a risk to human health. This is especially the case when it is found at bathing water sites, where it can cause illness among swimmers. Overall, the share of inland water bathing sites with excellent water quality in the EU increased between 2011 and 2017 but has been declining since then. The recent downward trend has been caused by a stagnation in the absolute number of bathing sites with excellent water quality, while the total number of bathing sites included in the assessment rose. According to the latest European Environment Agency (EEA) data, 77.7 % of inland water bathing sites showed excellent bathing water quality in 2020, compared with 81.1 % five years earlier. The major sources of bathing water pollution are sewage and water draining from farmland. Such pollution increases during heavy rains and floods which wash sewage overflow and polluted drainage water into rivers and seas.
- ↑ Chemical water quality is not evaluated in this report because of a lack of a comprehensive series of suitable data.
- ↑ European Environment Agency (2018), European waters — Assessment of status and pressures 2018, EEA Report No 7/2018, p. 63.
- ↑ European Environment Agency (2017), Emissions of pollutants to Europe’s waters — sources, pathways and trends, ETC/ICM report, p. 17.
- ↑ European Environment Agency (2018), European waters — Assessment of status and pressures 2018, EEA Report No 7/2018, p. 52.
- ↑ European Commission (2021), Report from the Commission to the Council and the European Parliament on the implementation of Council Directive 91/676/EEC concerning the protection of waters against pollution caused by nitrates from agricultural sources based on Member State reports for the period 2016–2019 p. 4.
- ↑ European Environment Agency (2020), Nutrients in freshwater in Europe.
- ↑ European Environment Agency (2020), Nutrients in freshwater in Europe; and Eurostat (2018)
- ↑ Eurostat (2018), Statistics Explained, Agri-environmental indicator - mineral fertiliser consumption.