Most linked-to files
Showing below up to 50 results in range #21 to #70.
View (previous 50 | next 50) (20 | 50 | 100 | 250 | 500)
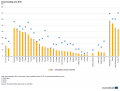
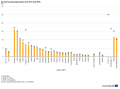
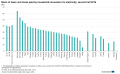
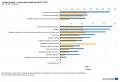
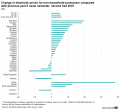 Change in electricity prices for non-household consumers compared with previous year, same semester, second half 2019.png Used on 21 pages
1,012 × 930; 67 KB
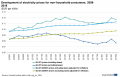
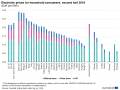
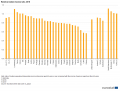
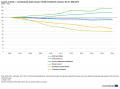
 Development of electricity prices for household consumers, 2008-2019 (EUR per kWh).png Used on 21 pages
1,575 × 996; 100 KB
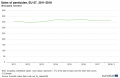
 Development of electricity prices for non-household consumers, 2008-2019 (EUR per kWh).png Used on 21 pages
1,037 × 664; 62 KB


 Electricity prices for household consumers, second half 2019 (EUR per kWh).png Used on 21 pages
1,001 × 753; 93 KB
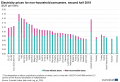 Electricity prices for non-household consumers, second half 2019 (EUR per kWh).png Used on 21 pages
1,003 × 684; 86 KB
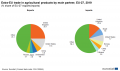 Extra-EU trade in agricultural products by main partner, EU-27, 2019 (% share of EU-27 exports imports) FP20.png Used on 21 pages
1,025 × 604; 39 KB
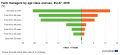

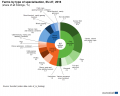 Farms by type of specialisation, EU-27, 2016 (share of all holdings, %) FP20.png Used on 21 pages
1,024 × 822; 63 KB
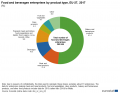 Food and beverages enterprises by product type, EU-27, 2017 (%) FP20.png Used on 21 pages
1,001 × 774; 47 KB
 Housing cost overburden rate, analysed by tenure status, 2018 (%) SILC20.png Used on 21 pages
1,026 × 837; 52 KB
 Inequality of income distribution — income quintile share ratio, 2018 SILC20.png Used on 21 pages
1,000 × 694; 79 KB
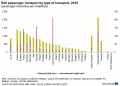
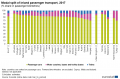 Modal split of inland passenger transport, 2017 (% share in passenger-kilometres).png Used on 21 pages
1,001 × 658; 100 KB
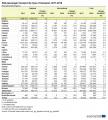 Rail passenger transport by type of transport, 2017-2018 (thousand passengers).png Used on 21 pages
764 × 849; 91 KB
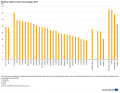
 Rail passenger transport by type of transport, 2018 (passenger-kilometres per inhabitant).png Used on 21 pages
1,136 × 818; 81 KB
 Seaborne passengers embarked and disembarked in all ports, 2015-2018 (thousand passengers).png Used on 21 pages
705 × 794; 81 KB
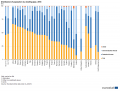
 Share of taxes and levies paid by household consumers for electricity, second half 2019 (%).png Used on 21 pages
1,267 × 780; 94 KB
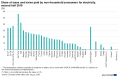 Share of taxes and levies paid by non-household consumers for the electricity, second half 2019 (%).png Used on 21 pages
1,080 × 689; 74 KB
 Top 15 airports in the EU-27, 2018 (million passengers carried).png Used on 21 pages
1,001 × 514; 45 KB
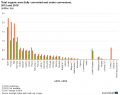 Total organic area (fully converted and under conversion), 2012 and 2018 (million ha) FP20.png Used on 21 pages
1,000 × 791; 43 KB
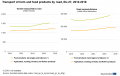 Transport of farm and food products by road, EU-27, 2010-2018 FP20.png Used on 21 pages
1,023 × 644; 36 KB
 Waste generation by economic activities and households, EU-27, 2016 (%) FP20.png Used on 21 pages
1,000 × 566; 37 KB
 Acquisitions of citizenship by group of previous citizenship, 2018.png Used on 20 pages
1,024 × 752; 79 KB
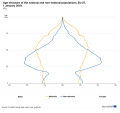 Age structure of the national and non-national populations, EU-27, 1 January 2019 (%).png Used on 20 pages
1,095 × 1,033; 65 KB
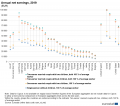

 Average utilised agricultural area per holding, 2010 and 2013 (¹) (hectares) YB16.png Used on 20 pages
1,005 × 760; 38 KB
 Causes of death — standardised death rate, 2017 (per 100 000 inhabitants) Health20.png Used on 20 pages
1,024 × 868; 84 KB
 Causes of death — standardised death rate, EU-27, 2016 (per 100 000 inhabitants) Health20.png Used on 20 pages
1,031 × 708; 37 KB
 Causes of death — standardised death rate per 100 000 inhabitants, females, EU-27, 2006-2016 (2006 = 100) Health20.png Used on 20 pages
1,015 × 749; 38 KB

.png)
.png)
_SILC20.png)
_SILC20.png)
.png)
.png)
_FP20.png)
_FP20.png)
_FP20.png)
_FP20.png)
_FP20.png)
_SILC20.png)

.png)
_SILC20.png)
.png)
.png)
_SILC20.png)

_FP20.png)
.png)
_SILC20.png)
_FP20.png)
.png)
.png)
.png)
,_2012_and_2018_(million_ha)_FP20.png)

_FP20.png)

.png)
.png)
.png)
_(hectares)_YB16.png)
_Health20.png)
_Health20.png)
_Health20.png)