File list
This special page shows all uploaded files.
| Date | Name | Thumbnail | Size | User | Description | Versions |
|---|---|---|---|---|---|---|
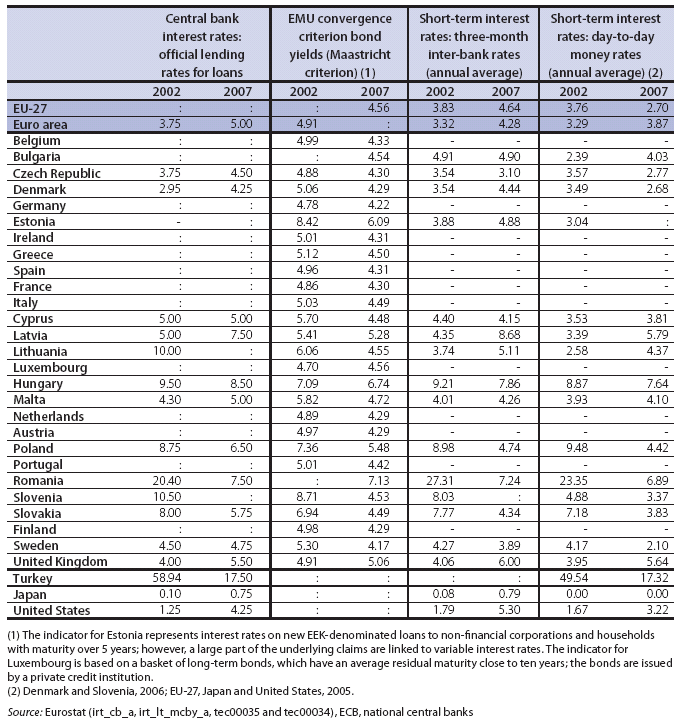
| 11:59, 30 April 2009 | Interest rates (%).PNG (file) | .PNG) |
82 KB | Maintenance script | Importing image file | 1 |
| 11:59, 30 April 2009 | Investment per person employed by size of regional workforce, chemicals manufacturing (NACE division 24), by NUTS 2 regions, 2005.PNG (file) | ,_by_NUTS_2_regions,_2005.PNG) |
538 KB | Maintenance script | Importing image file | 1 |
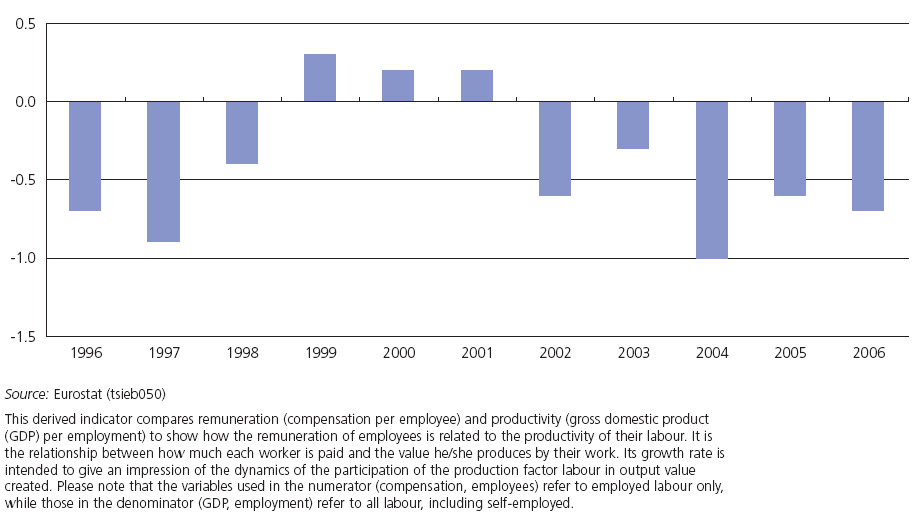
| 11:59, 30 April 2009 | Labour cost growth, EU-27.PNG (file) |  |
41 KB | Maintenance script | Importing image file | 1 |
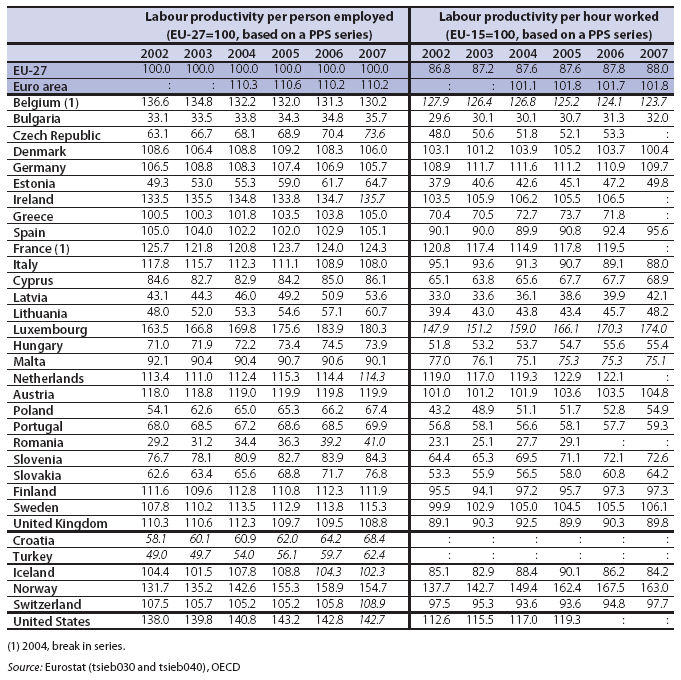
| 11:59, 30 April 2009 | Labour productivity.PNG (file) |  |
97 KB | Maintenance script | Importing image file | 1 |
| 11:59, 30 April 2009 | Overweight people, 2003 (1)(% of total population).PNG (file) | (%25_of_total_population).PNG) |
22 KB | Maintenance script | Importing image file | 1 |
| 11:59, 30 April 2009 | People killed in road accidents, 2006(persons killed per million inhabitants).PNG (file) | .PNG) |
18 KB | Maintenance script | Importing image file | 1 |
| 11:59, 30 April 2009 | Proportion of electricity generated from renewable energy sources(% of gross electricity consumption).PNG (file) | .PNG) |
20 KB | Maintenance script | Importing image file | 1 |
| 11:59, 30 April 2009 | Protected areas for biodiversity, habitats Directive, 2007.PNG (file) |  |
26 KB | Maintenance script | Importing image file | 1 |
| 11:59, 30 April 2009 | 20090304093232!Real GDP growth, EU-27 (% change compared with the previous year).PNG (file) | .PNG) |
4 KB | Maintenance script | Importing image file | 1 |
| 11:59, 30 April 2009 | Acquisition of citizenship and asylum applications(persons).PNG (file) | .PNG) |
90 KB | Maintenance script | Importing image file | 1 |
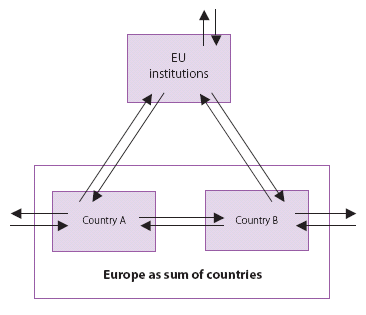
| 11:59, 30 April 2009 | Europe as sum of countries.png (file) |  |
10 KB | Maintenance script | Importing image file | 1 |
| 11:59, 30 April 2009 | Gender pay gap - female earnings lower than male earnings, 2006 (% difference between average gross hourly earnings of male and female employees, as % of male gross earnings, unadjusted form).PNG (file) | .PNG) |
9 KB | Maintenance script | Importing image file | 1 |
| 11:59, 30 April 2009 | Hospital beds (per 100 000 inhabitants).PNG (file) | .PNG) |
35 KB | Maintenance script | Importing image file | 1 |
| 11:59, 30 April 2009 | Main trading partners for exports, EU-27, 2007 (% share of extra EU-27 exports).PNG (file) | .PNG) |
12 KB | Maintenance script | Importing image file | 1 |
| 11:59, 30 April 2009 | Minimum wage and proportion of employees earning the minimum wage.PNG (file) |  |
102 KB | Maintenance script | Importing image file | 1 |
| 11:59, 30 April 2009 | Proportion of enterprises that have remote employed persons who connect to IT systems from home, 2006 (1) (% of enterprises).PNG (file) | _(%25_of_enterprises).PNG) |
36 KB | Maintenance script | Importing image file | 1 |
| 11:59, 30 April 2009 | Total population change, by NUTS 2 regions, average 2001 to 2005.PNG (file) |  |
519 KB | Maintenance script | Importing image file | 1 |
| 11:59, 30 April 2009 | 20090210125945!Daily smokers, 2003 (1) (% of male female population).PNG (file) | _(%25_of_male_female_population).PNG) |
10 KB | Maintenance script | Importing image file | 1 |
| 11:59, 30 April 2009 | Agricultural area by land use, EU (1).PNG (file) | .PNG) |
27 KB | Maintenance script | Importing image file | 1 |
| 11:59, 30 April 2009 | Individuals' level of computer skills, 2007 (% of all individuals aged 16 to 74).PNG (file) | .PNG) |
9 KB | Maintenance script | Importing image file | 1 |
| 11:59, 30 April 2009 | International Sourcing of ICT services broken down by business partner.PNG (file) |  |
33 KB | Maintenance script | Importing image file | 1 |
| 11:59, 30 April 2009 | International trade for services, EU-27 (1).PNG (file) | .PNG) |
24 KB | Maintenance script | Importing image file | 1 |
| 11:59, 30 April 2009 | Live births and deaths in the EU-27.PNG (file) |  |
12 KB | Maintenance script | Importing image file | 1 |
| 11:59, 30 April 2009 | Positive impacts of International Sourcing.PNG (file) |  |
23 KB | Maintenance script | Importing image file | 1 |
| 11:59, 30 April 2009 | Price indices of agricultural output (nominal), EU-27 (2000=100).PNG (file) | ,_EU-27_(2000%3D100).PNG) |
14 KB | Maintenance script | Importing image file | 1 |
| 11:59, 30 April 2009 | Production sold in value terms, selected products, EU-27, 2007.PNG (file) |  |
106 KB | Maintenance script | Importing image file | 1 |
| 11:59, 30 April 2009 | Volume of inland passenger transport, 2004.PNG (file) |  |
20 KB | Maintenance script | Importing image file | 1 |
| 11:59, 30 April 2009 | 20090304153653!GDP per capita at current market prices, 2007.PNG (file) |  |
24 KB | Maintenance script | Importing image file | 1 |
| 11:59, 30 April 2009 | Burglary 2004.PNG (file) |  |
25 KB | Maintenance script | Importing image file | 1 |
| 11:59, 30 April 2009 | Guarantees provided by Central Government (as % of total debt), 2007.PNG (file) | ,_2007.PNG) |
14 KB | Maintenance script | Importing image file | 1 |
| 11:59, 30 April 2009 | Healthy life years at birth, 2005 (1).PNG (file) | .PNG) |
147 KB | Maintenance script | Importing image file | 1 |
| 11:59, 30 April 2009 | Index of underperforming regions (UPR) in terms of unemployment, at NUTS level 2.PNG (file) | _in_terms_of_unemployment,_at_NUTS_level_2.PNG) |
55 KB | Maintenance script | Importing image file | 1 |
| 11:59, 30 April 2009 | Net migration (including corrections)(1 000).PNG (file) | (1_000).PNG) |
65 KB | Maintenance script | Importing image file | 1 |
| 11:59, 30 April 2009 | Number of sites having implemented an eco-management and audit scheme (EMAS), 2007 (1) (per million inhabitants).PNG (file) | ,_2007_(1)_(per_million_inhabitants).PNG) |
14 KB | Maintenance script | Importing image file | 1 |
| 11:59, 30 April 2009 | Breakdown of production of vegetables, EU, 2007 (1)(% of total, based on tonnes).PNG (file) | (%25_of_total,_based_on_tonnes).PNG) |
17 KB | Maintenance script | Importing image file | 1 |
| 11:59, 30 April 2009 | Debt by Maturity, 2007.PNG (file) |  |
24 KB | Maintenance script | Importing image file | 1 |
| 11:59, 30 April 2009 | Earnings in industry and services (average gross annual earnings of full-time employees in enterprises with 10 or more employees), 2006 (1) son.PNG (file) | ,_2006_(1)_son.PNG) |
9 KB | Maintenance script | Importing image file | 1 |
| 11:59, 30 April 2009 | Environmental protection expenditure by the public sector, EU-25, 2002 (1).PNG (file) | .PNG) |
25 KB | Maintenance script | Importing image file | 1 |
| 11:59, 30 April 2009 | General government expenditure by COFOG function, 2006 (1) (% of GDP).PNG (file) | _(%25_of_GDP).PNG) |
26 KB | Maintenance script | Importing image file | 1 |
| 11:59, 30 April 2009 | Hospital discharges of in-patients by diagnosis, average length of stay, 2005.PNG (file) |  |
90 KB | Maintenance script | Importing image file | 1 |
| 11:59, 30 April 2009 | Individuals using the Internet for interacting with public authorities, 2007 (% of all individuals aged 16 to 74).PNG (file) | .PNG) |
42 KB | Maintenance script | Importing image file | 1 |
| 11:59, 30 April 2009 | Information technology expenditure, 2006 (1) (% of GDP).PNG (file) | _(%25_of_GDP).PNG) |
8 KB | Maintenance script | Importing image file | 1 |
| 11:59, 30 April 2009 | 20090205140359!Total financing for developing countries, EU-15.PNG (file) |  |
66 KB | Maintenance script | Importing image file | 1 |
| 11:59, 30 April 2009 | 20090303101401!Waste treatment (non-hazardous), recovery, 2006.PNG (file) | ,_recovery,_2006.PNG) |
68 KB | Maintenance script | Importing image file | 1 |
| 11:59, 30 April 2009 | 20090304131644!Government revenue and expenditure, 2007 (1) (% of GDP).PNG (file) | _(%25_of_GDP).PNG) |
9 KB | Maintenance script | Importing image file | 1 |
| 11:59, 30 April 2009 | 20090304151336!GDP per capita at current market prices, 2007.PNG (file) |  |
28 KB | Maintenance script | Importing image file | 1 |
| 11:59, 30 April 2009 | Employment rate by gender, 2006.PNG (file) |  |
78 KB | Maintenance script | Importing image file | 1 |
| 11:59, 30 April 2009 | Individuals regularly using the Internet by type of connection, 2006.PNG (file) |  |
41 KB | Maintenance script | Importing image file | 1 |
| 11:59, 30 April 2009 | Labour productivity per hour worked.PNG (file) |  |
40 KB | Maintenance script | Importing image file | 1 |
| 11:59, 30 April 2009 | Production of cereals, EU-27, 2006 (1).PNG (file) | .PNG) |
21 KB | Maintenance script | Importing image file | 1 |